| Param | Original file | Final file |
|---|---|---|
| Filename | modeM0/AS1A05_174T01_9000005820_42614cztM0_level2.fits | modeM0/AS1A05_174T01_9000005820_42614cztM0_level2_quad_clean.evt |
| Size (bytes) | 192,899,520 | 54,457,920 |
| Size | 184.0 MB | 51.9 MB |
| Events in quadrant A | 1,773,610 | 360,150 |
| Events in quadrant B | 1,501,130 | 373,032 |
| Events in quadrant C | 1,665,953 | 357,250 |
| Events in quadrant D | 1,943,215 | 326,067 |
| Mode M9 | |||
|---|---|---|---|
| Quadrant | BADHDUFLAG | Total packets | Discarded packets |
| A | 0 | 16 | 0 |
| B | 0 | 16 | 0 |
| C | 0 | 16 | 0 |
| D | 0 | 16 | 0 |
| Mode SS | |||
|---|---|---|---|
| Quadrant | BADHDUFLAG | Total packets | Discarded packets |
| A | 0 | 68 | 0 |
| B | 0 | 68 | 0 |
| C | 0 | 68 | 0 |
| D | 0 | 68 | 0 |
| Mode M0 | |||
|---|---|---|---|
| Quadrant | BADHDUFLAG | Total packets | Discarded packets |
| A | 0 | 7216 | 1 |
| B | 0 | 6646 | 1 |
| C | 0 | 6892 | 1 |
| D | 0 | 8059 | 1 |
| Quadrant | Total seconds | Saturated seconds | Saturation percentage |
|---|---|---|---|
| A | 3273 | 7 | 0.213871% |
| B | 3273 | 6 | 0.183318% |
| C | 3273 | 11 | 0.336083% |
| D | 3273 | 51 | 1.558203% |
Noise dominated data is calculated using 1-second bins in cleaned event files. If a bin has >2000 counts, and if more than 50% of those come from <1% of pixels, then it is considered to be noise-dominated and hence unusable.
| Quadrant | # 1 sec bins | Bins with >0 counts | Bins with >2000 counts | High rate bins dominated by noise | Noise dominated (total time) | Noise dominated (detector-on time) | Marked lightcurve |
|---|---|---|---|---|---|---|---|
| A | 4887 | 3274 | 0 | 0 | 0.00% | 0.00% | 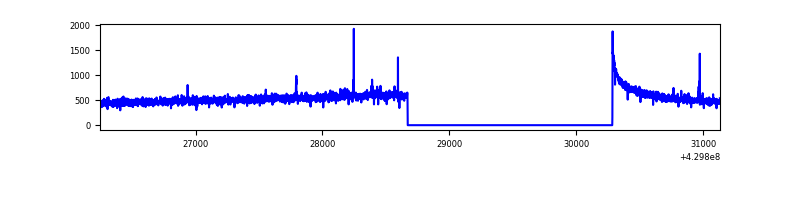 |
| B | 4887 | 3274 | 1 | 1 | 0.02% | 0.03% | 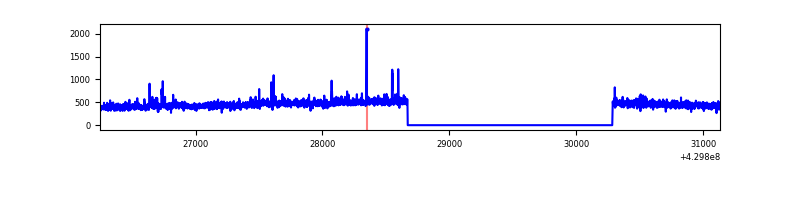 |
| C | 4887 | 3274 | 6 | 6 | 0.12% | 0.18% | 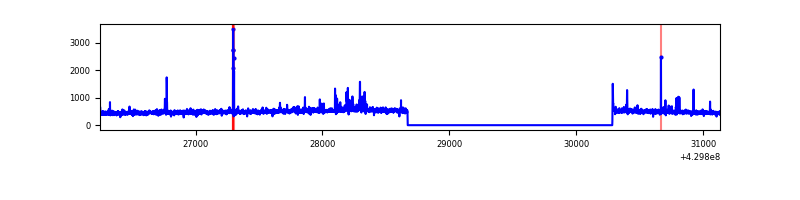 |
| D | 4887 | 3274 | 31 | 31 | 0.63% | 0.95% | 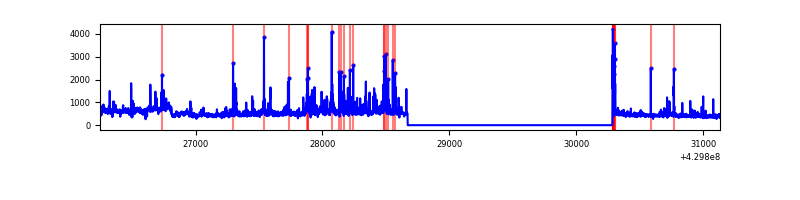 |
Top three noisy pixels from each quadrant. If the there are fewer than three noisy pixels in the level2.evt file, extra rows are filled as -1
| Pixel properties | Quadrant properties | ||||||
|---|---|---|---|---|---|---|---|
| Quadrant | DetID | PixID | Counts | Sigma | Mean | Median | Sigma |
| A | 10 | 83 | 317732 | 4062.41 | 373 | 365 | 78.1 |
| A | 13 | 248 | 5928 | 71.21 | 373 | 365 | 78.1 |
| A | 3 | 137 | 4135 | 48.26 | 373 | 365 | 78.1 |
| B | 0 | 245 | 24915 | 335.6 | 369 | 359 | 73.2 |
| B | 12 | 111 | 9234 | 121.29 | 369 | 359 | 73.2 |
| B | 11 | 111 | 8542 | 111.84 | 369 | 359 | 73.2 |
| C | 15 | 214 | 134979 | 1549.32 | 367 | 369 | 86.9 |
| C | 15 | 111 | 43358 | 494.79 | 367 | 369 | 86.9 |
| C | 14 | 254 | 33823 | 385.05 | 367 | 369 | 86.9 |
| D | 2 | 16 | 144256 | 1603.61 | 366 | 355 | 89.7 |
| D | 1 | 52 | 110279 | 1224.97 | 366 | 355 | 89.7 |
| D | 1 | 47 | 71150 | 788.93 | 366 | 355 | 89.7 |
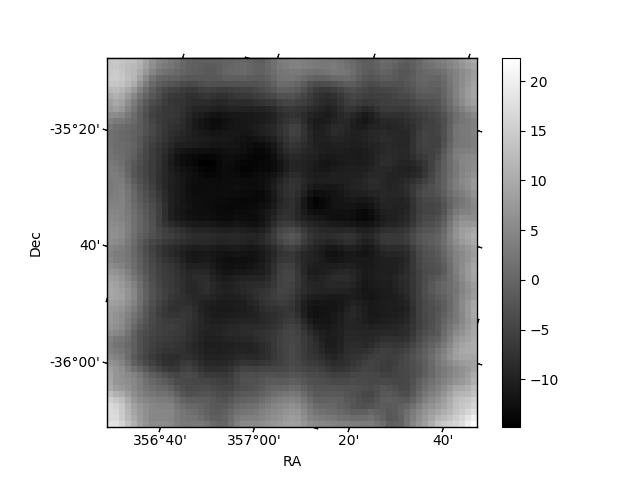
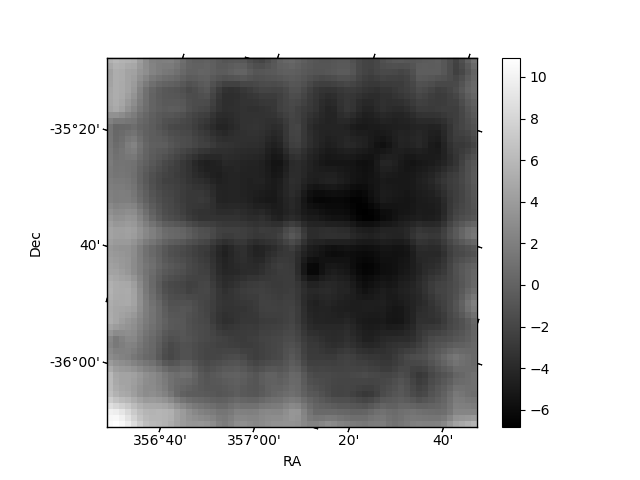
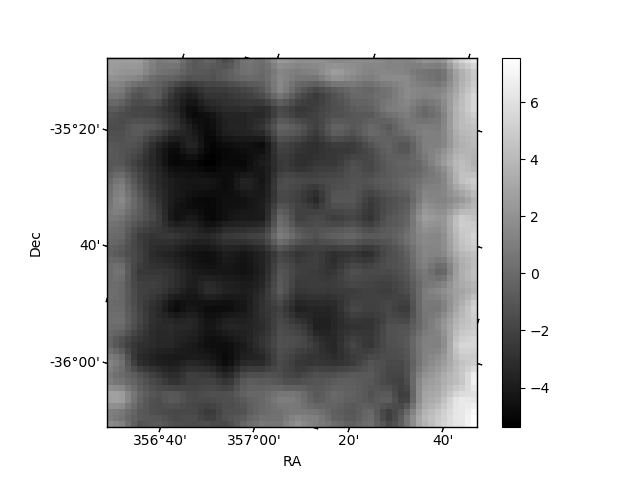
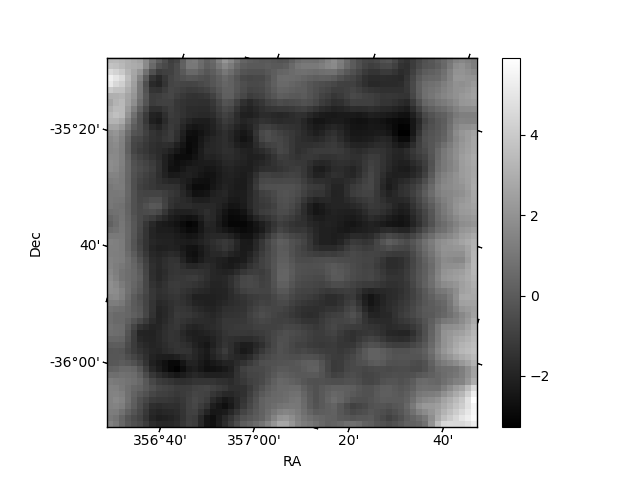
Histogram calculated using DETX and DETY for each event in the final _common_clean file
| Quadrant A | 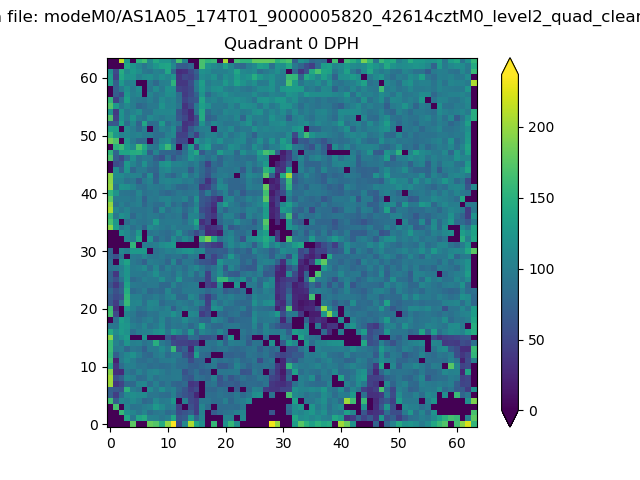 |
 |
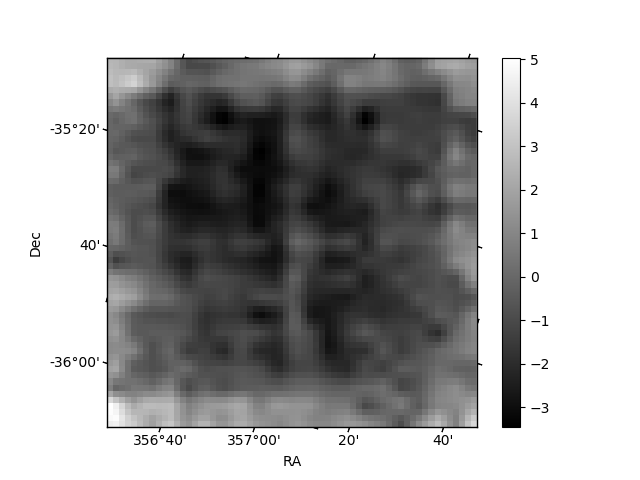
Quadrant B |
|---|---|---|---|
| Quadrant D | 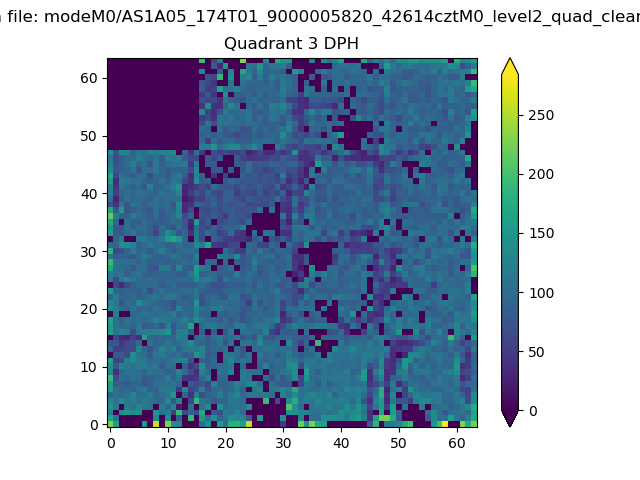 |
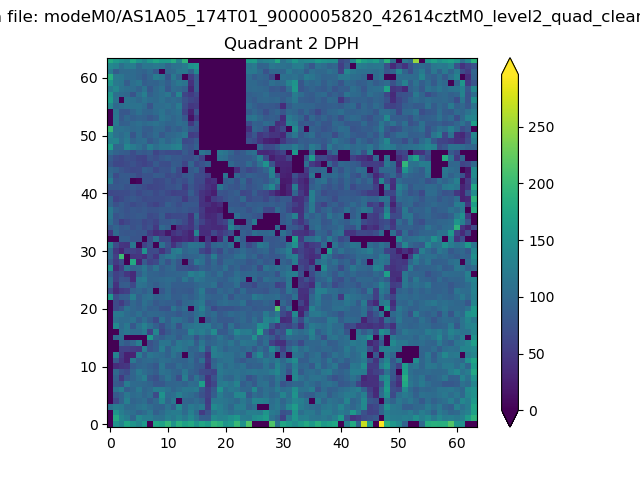 |
Quadrant C |
| Plot type | Count rate plots | Images |
|---|---|---|
| Comparison with Poisson distribution Blue bars denote a histogram of data divided into 1 sec bins. Red curve is a Poisson curve with rate = median count rate of data. |
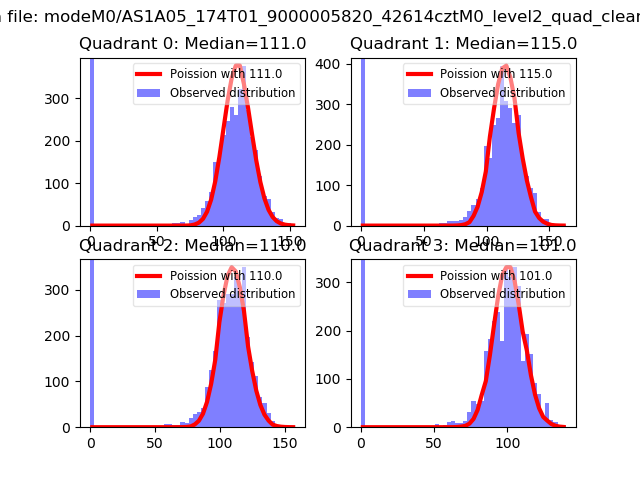 |
 |
| Quadrant-wise count rates Data is divided into 100 sec bins |
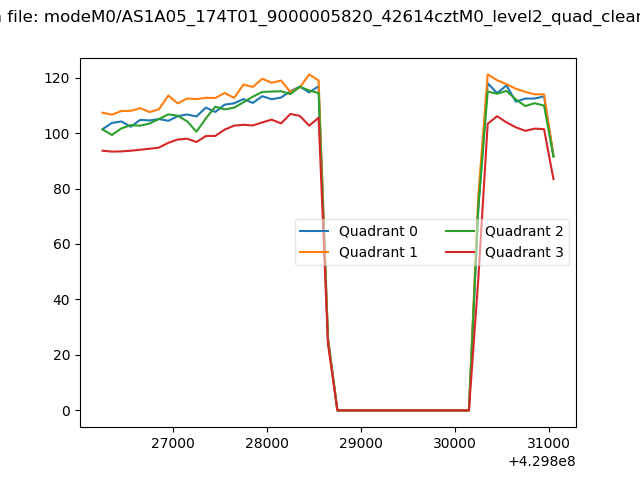 |
|
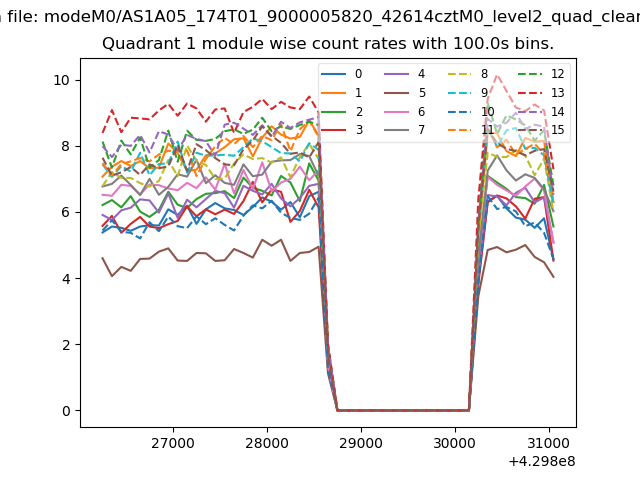
| Module-wise count rates for Quadrant A Data is divided into 100 sec bins |
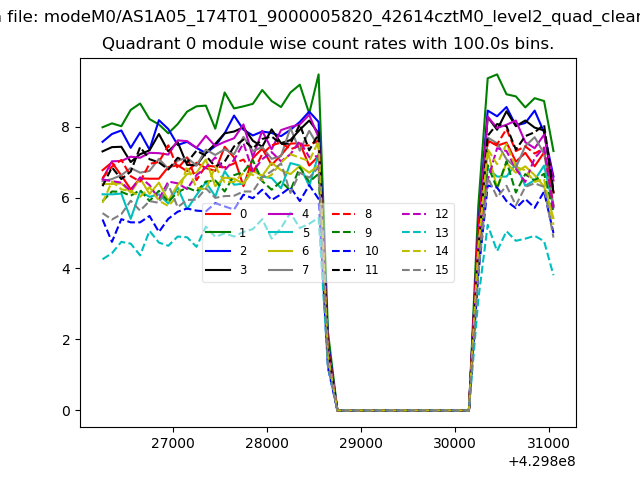 |
 |
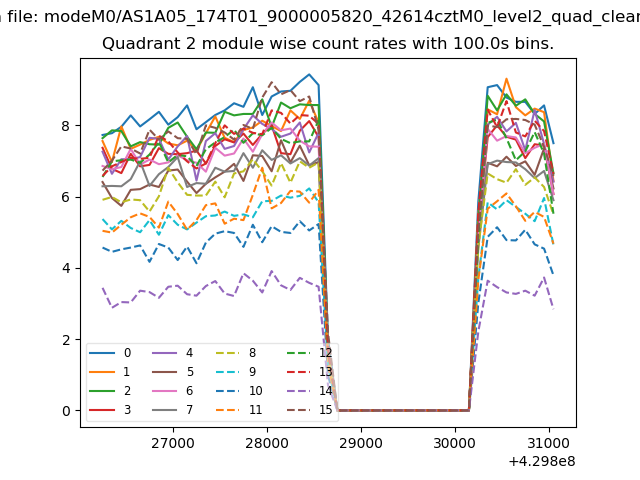
| Module-wise count rates for Quadrant B Data is divided into 100 sec bins |
 |
 |
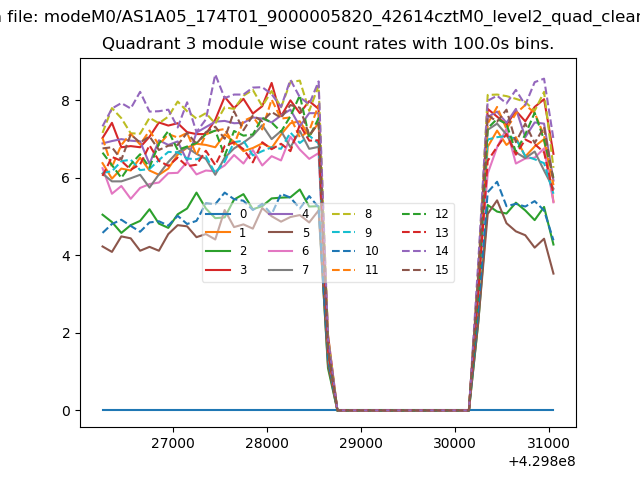
| Module-wise count rates for Quadrant C Data is divided into 100 sec bins |
 |
 |
| Module-wise count rates for Quadrant D Data is divided into 100 sec bins |
 |
 |
| Parameter | Plot |
|---|---|
| CZT HV Monitor | 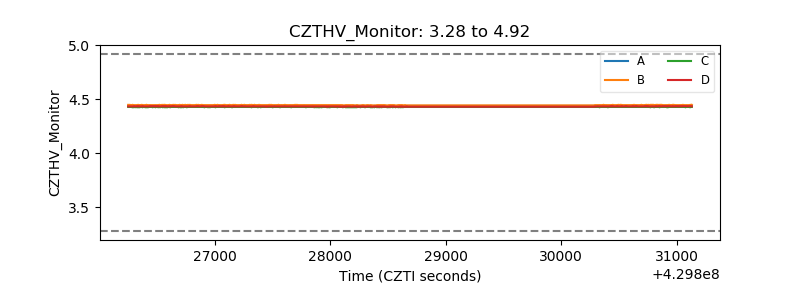 |
| D_VDD | 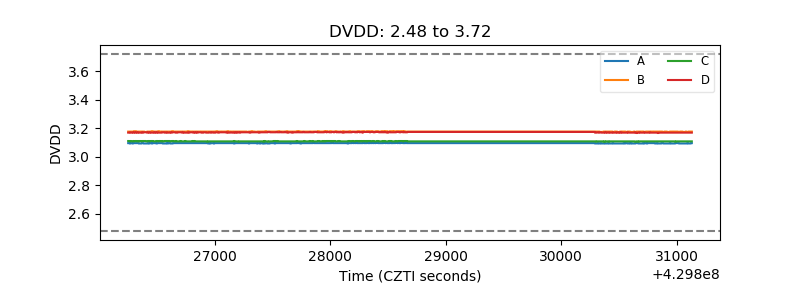 |
| Temperature 1 | 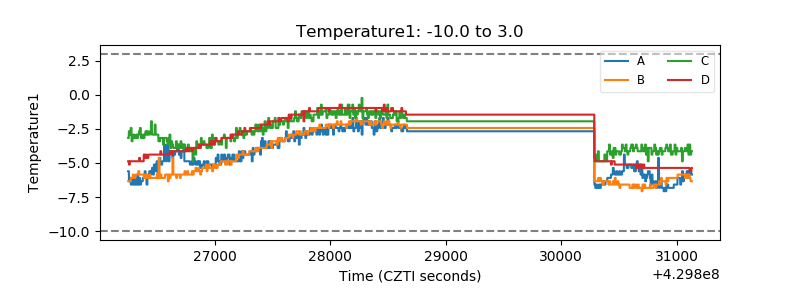 |
| Veto HV Monitor | 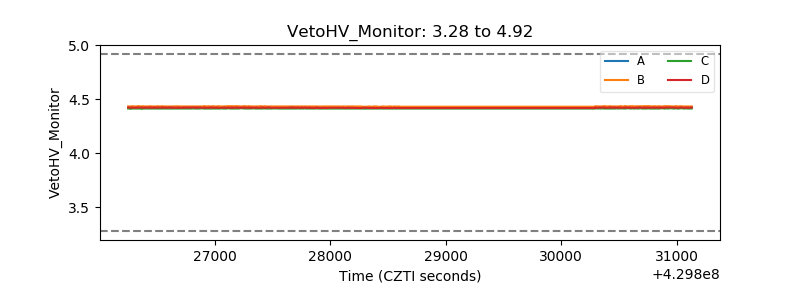 |
| Veto LLD | 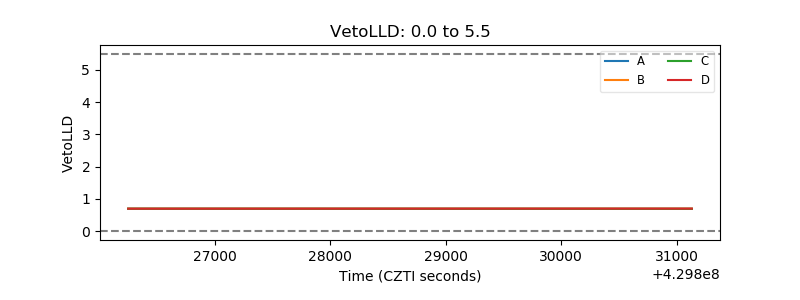 |
| Alpha Counter | 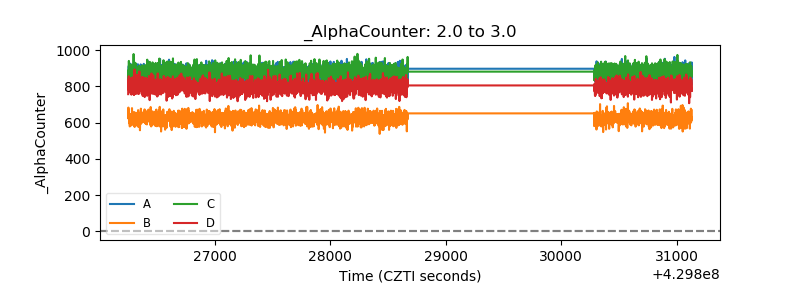 |
| _CPM_Rate | 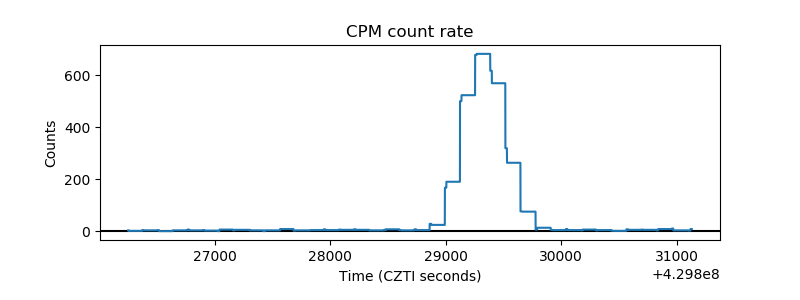 |
| CZT Counter | 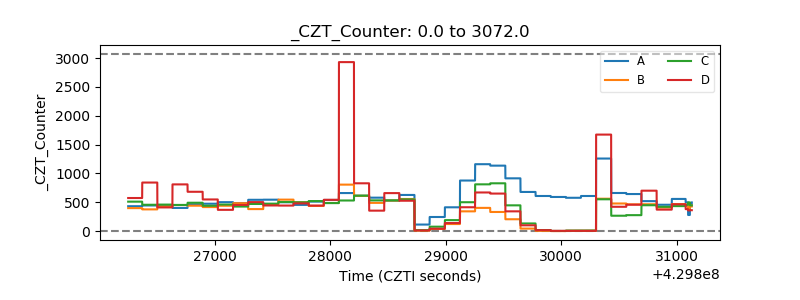 |
| +2.5 Volts monitor | 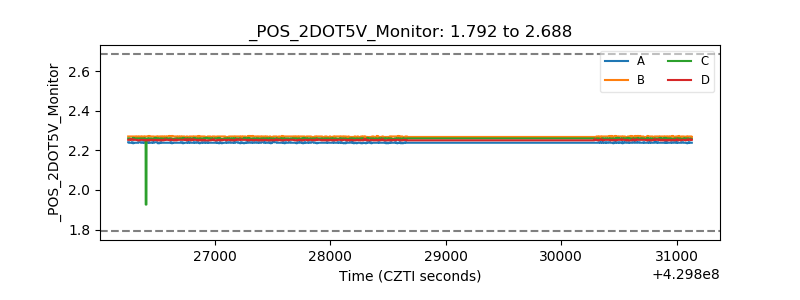 |
| +5 Volts monitor |  |
| _ROLL_ROT | 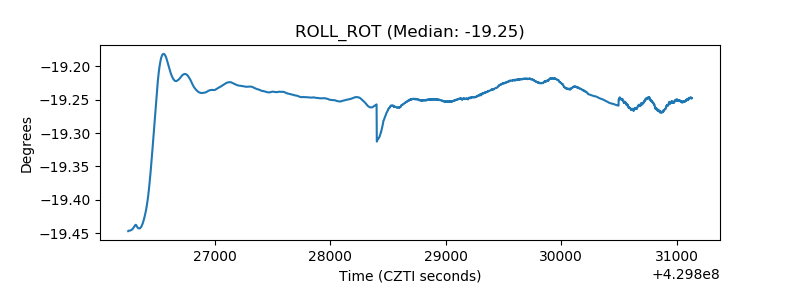 |
| _Roll_DEC | 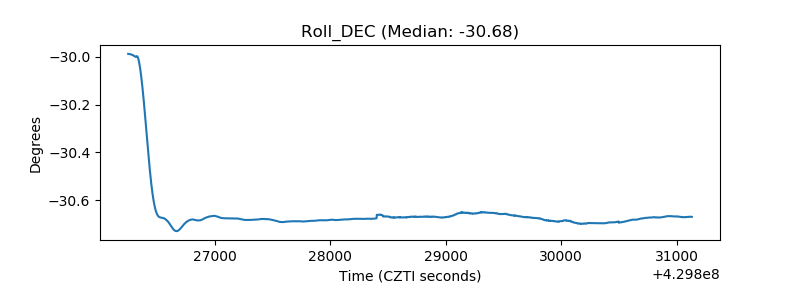 |
| _Roll_RA | 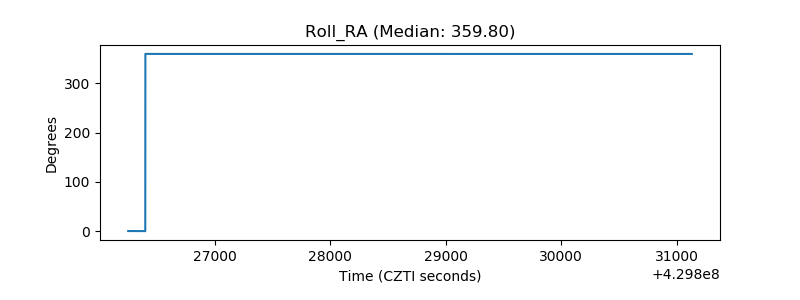 |
| Veto Counter | 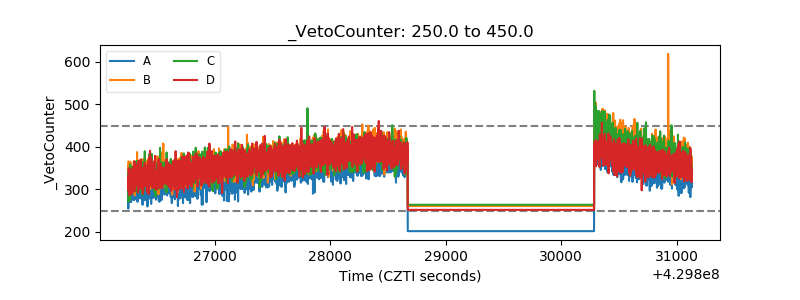 |