| Param | Original file | Final file |
|---|---|---|
| Filename | modeM0/AS1A05_174T01_9000005820_42616cztM0_level2.fits | modeM0/AS1A05_174T01_9000005820_42616cztM0_level2_quad_clean.evt |
| Size (bytes) | 404,081,280 | 111,804,480 |
| Size | 385.4 MB | 106.6 MB |
| Events in quadrant A | 3,622,338 | 744,713 |
| Events in quadrant B | 3,033,673 | 772,224 |
| Events in quadrant C | 3,286,631 | 741,230 |
| Events in quadrant D | 4,493,593 | 659,858 |
| Mode M9 | |||
|---|---|---|---|
| Quadrant | BADHDUFLAG | Total packets | Discarded packets |
| A | 0 | 34 | 0 |
| B | 0 | 34 | 0 |
| C | 0 | 34 | 0 |
| D | 0 | 34 | 0 |
| Mode SS | |||
|---|---|---|---|
| Quadrant | BADHDUFLAG | Total packets | Discarded packets |
| A | 0 | 138 | 0 |
| B | 0 | 138 | 0 |
| C | 0 | 138 | 0 |
| D | 0 | 138 | 0 |
| Mode M0 | |||
|---|---|---|---|
| Quadrant | BADHDUFLAG | Total packets | Discarded packets |
| A | 0 | 14846 | 2 |
| B | 0 | 13604 | 2 |
| C | 0 | 13823 | 2 |
| D | 0 | 18047 | 2 |
| Quadrant | Total seconds | Saturated seconds | Saturation percentage |
|---|---|---|---|
| A | 6703 | 16 | 0.238699% |
| B | 6703 | 12 | 0.179024% |
| C | 6703 | 9 | 0.134268% |
| D | 6704 | 286 | 4.266110% |
Noise dominated data is calculated using 1-second bins in cleaned event files. If a bin has >2000 counts, and if more than 50% of those come from <1% of pixels, then it is considered to be noise-dominated and hence unusable.
| Quadrant | # 1 sec bins | Bins with >0 counts | Bins with >2000 counts | High rate bins dominated by noise | Noise dominated (total time) | Noise dominated (detector-on time) | Marked lightcurve |
|---|---|---|---|---|---|---|---|
| A | 10080 | 6705 | 6 | 6 | 0.06% | 0.09% | 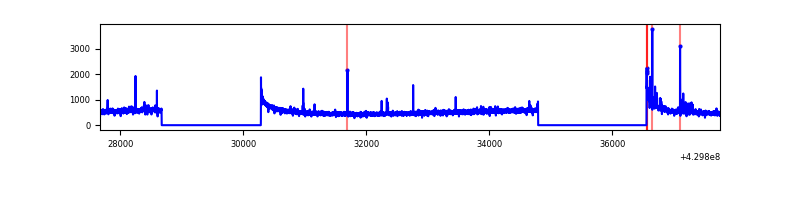 |
| B | 10080 | 6705 | 2 | 2 | 0.02% | 0.03% | 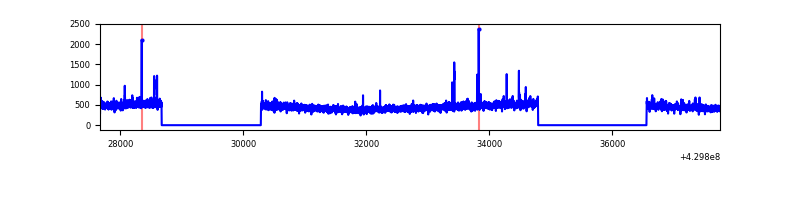 |
| C | 10080 | 6705 | 1 | 1 | 0.01% | 0.01% | 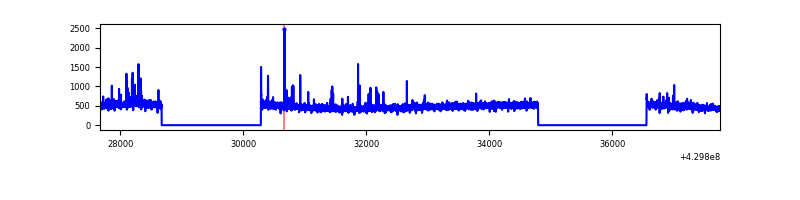 |
| D | 10081 | 6706 | 241 | 241 | 2.39% | 3.59% | 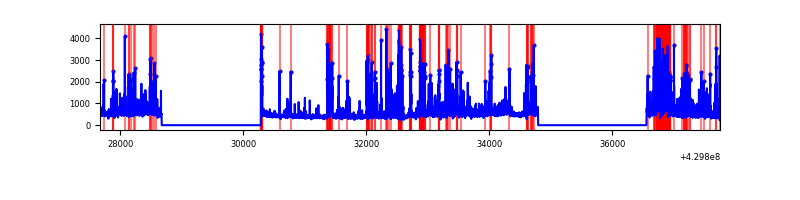 |
Top three noisy pixels from each quadrant. If the there are fewer than three noisy pixels in the level2.evt file, extra rows are filled as -1
| Pixel properties | Quadrant properties | ||||||
|---|---|---|---|---|---|---|---|
| Quadrant | DetID | PixID | Counts | Sigma | Mean | Median | Sigma |
| A | 10 | 83 | 642702 | 4140.69 | 750 | 734 | 155.0 |
| A | 7 | 3 | 51502 | 327.45 | 750 | 734 | 155.0 |
| A | 15 | 237 | 13618 | 83.1 | 750 | 734 | 155.0 |
| B | 0 | 245 | 40068 | 270.73 | 746 | 725 | 145.3 |
| B | 12 | 111 | 18571 | 122.81 | 746 | 725 | 145.3 |
| B | 0 | 168 | 18556 | 122.7 | 746 | 725 | 145.3 |
| C | 15 | 214 | 276582 | 1577.65 | 743 | 750 | 174.8 |
| C | 14 | 254 | 50270 | 283.24 | 743 | 750 | 174.8 |
| C | 3 | 233 | 27243 | 151.53 | 743 | 750 | 174.8 |
| D | 1 | 52 | 714961 | 3988.45 | 729 | 710 | 179.1 |
| D | 12 | 6 | 528611 | 2947.85 | 729 | 710 | 179.1 |
| D | 13 | 249 | 148157 | 823.36 | 729 | 710 | 179.1 |
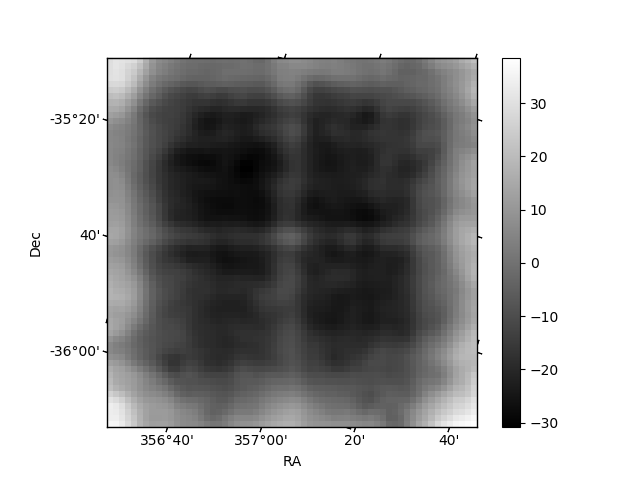
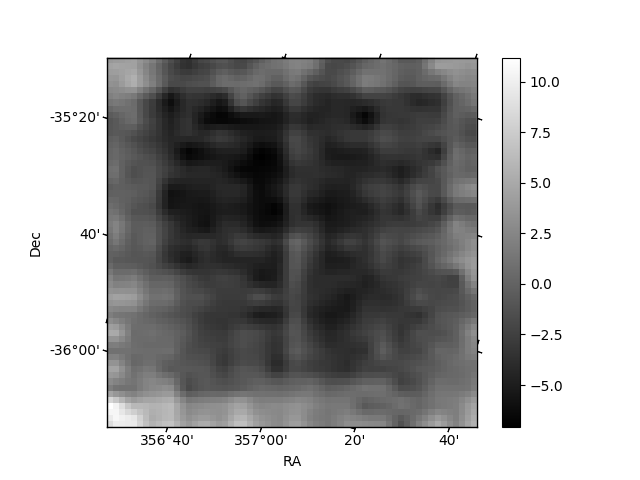
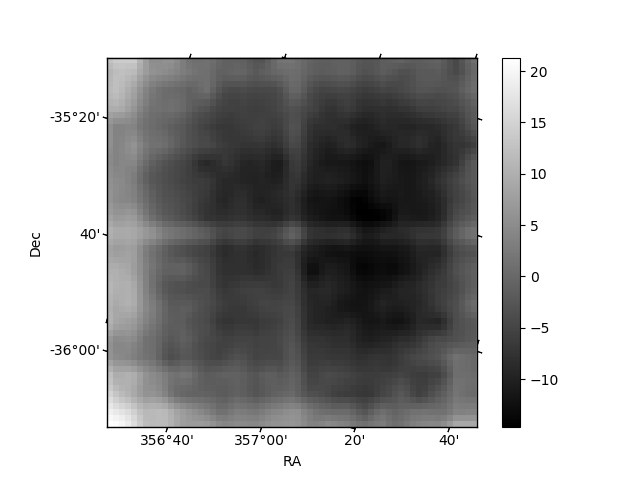
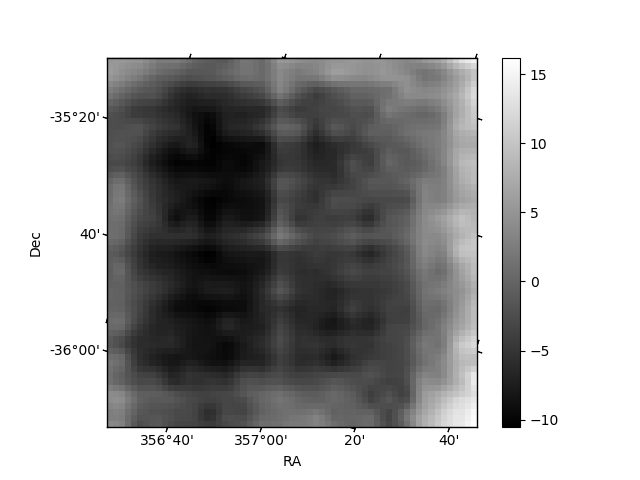
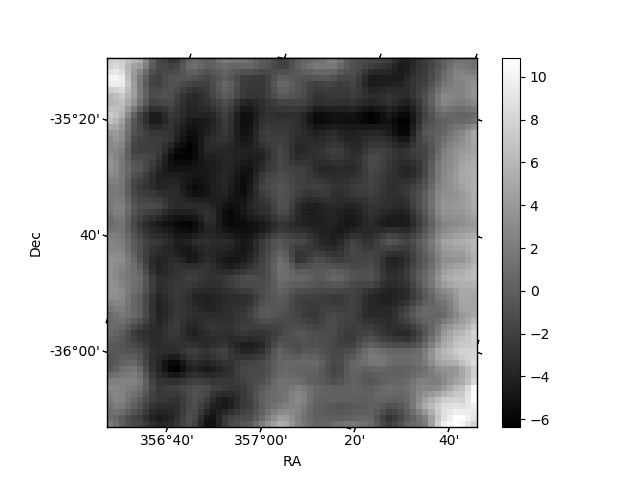
Histogram calculated using DETX and DETY for each event in the final _common_clean file
| Quadrant A | 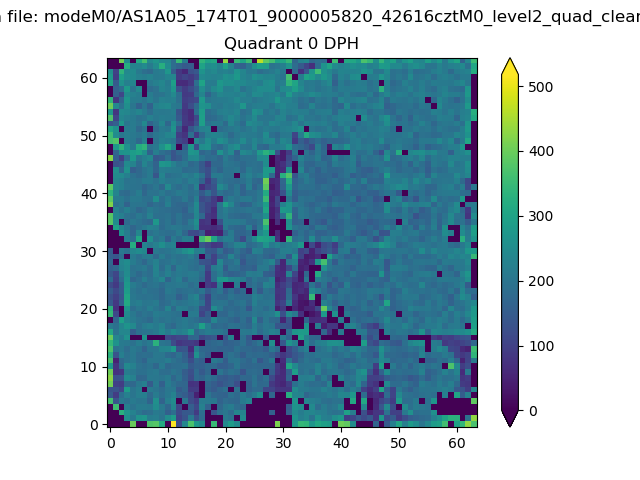 |
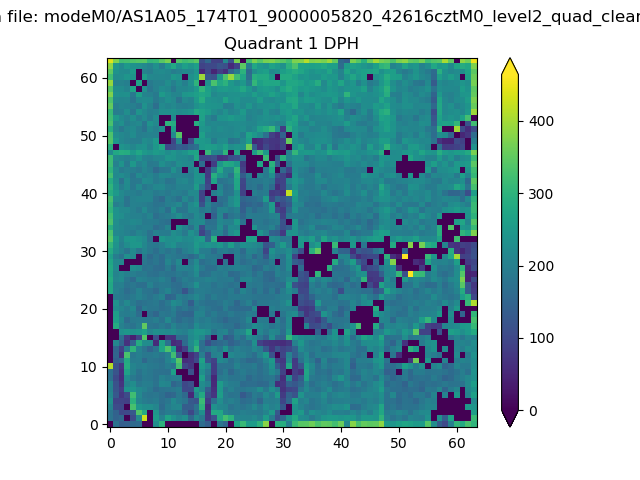 |
Quadrant B |
|---|---|---|---|
| Quadrant D | 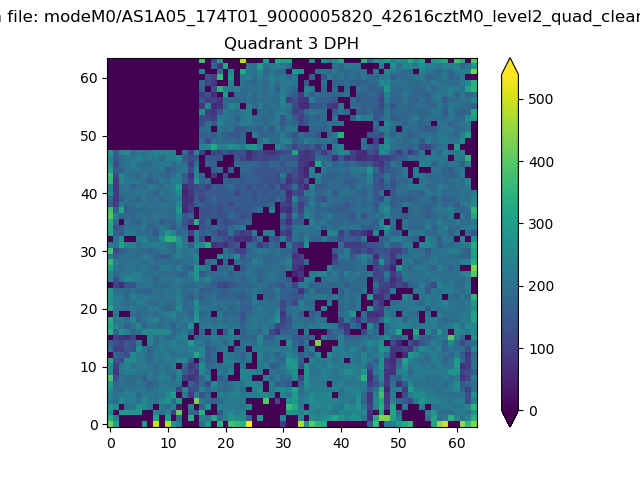 |
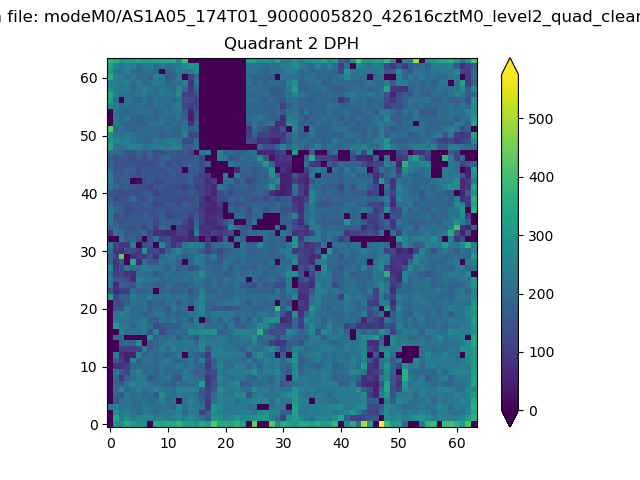 |
Quadrant C |
| Plot type | Count rate plots | Images |
|---|---|---|
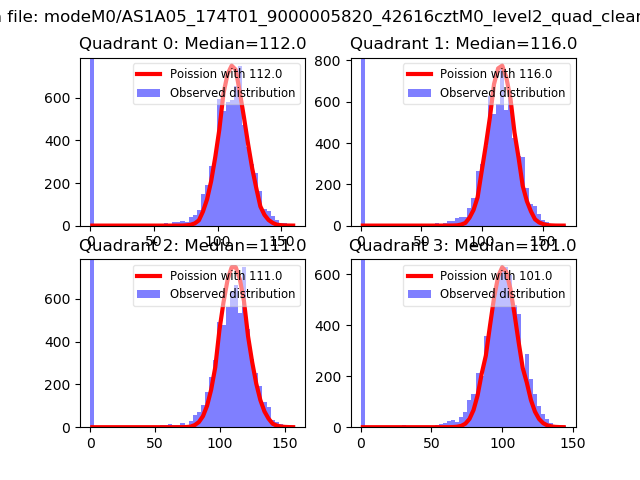
| Comparison with Poisson distribution Blue bars denote a histogram of data divided into 1 sec bins. Red curve is a Poisson curve with rate = median count rate of data. |
 |
 |
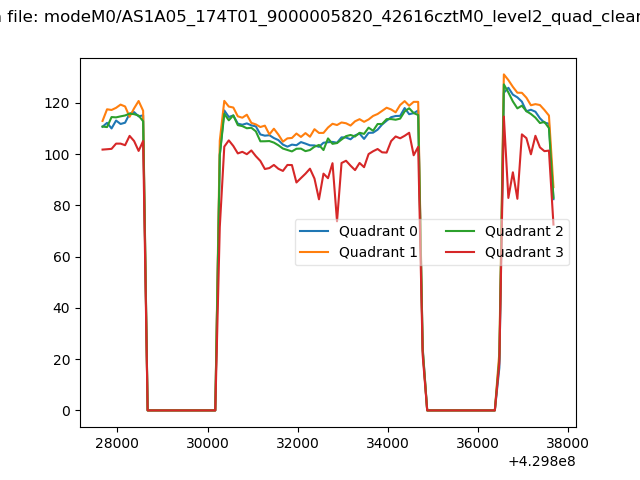
| Quadrant-wise count rates Data is divided into 100 sec bins |
 |
|
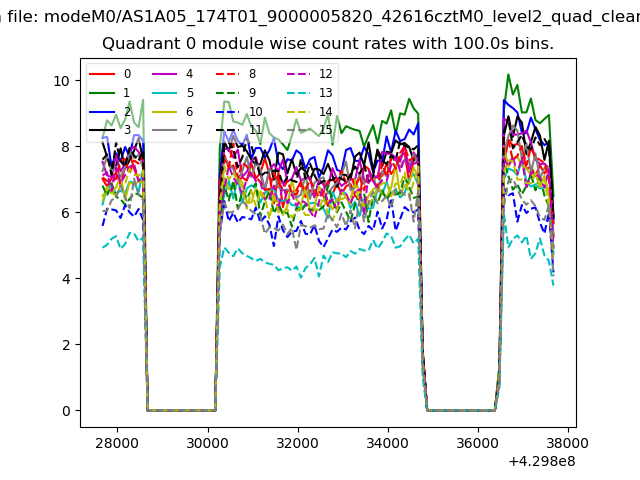
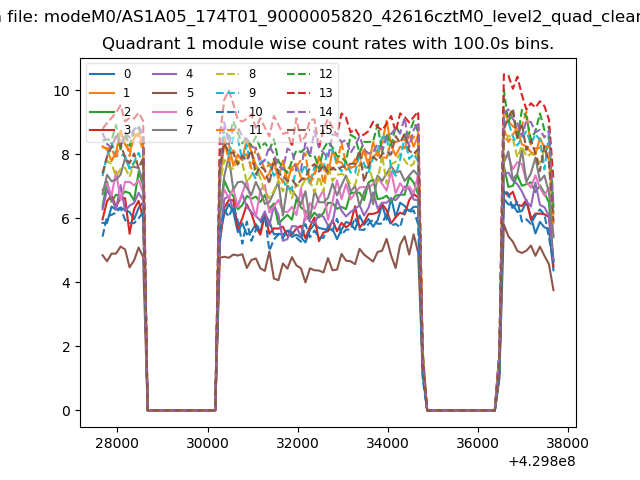
| Module-wise count rates for Quadrant A Data is divided into 100 sec bins |
 |
 |
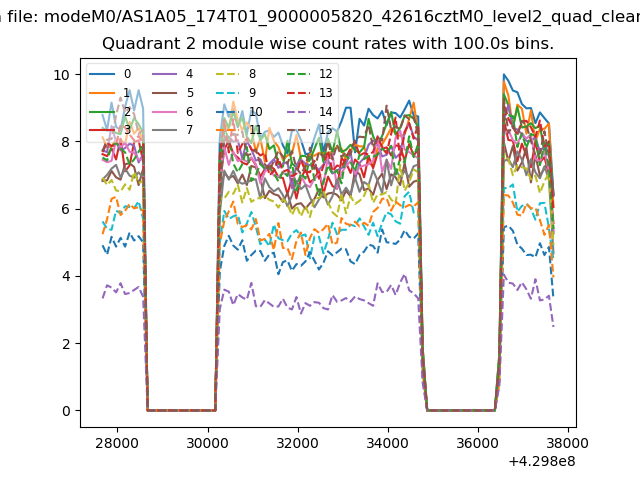
| Module-wise count rates for Quadrant B Data is divided into 100 sec bins |
 |
 |
| Module-wise count rates for Quadrant C Data is divided into 100 sec bins |
 |
 |
| Module-wise count rates for Quadrant D Data is divided into 100 sec bins |
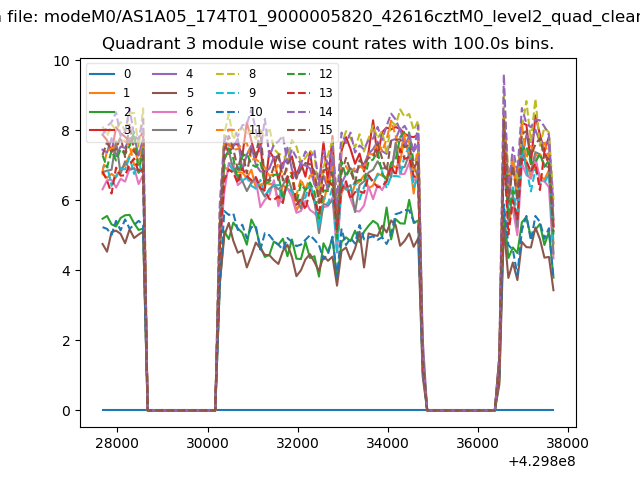 |
 |
| Parameter | Plot |
|---|---|
| CZT HV Monitor | 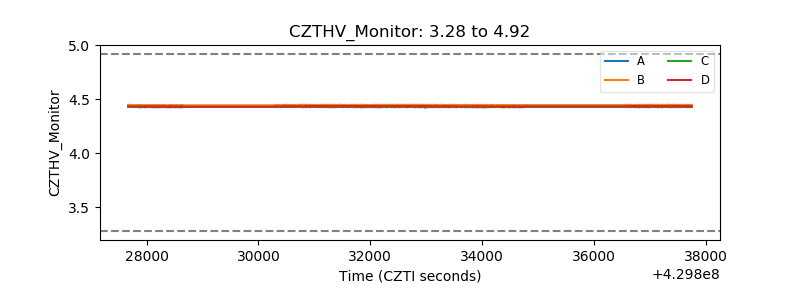 |
| D_VDD | 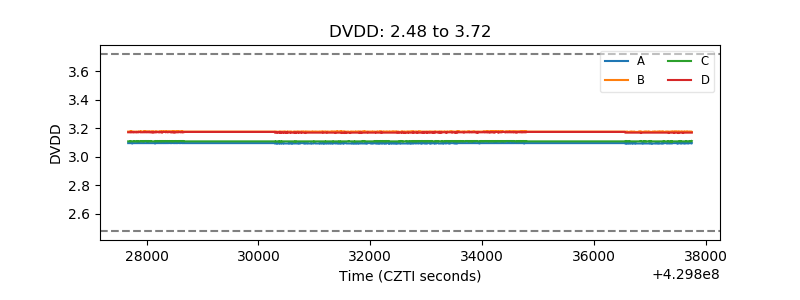 |
| Temperature 1 | 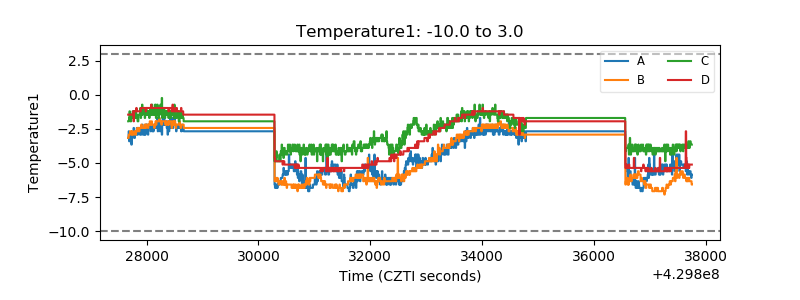 |
| Veto HV Monitor |  |
| Veto LLD | 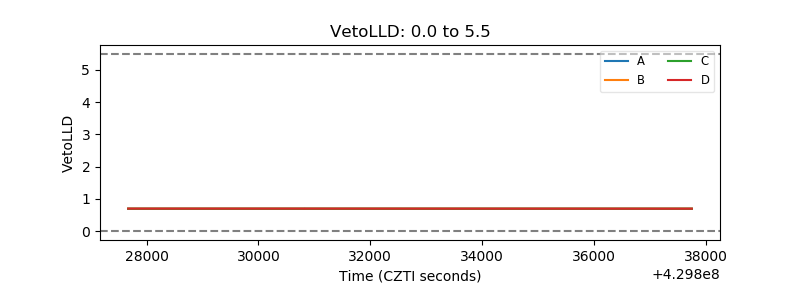 |
| Alpha Counter | 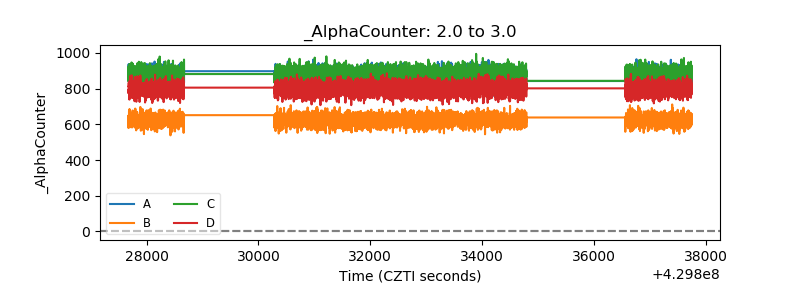 |
| _CPM_Rate |  |
| CZT Counter | 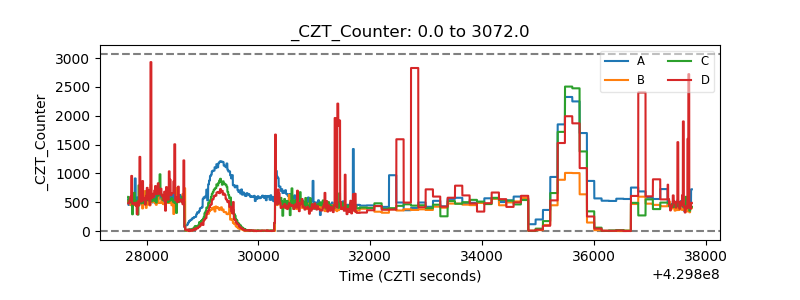 |
| +2.5 Volts monitor |  |
| +5 Volts monitor | 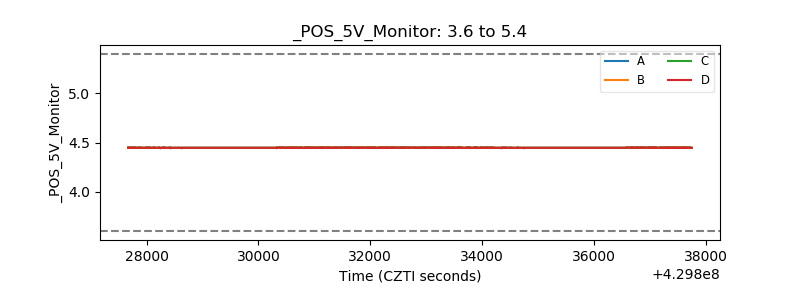 |
| _ROLL_ROT | 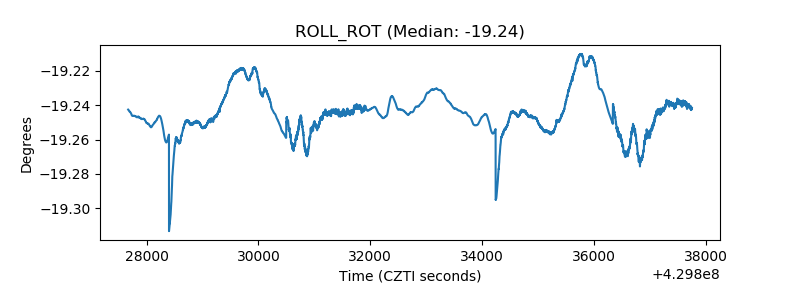 |
| _Roll_DEC | 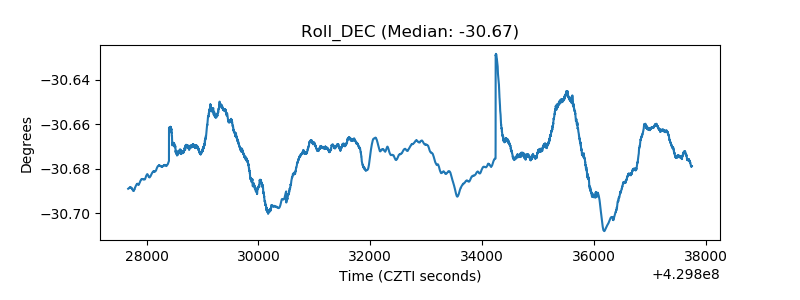 |
| _Roll_RA | 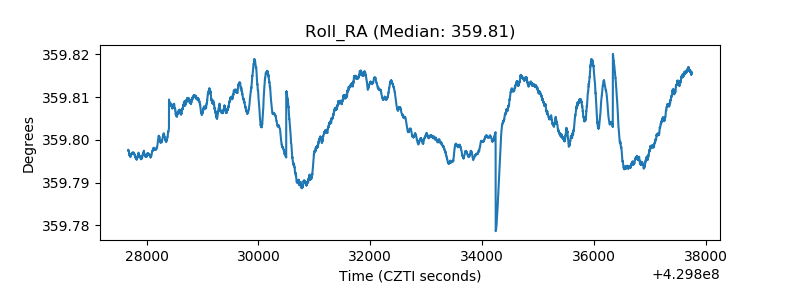 |
| Veto Counter | 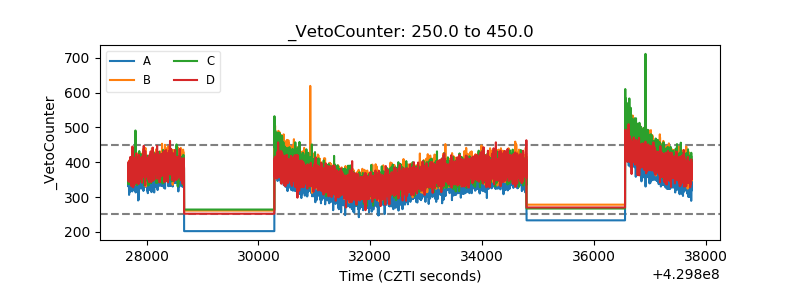 |