| Param | Original file | Final file |
|---|---|---|
| Filename | modeM0/AS1A05_174T01_9000005820_42617cztM0_level2.fits | modeM0/AS1A05_174T01_9000005820_42617cztM0_level2_quad_clean.evt |
| Size (bytes) | 357,526,080 | 94,075,200 |
| Size | 341.0 MB | 89.7 MB |
| Events in quadrant A | 3,028,961 | 638,054 |
| Events in quadrant B | 2,763,113 | 640,260 |
| Events in quadrant C | 2,705,446 | 633,130 |
| Events in quadrant D | 4,308,529 | 552,320 |
| Mode M9 | |||
|---|---|---|---|
| Quadrant | BADHDUFLAG | Total packets | Discarded packets |
| A | 0 | 31 | 0 |
| B | 0 | 32 | 0 |
| C | 0 | 32 | 0 |
| D | 0 | 32 | 0 |
| Mode SS | |||
|---|---|---|---|
| Quadrant | BADHDUFLAG | Total packets | Discarded packets |
| A | 0 | 112 | 0 |
| B | 0 | 112 | 0 |
| C | 0 | 112 | 0 |
| D | 0 | 112 | 0 |
| Mode M0 | |||
|---|---|---|---|
| Quadrant | BADHDUFLAG | Total packets | Discarded packets |
| A | 0 | 12212 | 2 |
| B | 0 | 11889 | 2 |
| C | 0 | 11252 | 2 |
| D | 0 | 16590 | 2 |
| Quadrant | Total seconds | Saturated seconds | Saturation percentage |
|---|---|---|---|
| A | 5500 | 13 | 0.236364% |
| B | 5500 | 156 | 2.836364% |
| C | 5500 | 10 | 0.181818% |
| D | 5500 | 383 | 6.963636% |
Noise dominated data is calculated using 1-second bins in cleaned event files. If a bin has >2000 counts, and if more than 50% of those come from <1% of pixels, then it is considered to be noise-dominated and hence unusable.
| Quadrant | # 1 sec bins | Bins with >0 counts | Bins with >2000 counts | High rate bins dominated by noise | Noise dominated (total time) | Noise dominated (detector-on time) | Marked lightcurve |
|---|---|---|---|---|---|---|---|
| A | 7383 | 5501 | 6 | 6 | 0.08% | 0.11% | 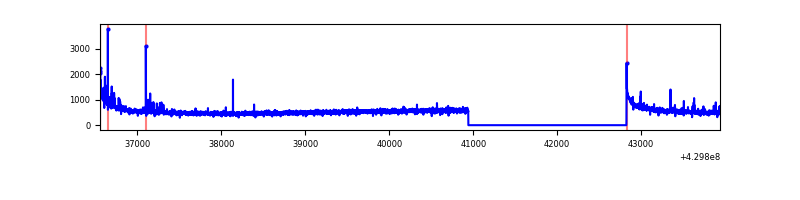 |
| B | 7383 | 5501 | 17 | 17 | 0.23% | 0.31% | 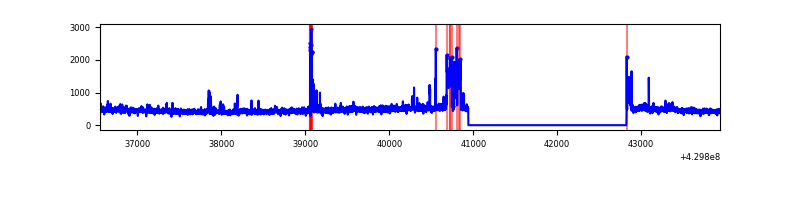 |
| C | 7383 | 5501 | 4 | 4 | 0.05% | 0.07% | 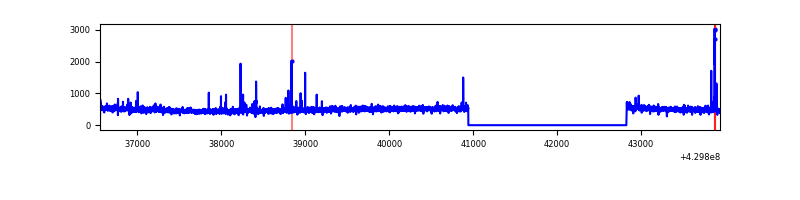 |
| D | 7383 | 5501 | 326 | 326 | 4.42% | 5.93% | 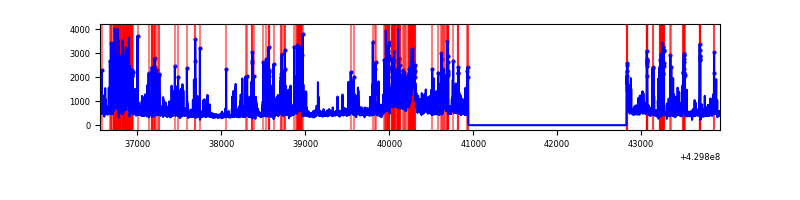 |
Top three noisy pixels from each quadrant. If the there are fewer than three noisy pixels in the level2.evt file, extra rows are filled as -1
| Pixel properties | Quadrant properties | ||||||
|---|---|---|---|---|---|---|---|
| Quadrant | DetID | PixID | Counts | Sigma | Mean | Median | Sigma |
| A | 10 | 83 | 565152 | 4407.68 | 619 | 604 | 128.1 |
| A | 7 | 3 | 56953 | 439.94 | 619 | 604 | 128.1 |
| A | 13 | 248 | 12473 | 92.67 | 619 | 604 | 128.1 |
| B | 0 | 168 | 264163 | 2232.11 | 610 | 594 | 118.1 |
| B | 0 | 245 | 84265 | 708.59 | 610 | 594 | 118.1 |
| B | 12 | 111 | 14567 | 118.33 | 610 | 594 | 118.1 |
| C | 15 | 214 | 228786 | 1572.63 | 617 | 622 | 145.1 |
| C | 3 | 233 | 25644 | 172.47 | 617 | 622 | 145.1 |
| C | 14 | 254 | 19966 | 133.33 | 617 | 622 | 145.1 |
| D | 1 | 52 | 691861 | 4712.53 | 598 | 582 | 146.7 |
| D | 1 | 47 | 369251 | 2513.26 | 598 | 582 | 146.7 |
| D | 12 | 6 | 349292 | 2377.2 | 598 | 582 | 146.7 |
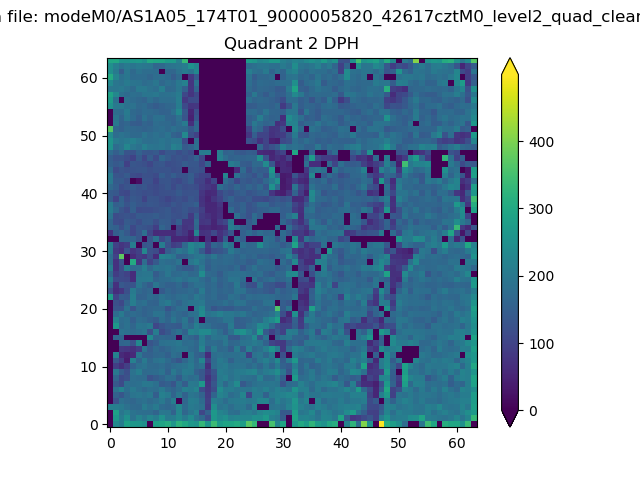
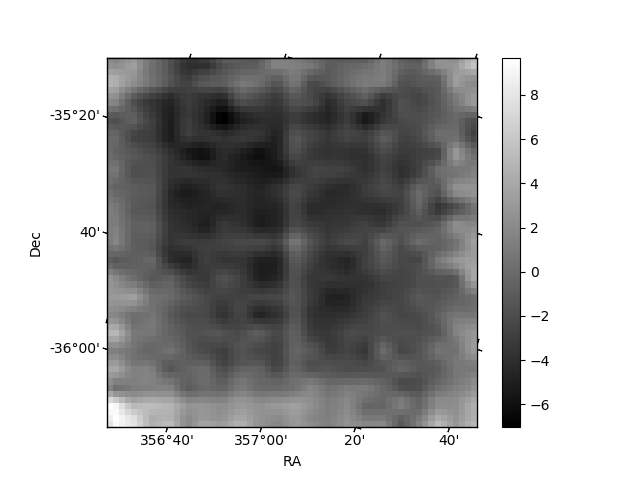
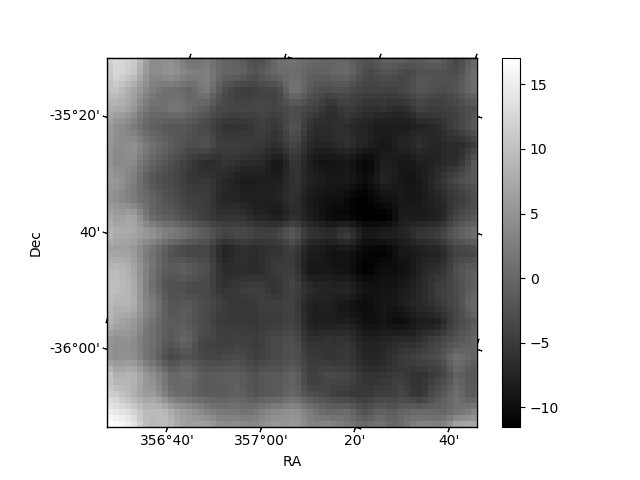
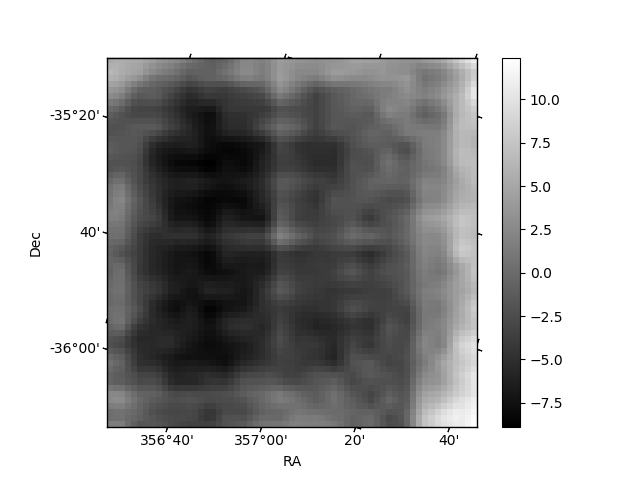
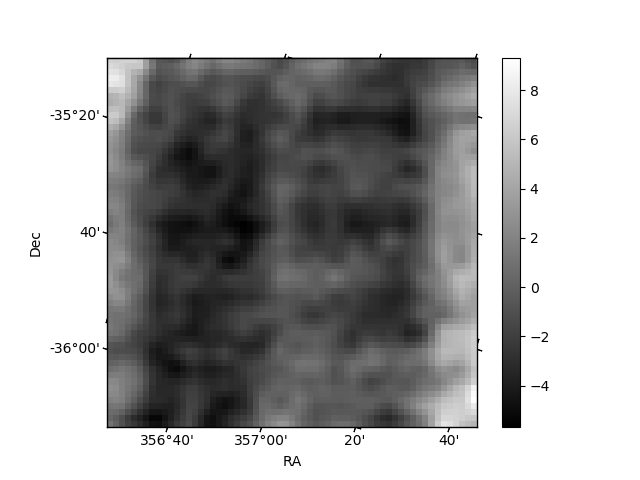
Histogram calculated using DETX and DETY for each event in the final _common_clean file
| Quadrant A | 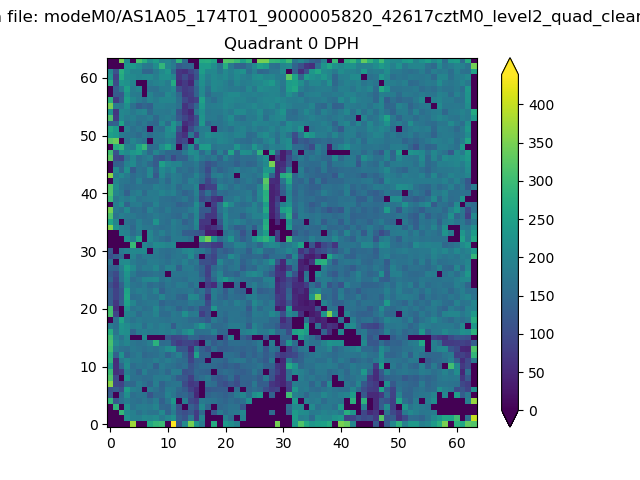 |
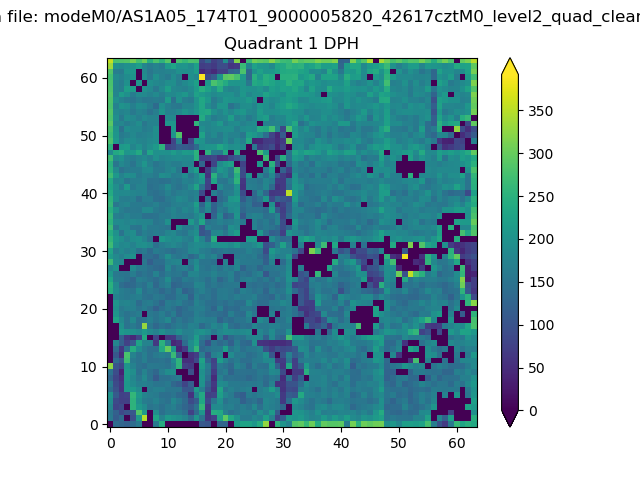 |
Quadrant B |
|---|---|---|---|
| Quadrant D | 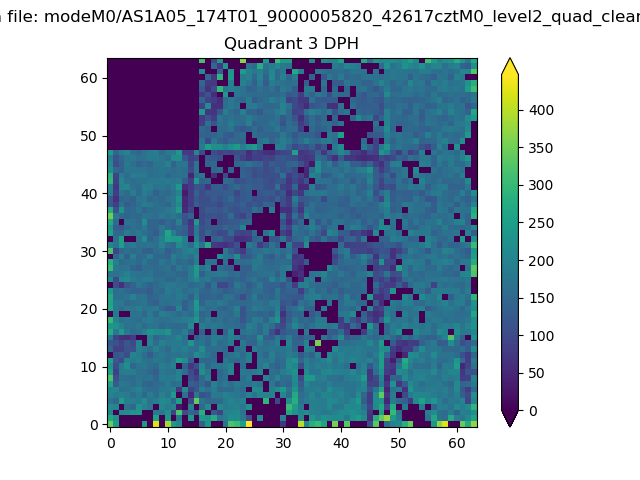 |
 |
Quadrant C |
| Plot type | Count rate plots | Images |
|---|---|---|
| Comparison with Poisson distribution Blue bars denote a histogram of data divided into 1 sec bins. Red curve is a Poisson curve with rate = median count rate of data. |
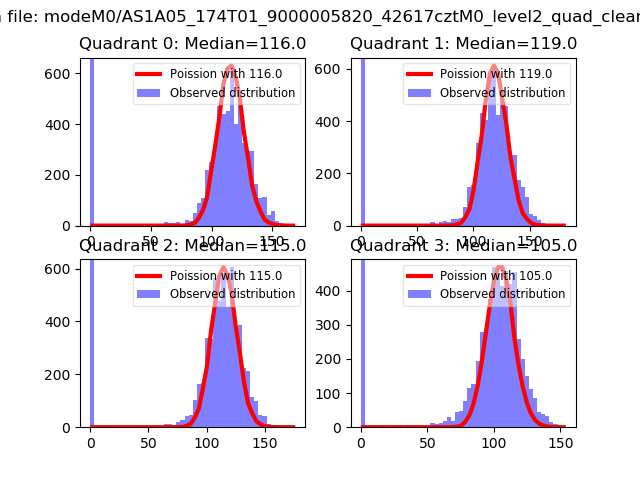 |
 |
| Quadrant-wise count rates Data is divided into 100 sec bins |
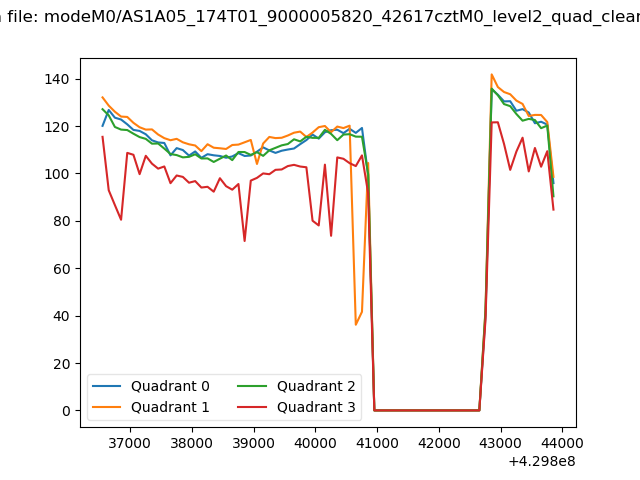 |
|
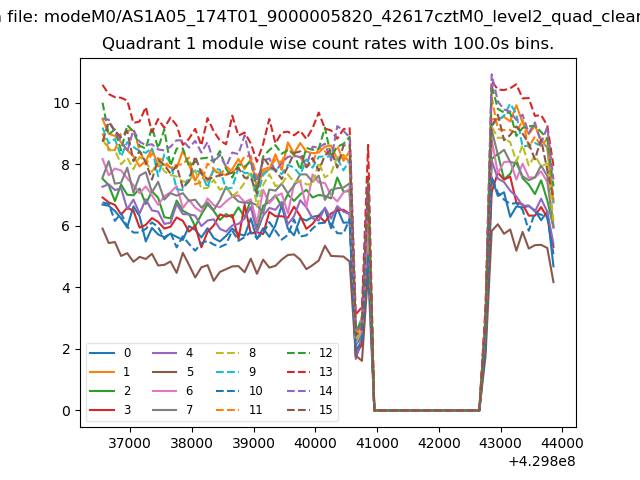
| Module-wise count rates for Quadrant A Data is divided into 100 sec bins |
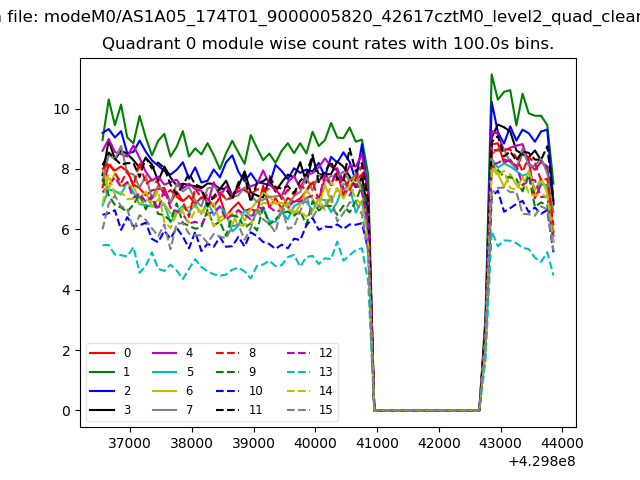 |
 |
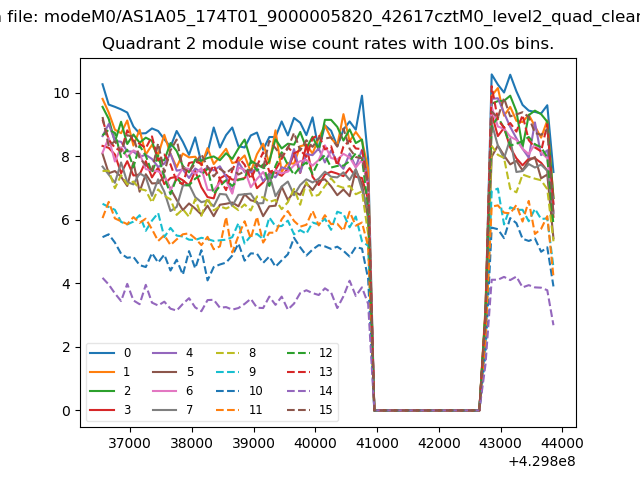
| Module-wise count rates for Quadrant B Data is divided into 100 sec bins |
 |
 |
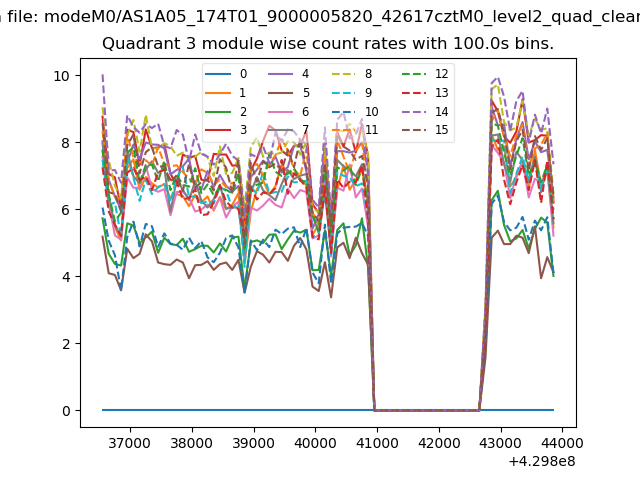
| Module-wise count rates for Quadrant C Data is divided into 100 sec bins |
 |
 |
| Module-wise count rates for Quadrant D Data is divided into 100 sec bins |
 |
 |
| Parameter | Plot |
|---|---|
| CZT HV Monitor | 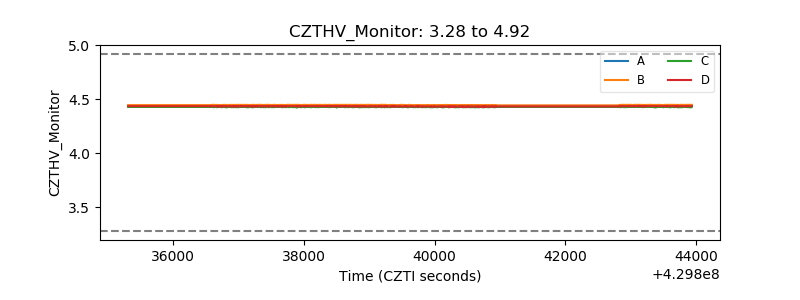 |
| D_VDD | 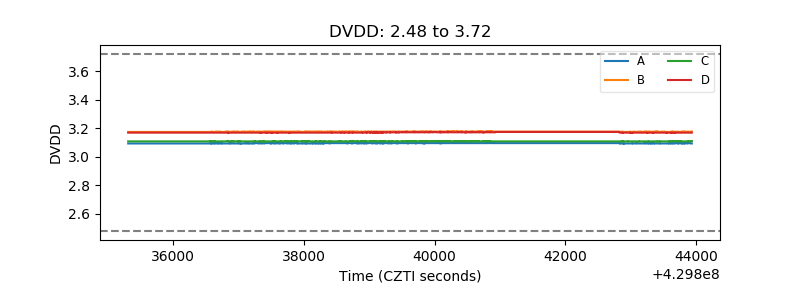 |
| Temperature 1 | 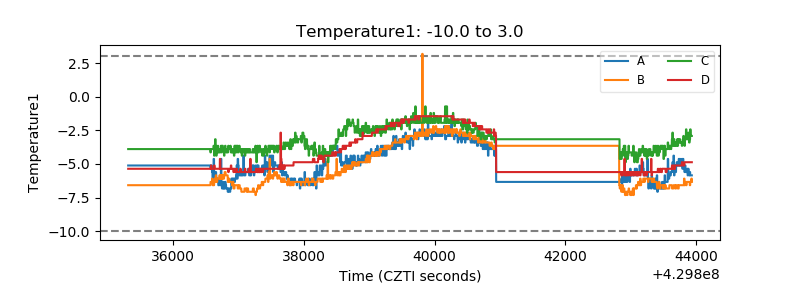 |
| Veto HV Monitor | 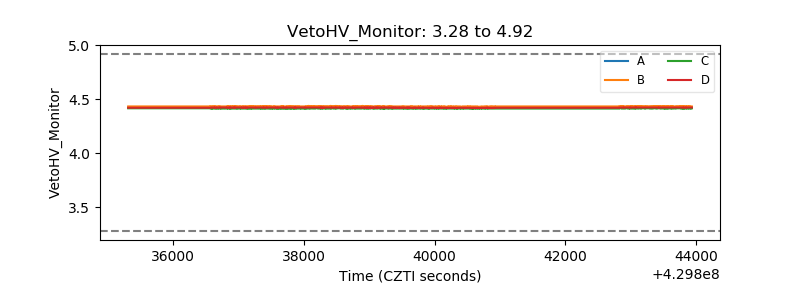 |
| Veto LLD | 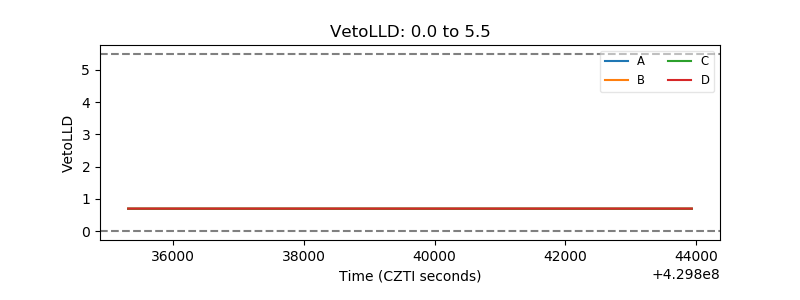 |
| Alpha Counter | 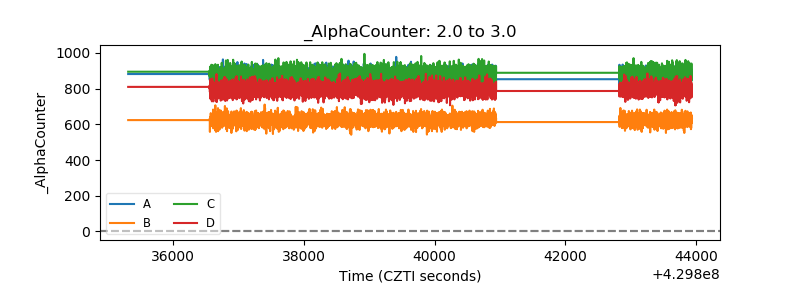 |
| _CPM_Rate | 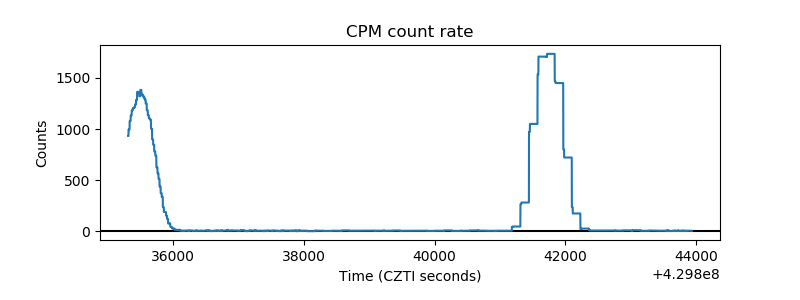 |
| CZT Counter | 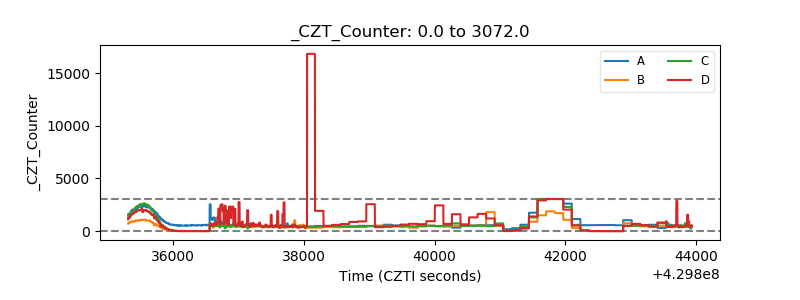 |
| +2.5 Volts monitor | 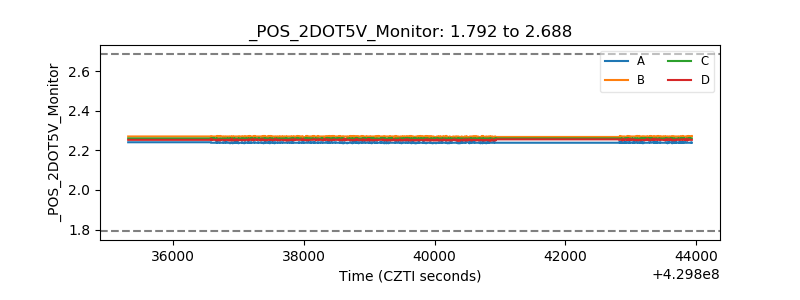 |
| +5 Volts monitor | 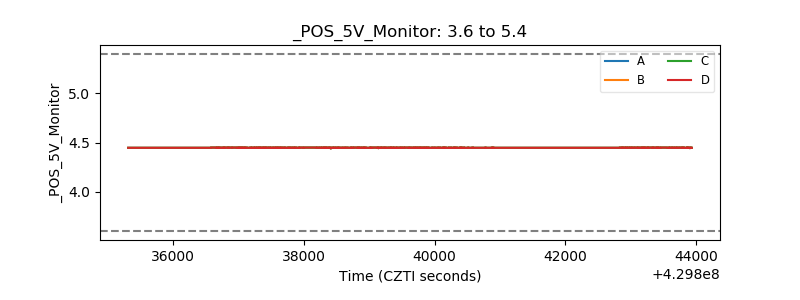 |
| _ROLL_ROT | 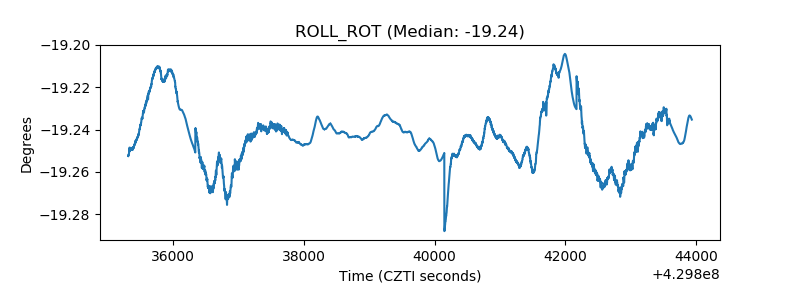 |
| _Roll_DEC | 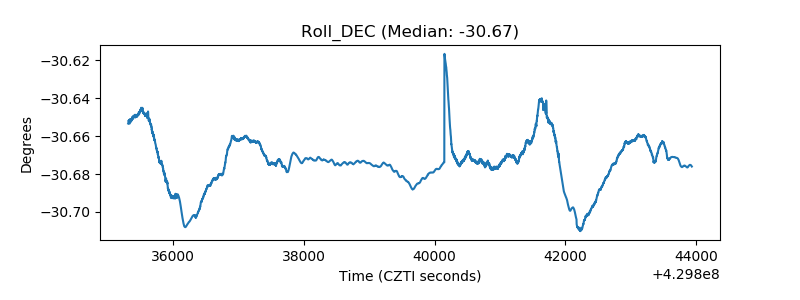 |
| _Roll_RA | 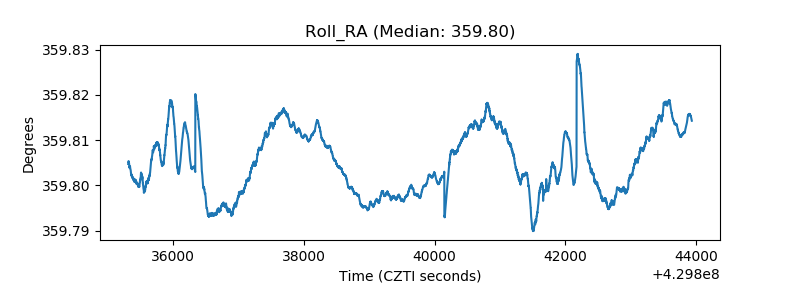 |
| Veto Counter | 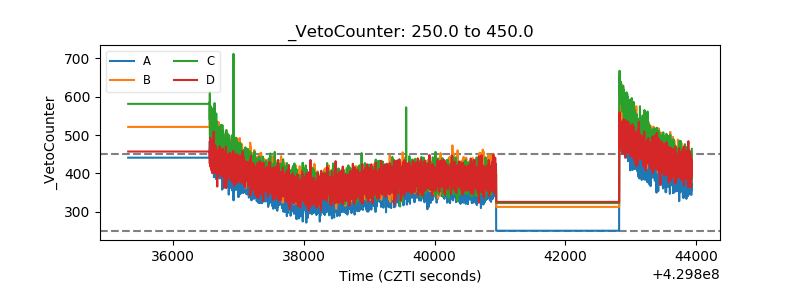 |