| Param | Original file | Final file |
|---|---|---|
| Filename | modeM0/AS1A05_174T01_9000005820_42618cztM0_level2.fits | modeM0/AS1A05_174T01_9000005820_42618cztM0_level2_quad_clean.evt |
| Size (bytes) | 337,464,000 | 90,210,240 |
| Size | 321.8 MB | 86.0 MB |
| Events in quadrant A | 2,926,354 | 610,600 |
| Events in quadrant B | 2,429,974 | 628,854 |
| Events in quadrant C | 2,547,128 | 607,910 |
| Events in quadrant D | 4,194,957 | 530,635 |
| Mode M9 | |||
|---|---|---|---|
| Quadrant | BADHDUFLAG | Total packets | Discarded packets |
| A | 0 | 29 | 0 |
| B | 0 | 30 | 0 |
| C | 0 | 30 | 0 |
| D | 0 | 30 | 0 |
| Mode SS | |||
|---|---|---|---|
| Quadrant | BADHDUFLAG | Total packets | Discarded packets |
| A | 0 | 102 | 0 |
| B | 0 | 102 | 0 |
| C | 0 | 102 | 0 |
| D | 0 | 102 | 0 |
| Mode M0 | |||
|---|---|---|---|
| Quadrant | BADHDUFLAG | Total packets | Discarded packets |
| A | 0 | 11644 | 2 |
| B | 0 | 10466 | 3 |
| C | 0 | 10370 | 2 |
| D | 0 | 15811 | 2 |
| Quadrant | Total seconds | Saturated seconds | Saturation percentage |
|---|---|---|---|
| A | 5051 | 18 | 0.356365% |
| B | 5050 | 22 | 0.435644% |
| C | 5050 | 7 | 0.138614% |
| D | 5050 | 357 | 7.069307% |
Noise dominated data is calculated using 1-second bins in cleaned event files. If a bin has >2000 counts, and if more than 50% of those come from <1% of pixels, then it is considered to be noise-dominated and hence unusable.
| Quadrant | # 1 sec bins | Bins with >0 counts | Bins with >2000 counts | High rate bins dominated by noise | Noise dominated (total time) | Noise dominated (detector-on time) | Marked lightcurve |
|---|---|---|---|---|---|---|---|
| A | 7023 | 5052 | 8 | 8 | 0.11% | 0.16% | 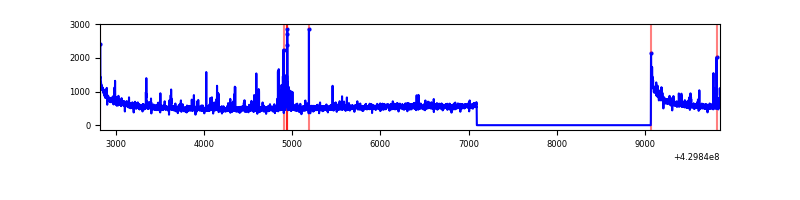 |
| B | 7022 | 5051 | 12 | 12 | 0.17% | 0.24% | 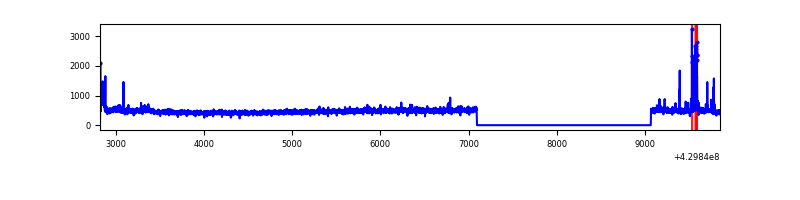 |
| C | 7022 | 5051 | 4 | 4 | 0.06% | 0.08% | 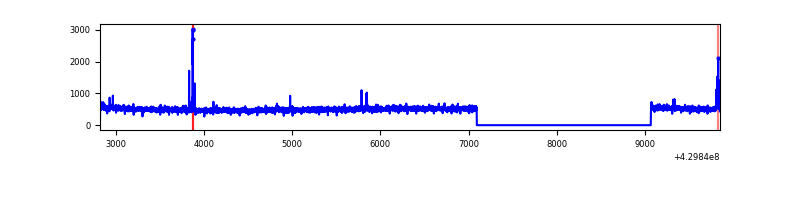 |
| D | 7022 | 5051 | 349 | 349 | 4.97% | 6.91% | 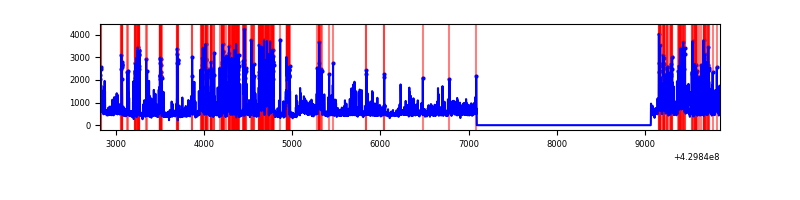 |
Top three noisy pixels from each quadrant. If the there are fewer than three noisy pixels in the level2.evt file, extra rows are filled as -1
| Pixel properties | Quadrant properties | ||||||
|---|---|---|---|---|---|---|---|
| Quadrant | DetID | PixID | Counts | Sigma | Mean | Median | Sigma |
| A | 10 | 83 | 516995 | 4266.98 | 589 | 576 | 121.0 |
| A | 7 | 3 | 92047 | 755.79 | 589 | 576 | 121.0 |
| A | 13 | 248 | 22483 | 181.01 | 589 | 576 | 121.0 |
| B | 0 | 245 | 88854 | 785.18 | 583 | 567 | 112.4 |
| B | 0 | 168 | 37010 | 324.11 | 583 | 567 | 112.4 |
| B | 12 | 111 | 13814 | 117.81 | 583 | 567 | 112.4 |
| C | 15 | 214 | 210466 | 1543.85 | 584 | 589 | 135.9 |
| C | 15 | 111 | 20148 | 143.88 | 584 | 589 | 135.9 |
| C | 14 | 254 | 17516 | 124.51 | 584 | 589 | 135.9 |
| D | 1 | 52 | 841999 | 6079.47 | 568 | 552 | 138.4 |
| D | 13 | 249 | 432844 | 3123.32 | 568 | 552 | 138.4 |
| D | 12 | 6 | 324990 | 2344.07 | 568 | 552 | 138.4 |
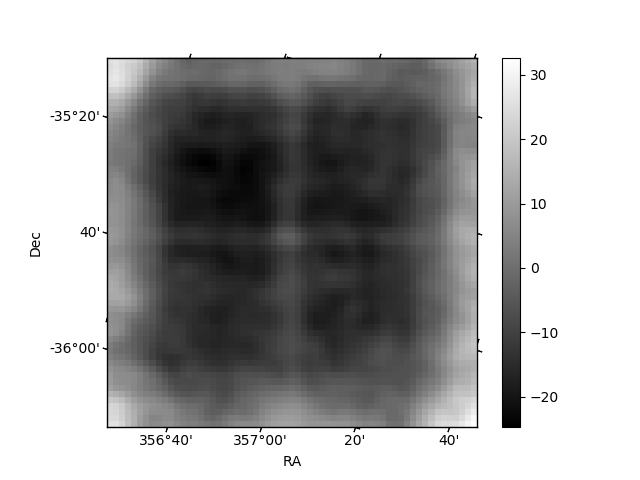
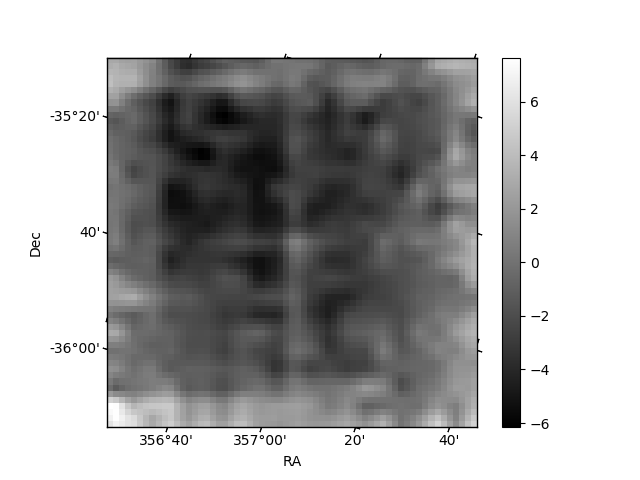
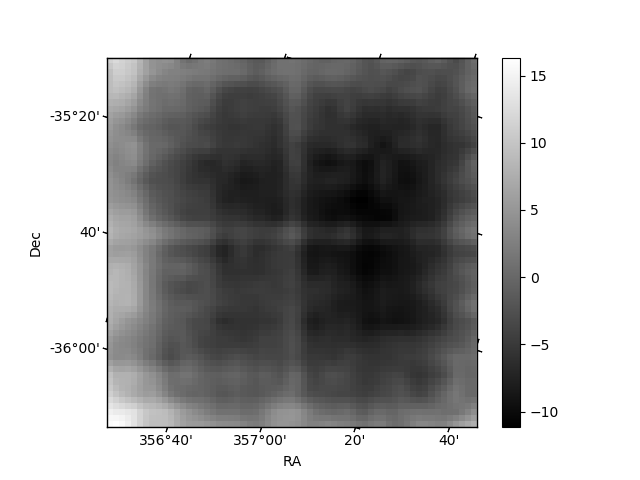
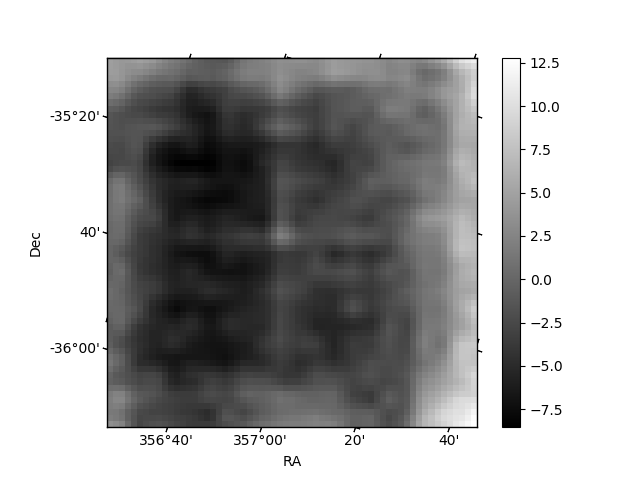
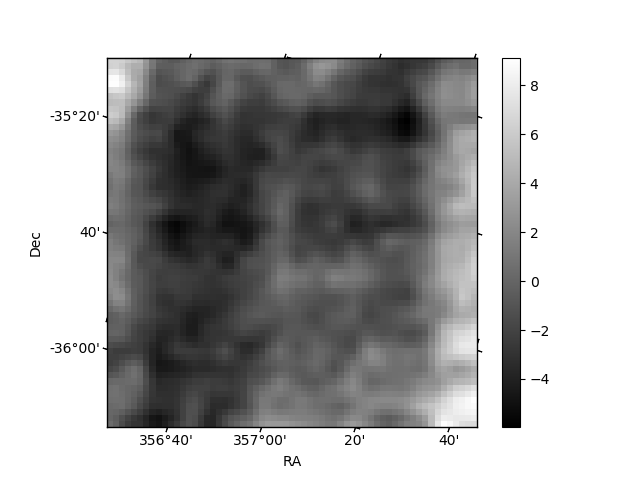
Histogram calculated using DETX and DETY for each event in the final _common_clean file
| Quadrant A | 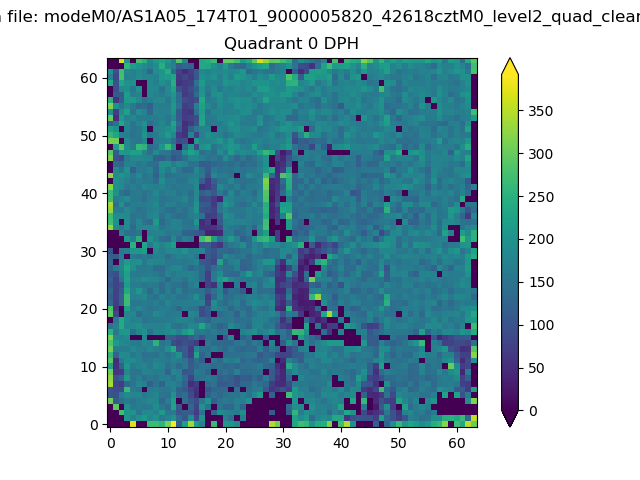 |
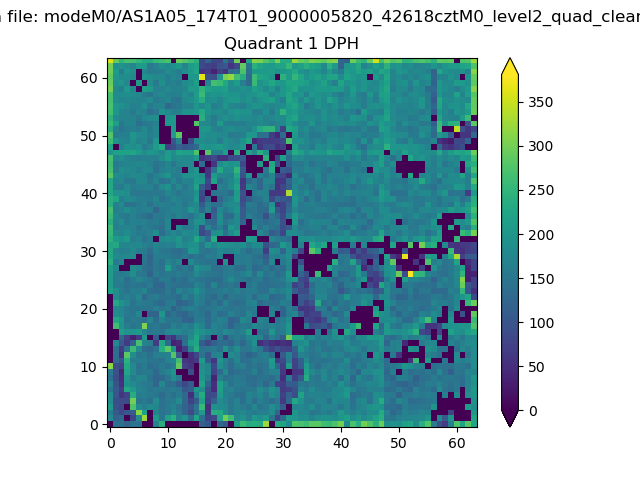 |
Quadrant B |
|---|---|---|---|
| Quadrant D | 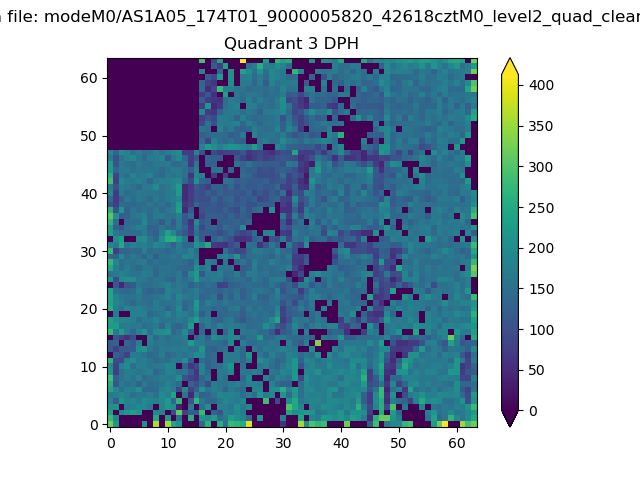 |
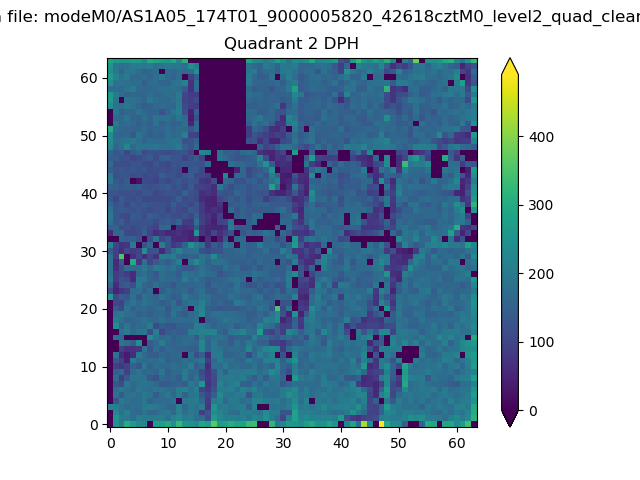 |
Quadrant C |
| Plot type | Count rate plots | Images |
|---|---|---|
| Comparison with Poisson distribution Blue bars denote a histogram of data divided into 1 sec bins. Red curve is a Poisson curve with rate = median count rate of data. |
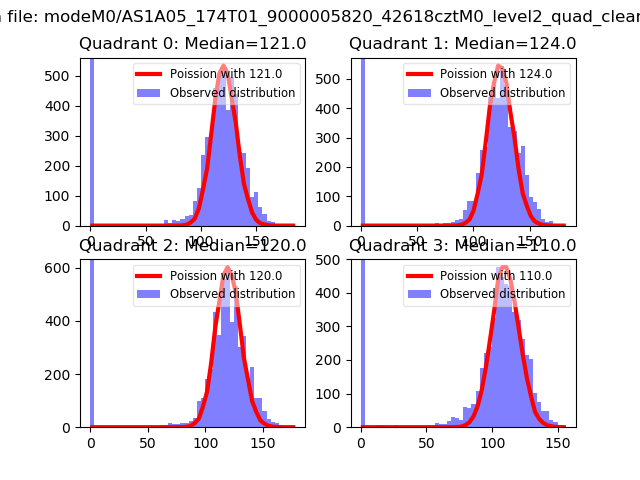 |
 |
| Quadrant-wise count rates Data is divided into 100 sec bins |
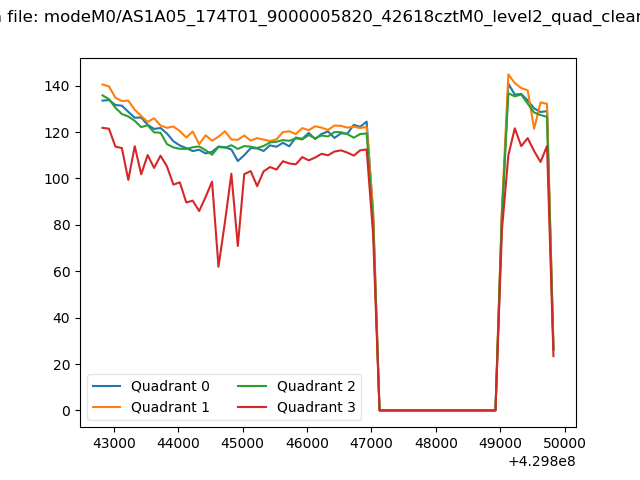 |
|
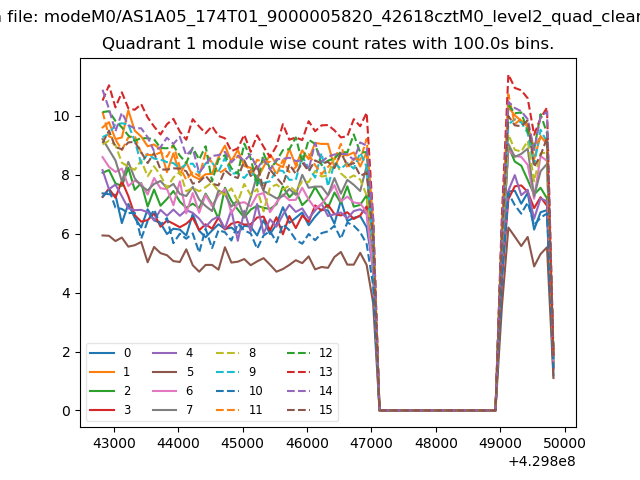
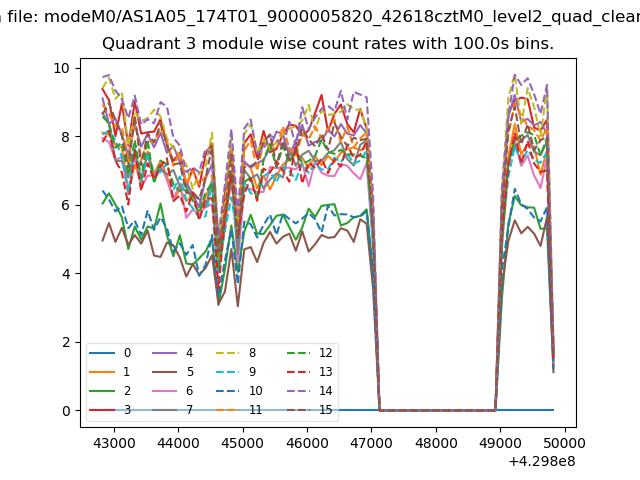
| Module-wise count rates for Quadrant A Data is divided into 100 sec bins |
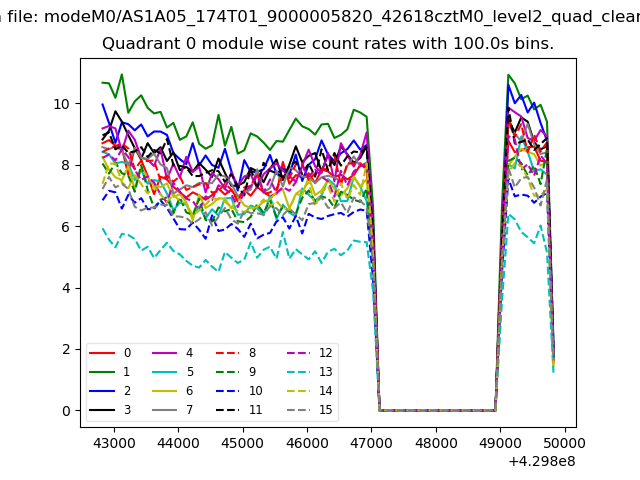 |
 |
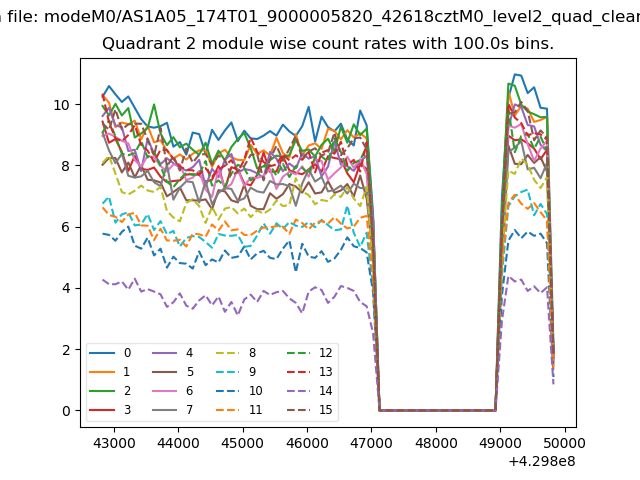
| Module-wise count rates for Quadrant B Data is divided into 100 sec bins |
 |
 |
| Module-wise count rates for Quadrant C Data is divided into 100 sec bins |
 |
 |
| Module-wise count rates for Quadrant D Data is divided into 100 sec bins |
 |
 |
| Parameter | Plot |
|---|---|
| CZT HV Monitor | 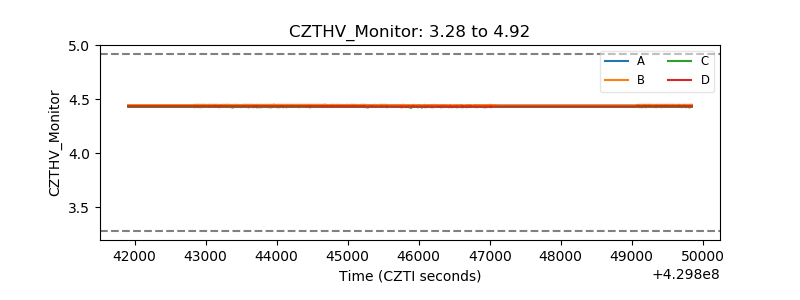 |
| D_VDD | 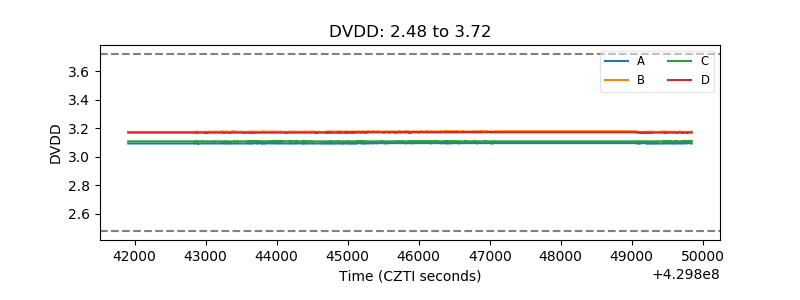 |
| Temperature 1 | 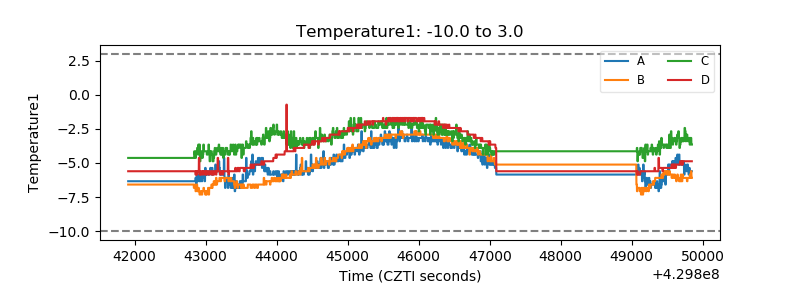 |
| Veto HV Monitor | 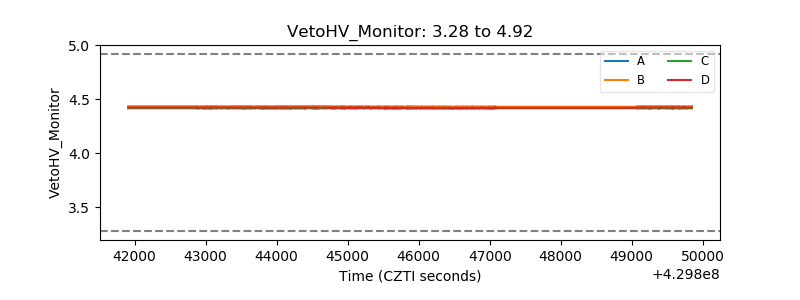 |
| Veto LLD | 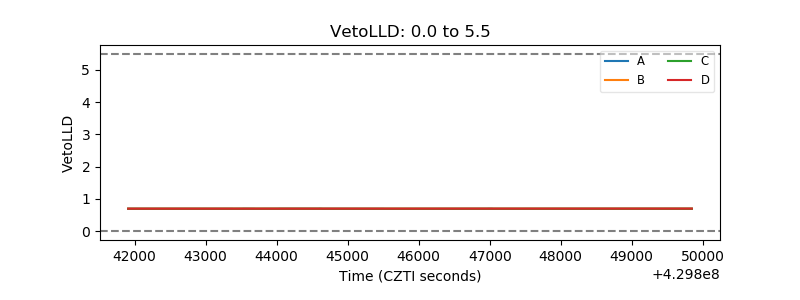 |
| Alpha Counter | 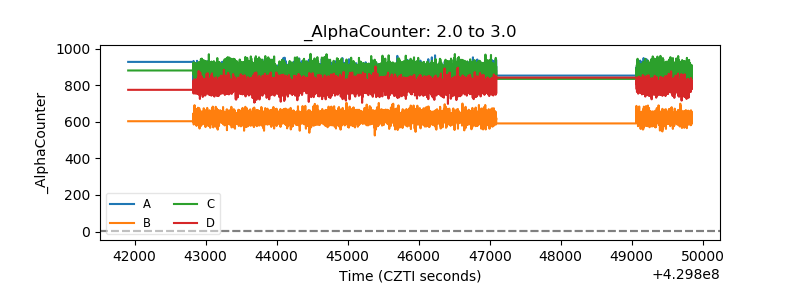 |
| _CPM_Rate | 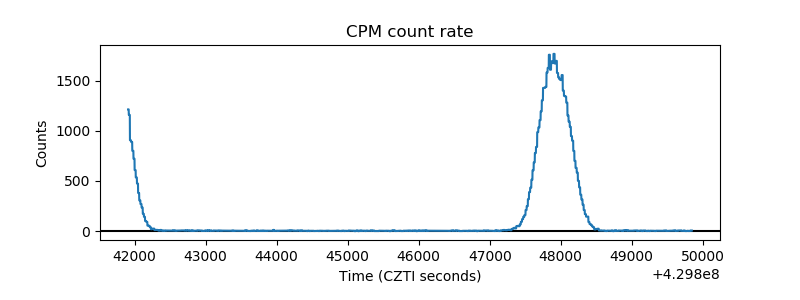 |
| CZT Counter | 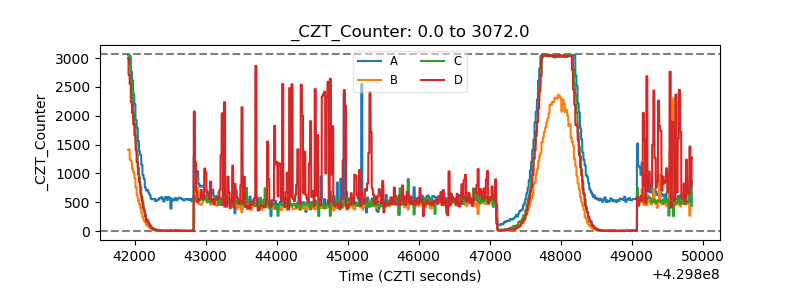 |
| +2.5 Volts monitor | 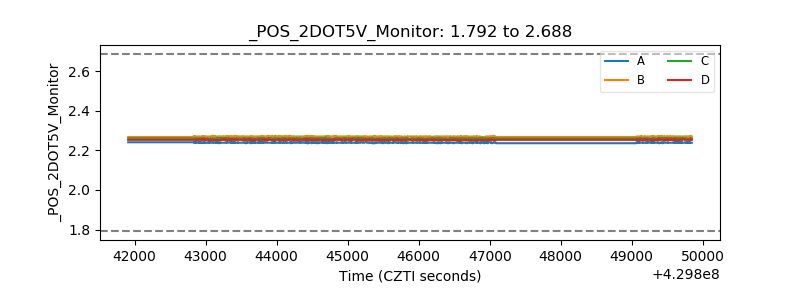 |
| +5 Volts monitor | 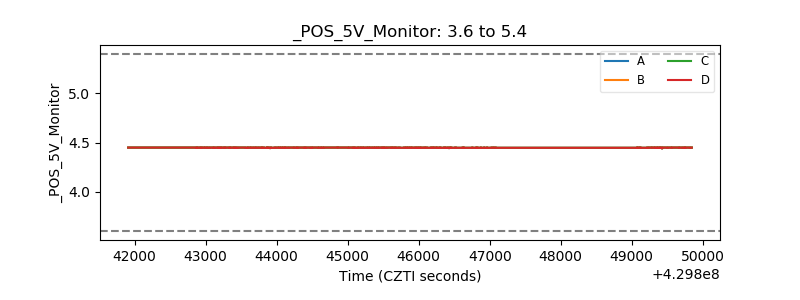 |
| _ROLL_ROT | 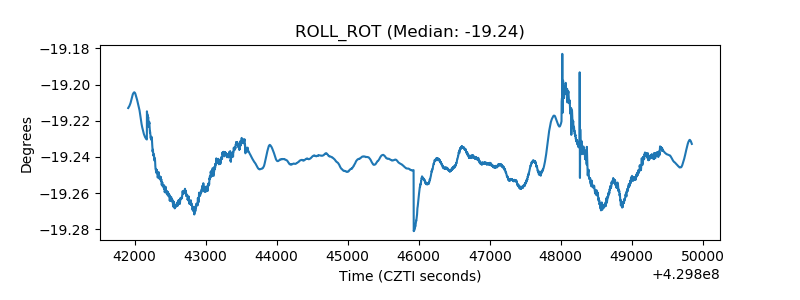 |
| _Roll_DEC | 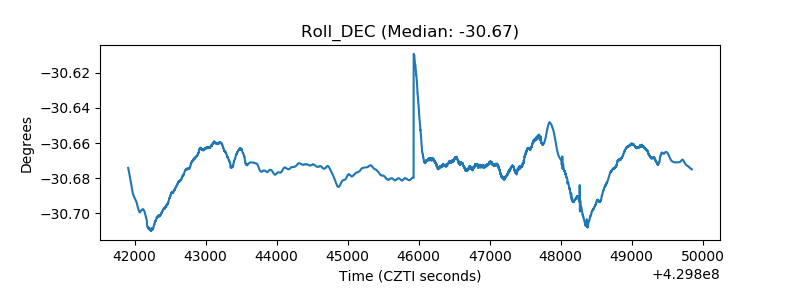 |
| _Roll_RA | 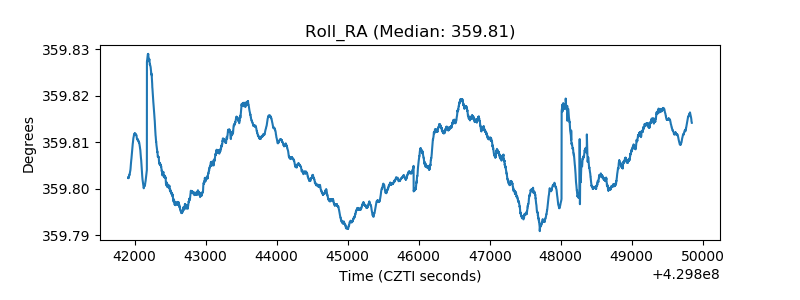 |
| Veto Counter | 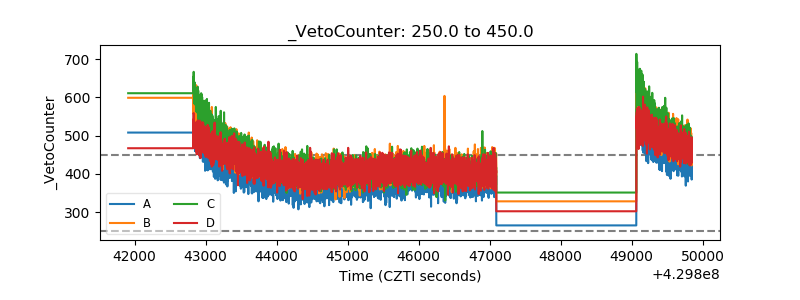 |