| Param | Original file | Final file |
|---|---|---|
| Filename | modeM0/AS1A05_174T01_9000005820_42619cztM0_level2.fits | modeM0/AS1A05_174T01_9000005820_42619cztM0_level2_quad_clean.evt |
| Size (bytes) | 345,441,600 | 88,151,040 |
| Size | 329.4 MB | 84.1 MB |
| Events in quadrant A | 2,909,259 | 606,833 |
| Events in quadrant B | 2,517,703 | 623,687 |
| Events in quadrant C | 2,496,030 | 606,479 |
| Events in quadrant D | 4,479,775 | 486,678 |
| Mode M9 | |||
|---|---|---|---|
| Quadrant | BADHDUFLAG | Total packets | Discarded packets |
| A | 0 | 39 | 0 |
| B | 0 | 40 | 0 |
| C | 0 | 40 | 0 |
| D | 0 | 40 | 0 |
| Mode SS | |||
|---|---|---|---|
| Quadrant | BADHDUFLAG | Total packets | Discarded packets |
| A | 0 | 100 | 0 |
| B | 0 | 100 | 0 |
| C | 0 | 100 | 0 |
| D | 0 | 100 | 0 |
| Mode M0 | |||
|---|---|---|---|
| Quadrant | BADHDUFLAG | Total packets | Discarded packets |
| A | 0 | 11583 | 2 |
| B | 0 | 10552 | 2 |
| C | 0 | 10050 | 2 |
| D | 0 | 16597 | 2 |
| Quadrant | Total seconds | Saturated seconds | Saturation percentage |
|---|---|---|---|
| A | 4932 | 22 | 0.446067% |
| B | 4932 | 41 | 0.831306% |
| C | 4932 | 4 | 0.081103% |
| D | 4932 | 696 | 14.111922% |
Noise dominated data is calculated using 1-second bins in cleaned event files. If a bin has >2000 counts, and if more than 50% of those come from <1% of pixels, then it is considered to be noise-dominated and hence unusable.
| Quadrant | # 1 sec bins | Bins with >0 counts | Bins with >2000 counts | High rate bins dominated by noise | Noise dominated (total time) | Noise dominated (detector-on time) | Marked lightcurve |
|---|---|---|---|---|---|---|---|
| A | 7024 | 4933 | 13 | 13 | 0.19% | 0.26% | 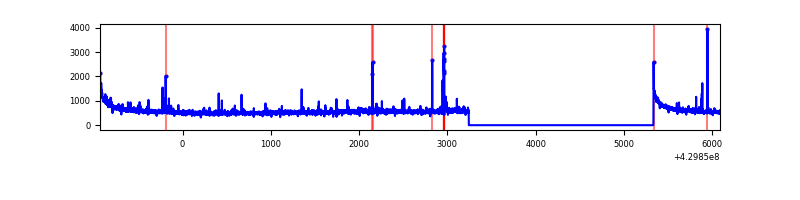 |
| B | 7024 | 4933 | 25 | 25 | 0.36% | 0.51% | 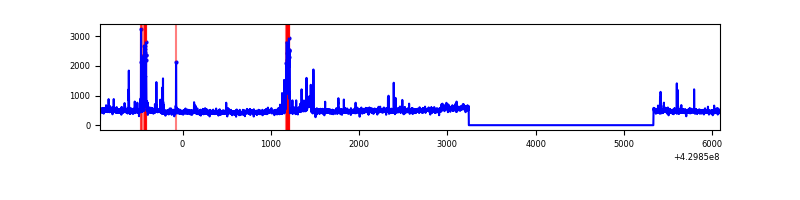 |
| C | 7024 | 4933 | 1 | 1 | 0.01% | 0.02% | 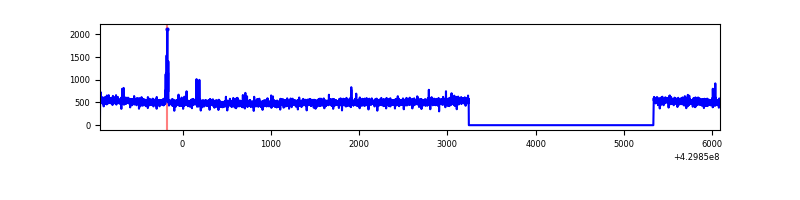 |
| D | 7024 | 4933 | 630 | 630 | 8.97% | 12.77% | 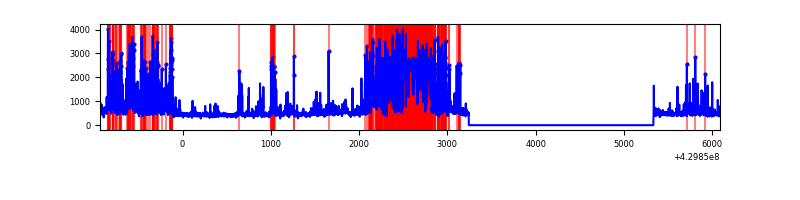 |
Top three noisy pixels from each quadrant. If the there are fewer than three noisy pixels in the level2.evt file, extra rows are filled as -1
| Pixel properties | Quadrant properties | ||||||
|---|---|---|---|---|---|---|---|
| Quadrant | DetID | PixID | Counts | Sigma | Mean | Median | Sigma |
| A | 10 | 83 | 519858 | 4370.39 | 585 | 574 | 118.8 |
| A | 2 | 79 | 49811 | 414.39 | 585 | 574 | 118.8 |
| A | 7 | 3 | 41400 | 343.6 | 585 | 574 | 118.8 |
| B | 0 | 245 | 168684 | 1503.3 | 577 | 562 | 111.8 |
| B | 12 | 0 | 38799 | 341.9 | 577 | 562 | 111.8 |
| B | 5 | 255 | 15869 | 136.87 | 577 | 562 | 111.8 |
| C | 15 | 214 | 207896 | 1539.77 | 580 | 584 | 134.6 |
| C | 14 | 254 | 23051 | 166.87 | 580 | 584 | 134.6 |
| C | 3 | 233 | 5061 | 33.25 | 580 | 584 | 134.6 |
| D | 2 | 249 | 1539388 | 11520.29 | 541 | 525 | 133.6 |
| D | 12 | 6 | 332062 | 2481.96 | 541 | 525 | 133.6 |
| D | 1 | 52 | 271766 | 2030.57 | 541 | 525 | 133.6 |
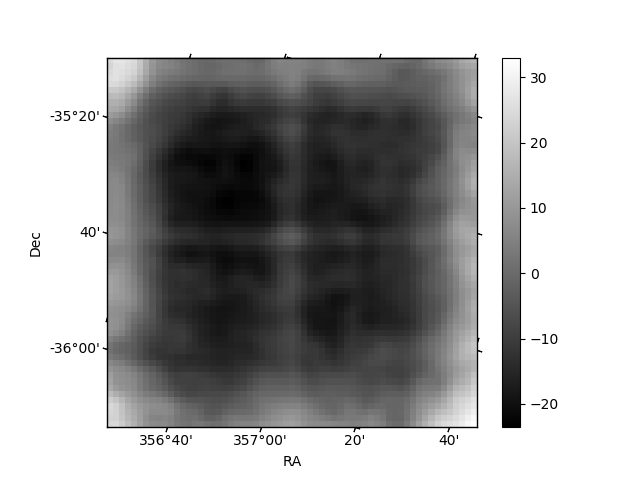
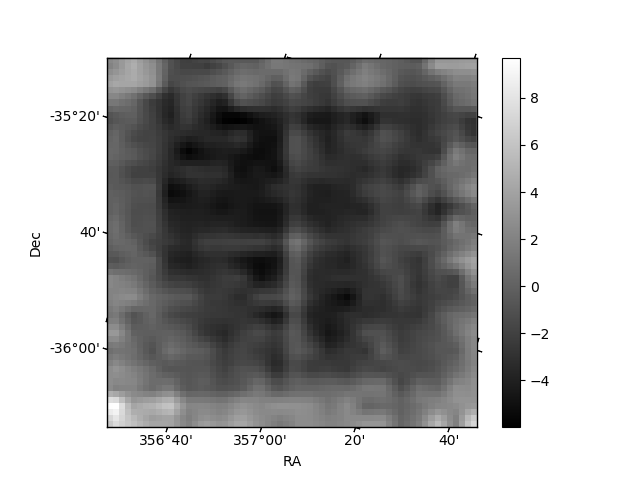
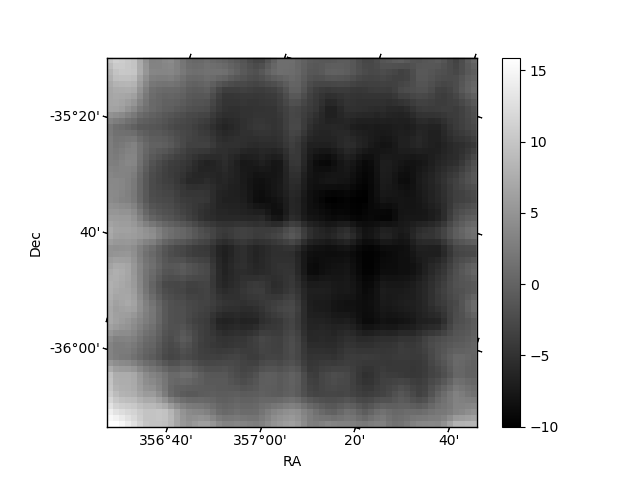
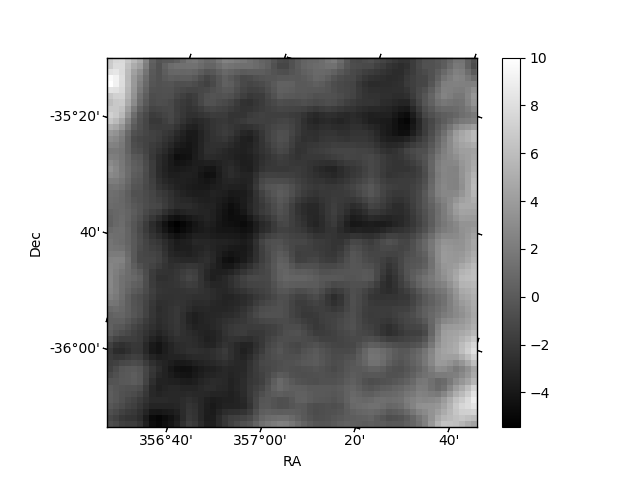
Histogram calculated using DETX and DETY for each event in the final _common_clean file
| Quadrant A | 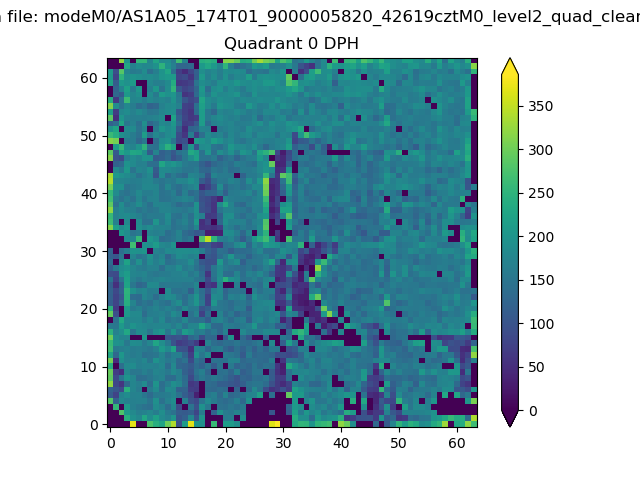 |
 |
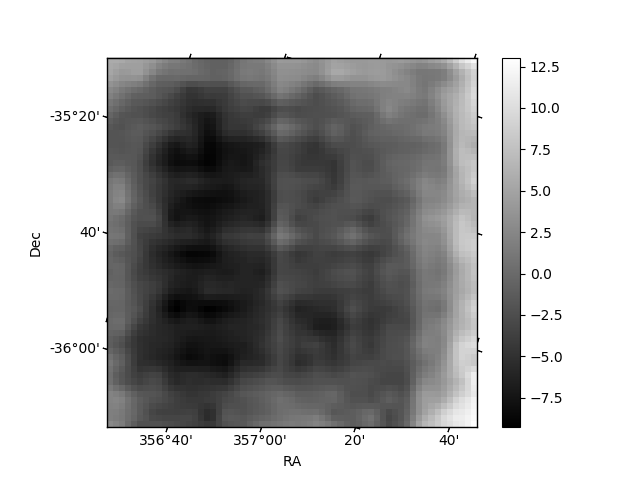
Quadrant B |
|---|---|---|---|
| Quadrant D | 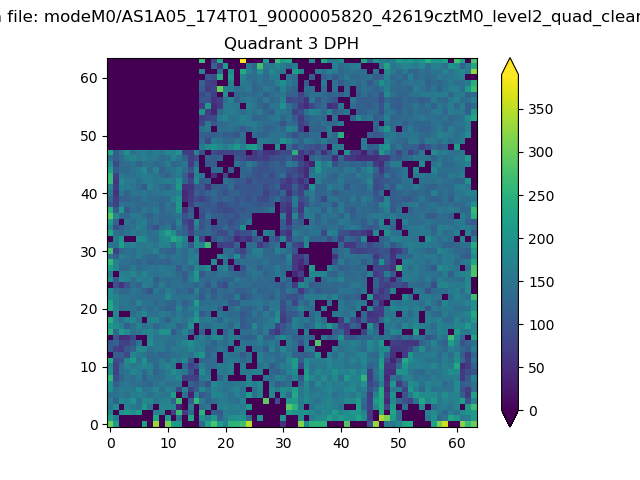 |
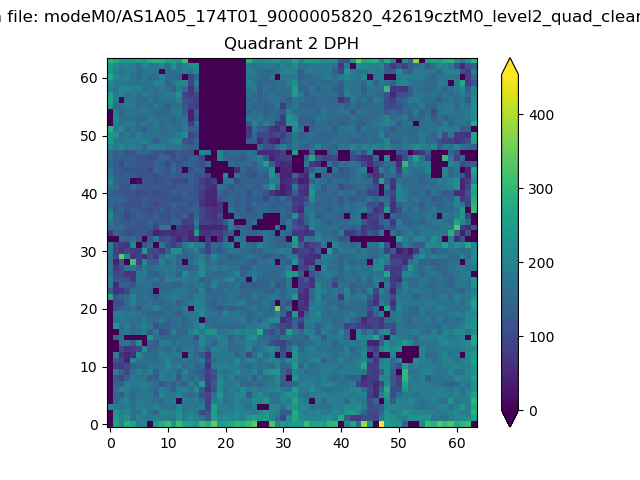 |
Quadrant C |
| Plot type | Count rate plots | Images |
|---|---|---|
| Comparison with Poisson distribution Blue bars denote a histogram of data divided into 1 sec bins. Red curve is a Poisson curve with rate = median count rate of data. |
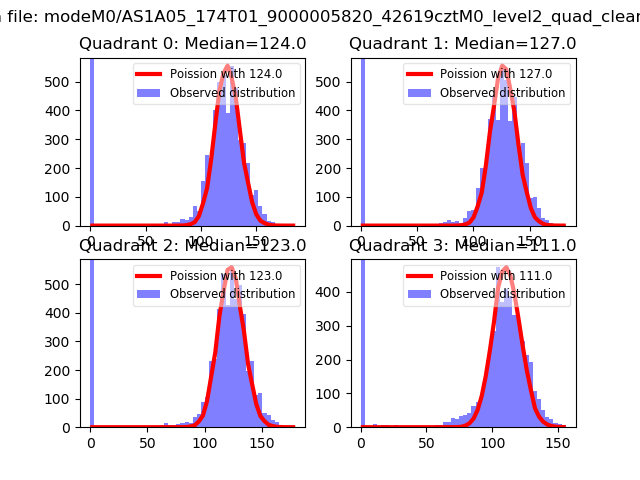 |
 |
| Quadrant-wise count rates Data is divided into 100 sec bins |
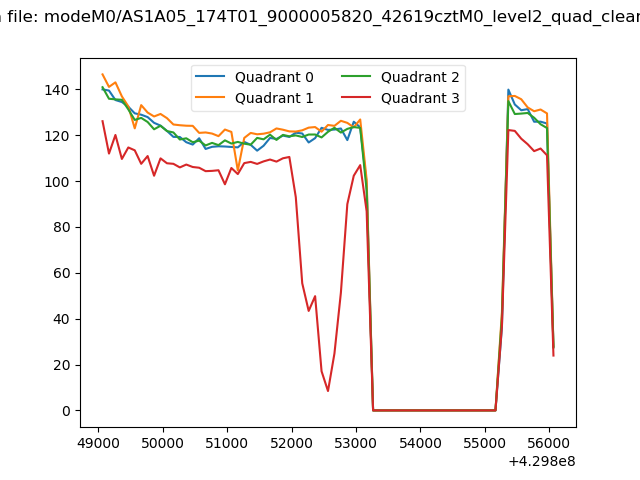 |
|
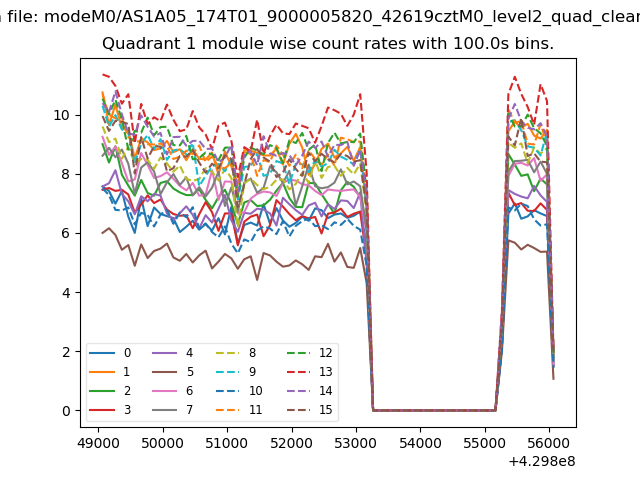
| Module-wise count rates for Quadrant A Data is divided into 100 sec bins |
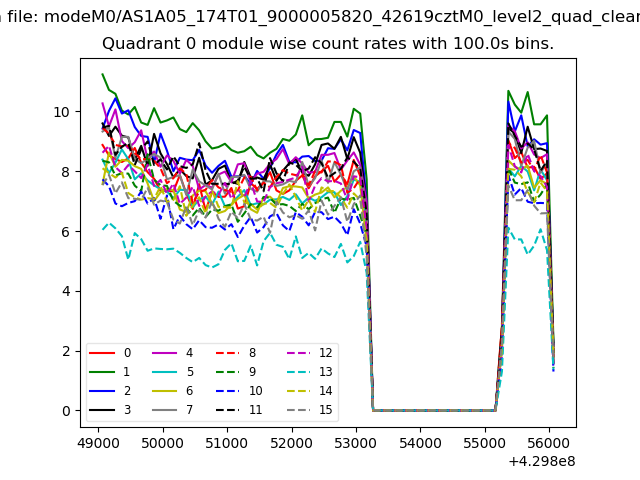 |
 |
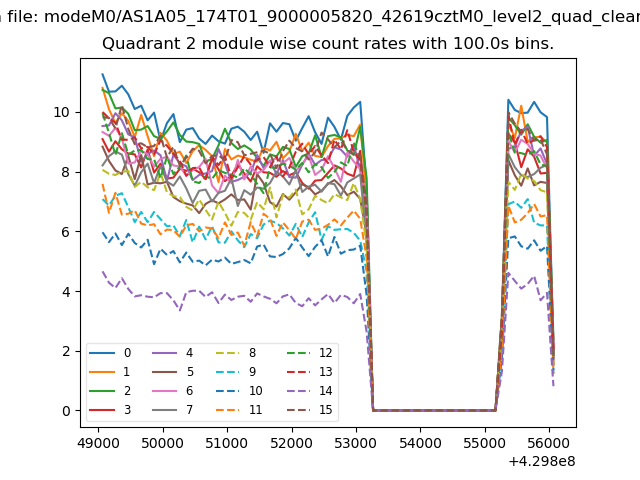
| Module-wise count rates for Quadrant B Data is divided into 100 sec bins |
 |
 |
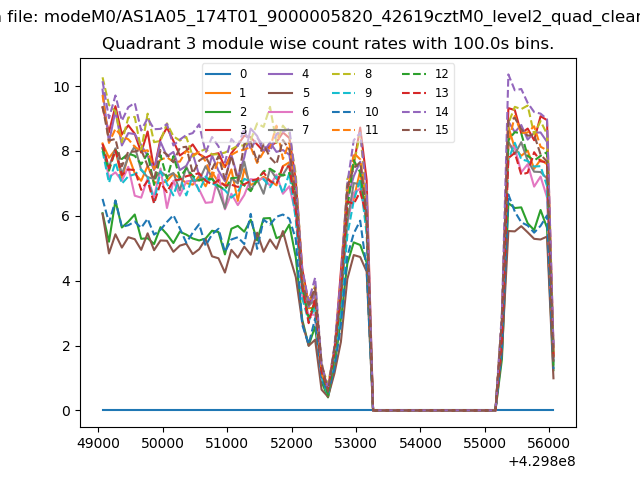
| Module-wise count rates for Quadrant C Data is divided into 100 sec bins |
 |
 |
| Module-wise count rates for Quadrant D Data is divided into 100 sec bins |
 |
 |
| Parameter | Plot |
|---|---|
| CZT HV Monitor | 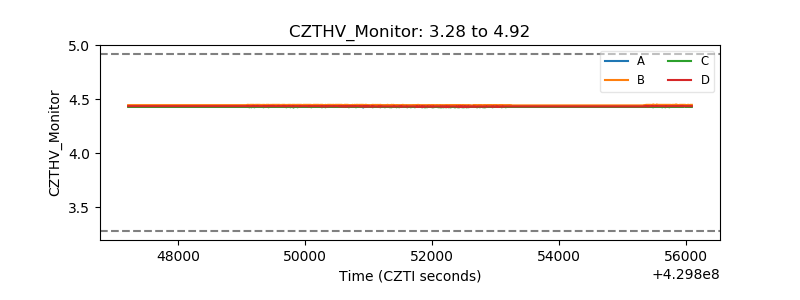 |
| D_VDD | 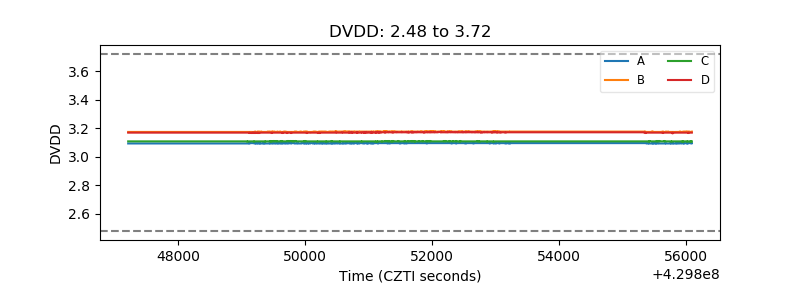 |
| Temperature 1 | 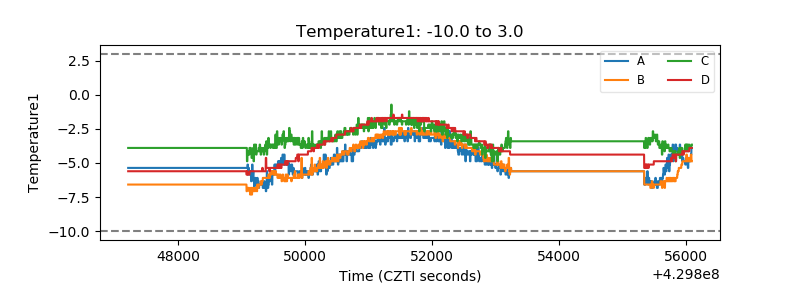 |
| Veto HV Monitor | 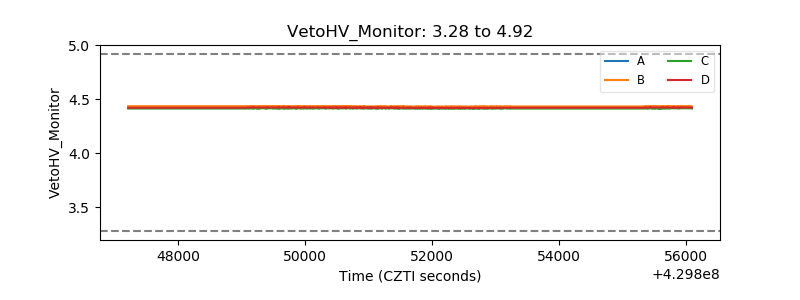 |
| Veto LLD | 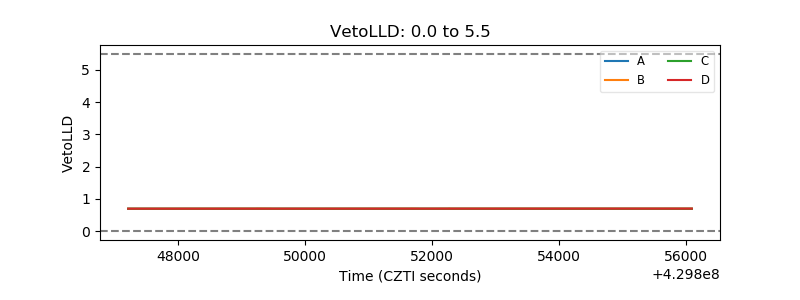 |
| Alpha Counter | 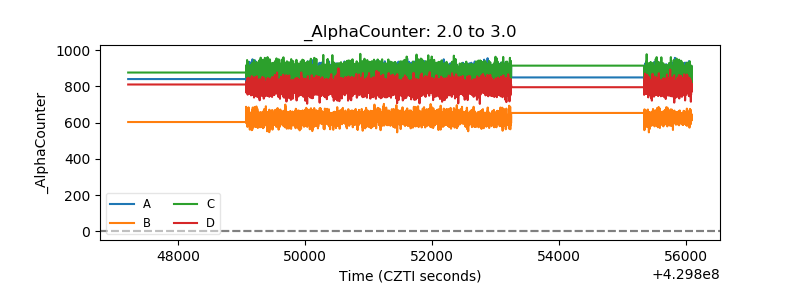 |
| _CPM_Rate | 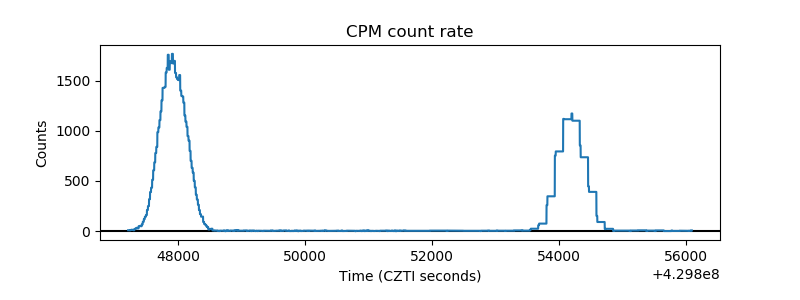 |
| CZT Counter |  |
| +2.5 Volts monitor | 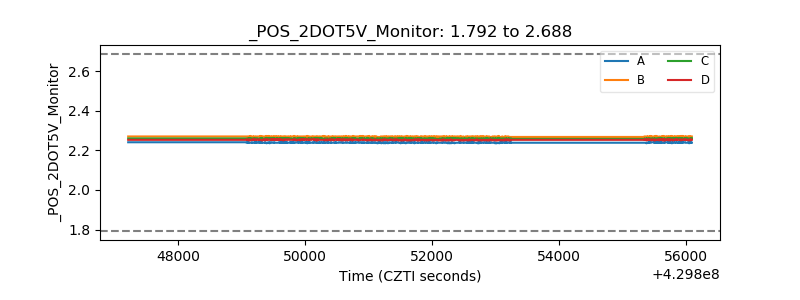 |
| +5 Volts monitor | 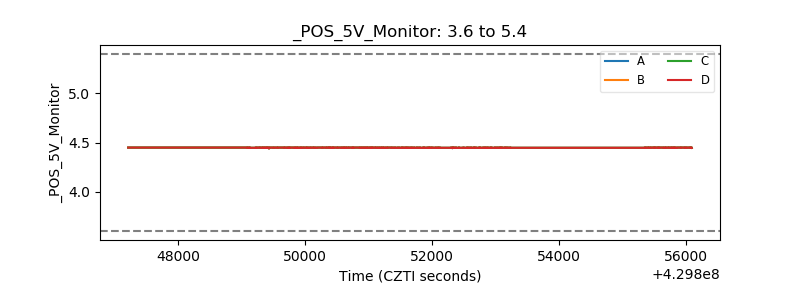 |
| _ROLL_ROT | 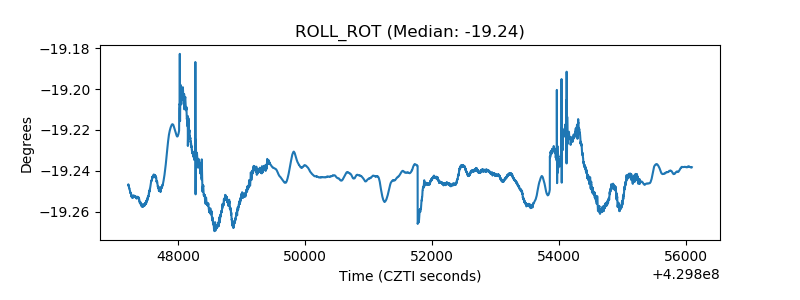 |
| _Roll_DEC | 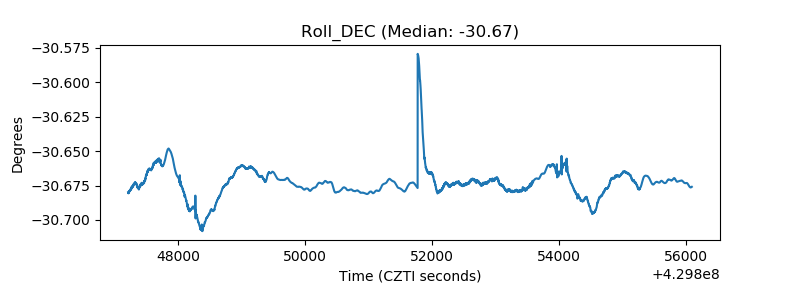 |
| _Roll_RA | 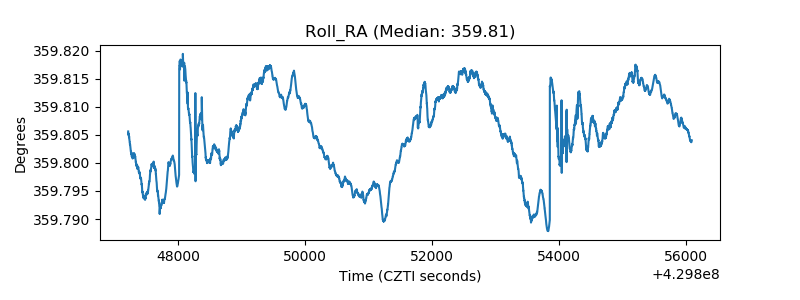 |
| Veto Counter | 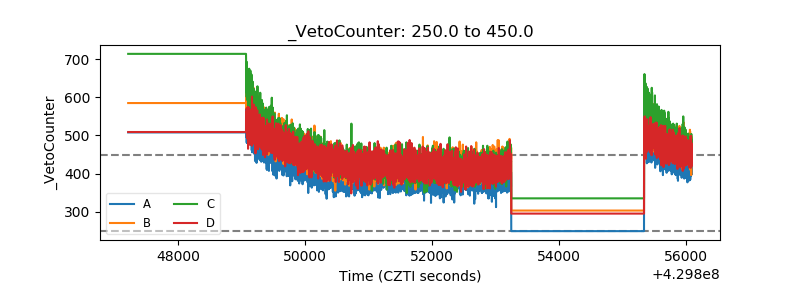 |