| Param | Original file | Final file |
|---|---|---|
| Filename | modeM0/AS1A05_174T01_9000005820_42620cztM0_level2.fits | modeM0/AS1A05_174T01_9000005820_42620cztM0_level2_quad_clean.evt |
| Size (bytes) | 295,404,480 | 87,998,400 |
| Size | 281.7 MB | 83.9 MB |
| Events in quadrant A | 2,904,998 | 589,827 |
| Events in quadrant B | 2,320,571 | 607,055 |
| Events in quadrant C | 2,484,533 | 588,896 |
| Events in quadrant D | 2,841,867 | 534,627 |
| Mode M9 | |||
|---|---|---|---|
| Quadrant | BADHDUFLAG | Total packets | Discarded packets |
| A | 0 | 34 | 0 |
| B | 0 | 35 | 0 |
| C | 0 | 35 | 0 |
| D | 0 | 35 | 0 |
| Mode SS | |||
|---|---|---|---|
| Quadrant | BADHDUFLAG | Total packets | Discarded packets |
| A | 0 | 100 | 0 |
| B | 0 | 100 | 0 |
| C | 0 | 100 | 0 |
| D | 0 | 100 | 0 |
| Mode M0 | |||
|---|---|---|---|
| Quadrant | BADHDUFLAG | Total packets | Discarded packets |
| A | 0 | 11498 | 2 |
| B | 0 | 9956 | 2 |
| C | 0 | 10093 | 2 |
| D | 0 | 11635 | 2 |
| Quadrant | Total seconds | Saturated seconds | Saturation percentage |
|---|---|---|---|
| A | 4912 | 14 | 0.285016% |
| B | 4912 | 13 | 0.264658% |
| C | 4912 | 9 | 0.183225% |
| D | 4912 | 92 | 1.872964% |
Noise dominated data is calculated using 1-second bins in cleaned event files. If a bin has >2000 counts, and if more than 50% of those come from <1% of pixels, then it is considered to be noise-dominated and hence unusable.
| Quadrant | # 1 sec bins | Bins with >0 counts | Bins with >2000 counts | High rate bins dominated by noise | Noise dominated (total time) | Noise dominated (detector-on time) | Marked lightcurve |
|---|---|---|---|---|---|---|---|
| A | 7035 | 4913 | 6 | 6 | 0.09% | 0.12% |  |
| B | 7035 | 4913 | 4 | 4 | 0.06% | 0.08% | 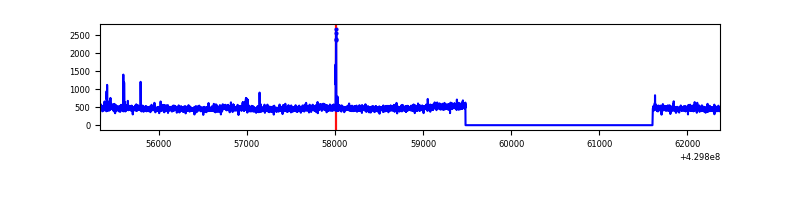 |
| C | 7035 | 4913 | 5 | 5 | 0.07% | 0.10% | 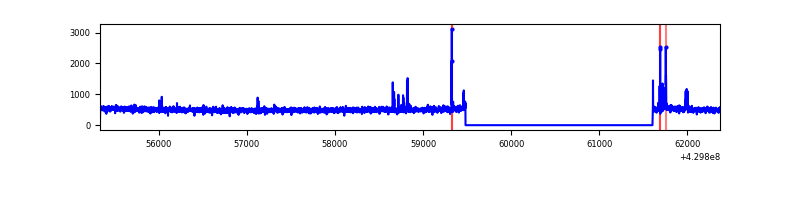 |
| D | 7035 | 4913 | 81 | 81 | 1.15% | 1.65% | 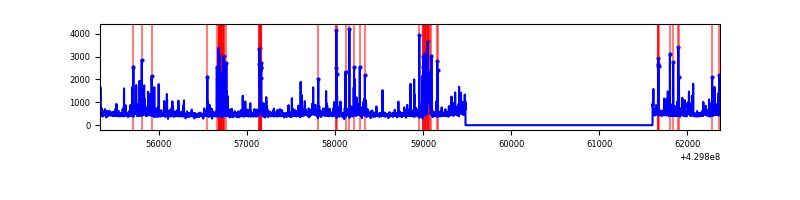 |
Top three noisy pixels from each quadrant. If the there are fewer than three noisy pixels in the level2.evt file, extra rows are filled as -1
| Pixel properties | Quadrant properties | ||||||
|---|---|---|---|---|---|---|---|
| Quadrant | DetID | PixID | Counts | Sigma | Mean | Median | Sigma |
| A | 10 | 83 | 528589 | 4448.88 | 578 | 567 | 118.7 |
| A | 2 | 79 | 62487 | 521.71 | 578 | 567 | 118.7 |
| A | 7 | 3 | 54059 | 450.7 | 578 | 567 | 118.7 |
| B | 0 | 168 | 25035 | 222.15 | 569 | 554 | 110.2 |
| B | 0 | 189 | 18813 | 165.69 | 569 | 554 | 110.2 |
| B | 0 | 246 | 16500 | 144.7 | 569 | 554 | 110.2 |
| C | 15 | 214 | 206356 | 1553.16 | 568 | 572 | 132.5 |
| C | 14 | 254 | 47196 | 351.9 | 568 | 572 | 132.5 |
| C | 4 | 254 | 8279 | 58.17 | 568 | 572 | 132.5 |
| D | 1 | 52 | 289186 | 2114.55 | 566 | 551 | 136.5 |
| D | 13 | 249 | 103743 | 755.99 | 566 | 551 | 136.5 |
| D | 12 | 6 | 83364 | 606.69 | 566 | 551 | 136.5 |
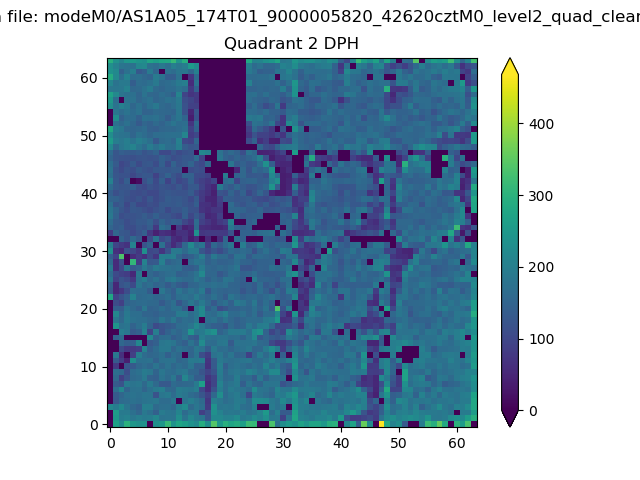
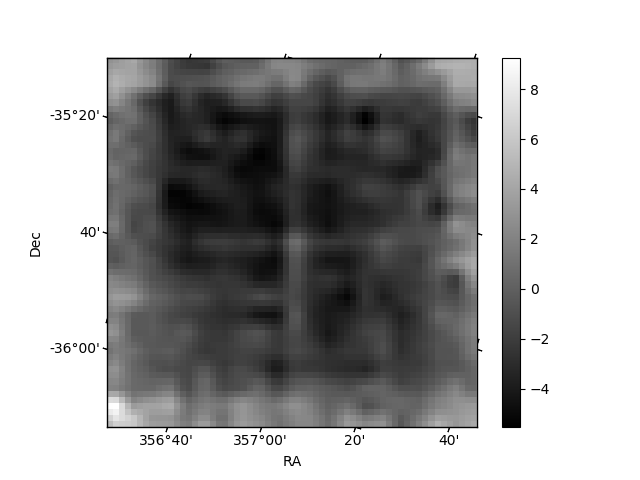
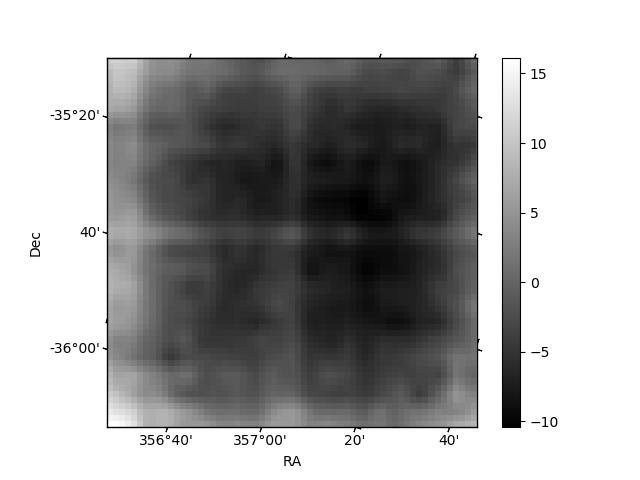
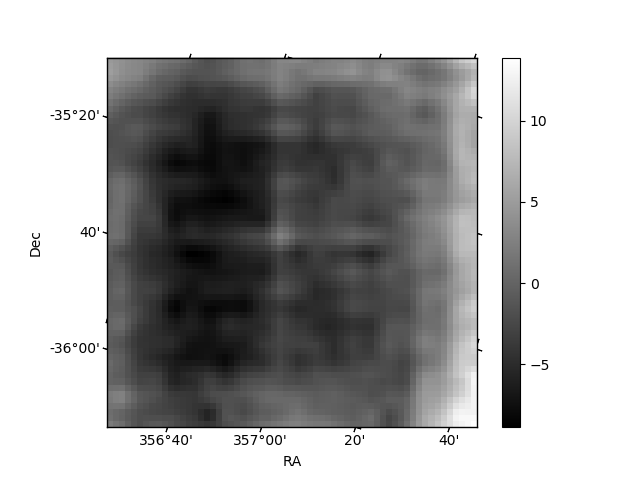
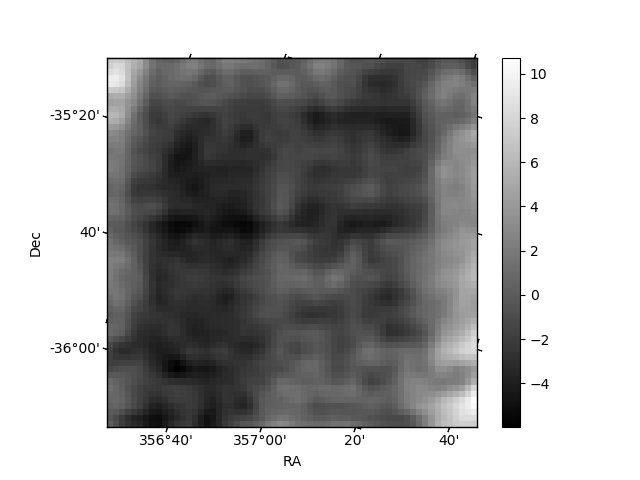
Histogram calculated using DETX and DETY for each event in the final _common_clean file
| Quadrant A | 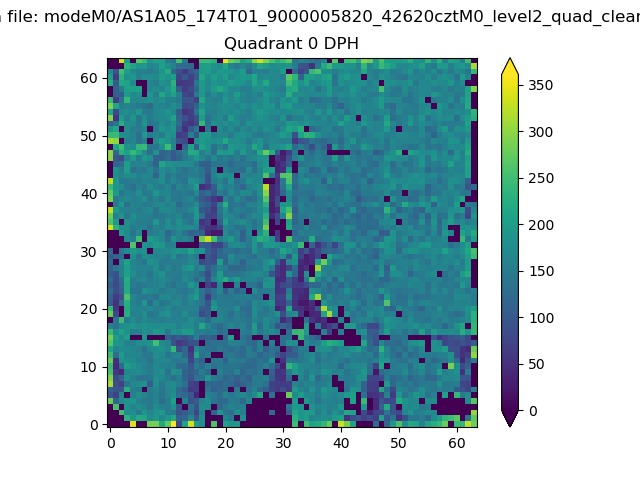 |
 |
Quadrant B |
|---|---|---|---|
| Quadrant D | 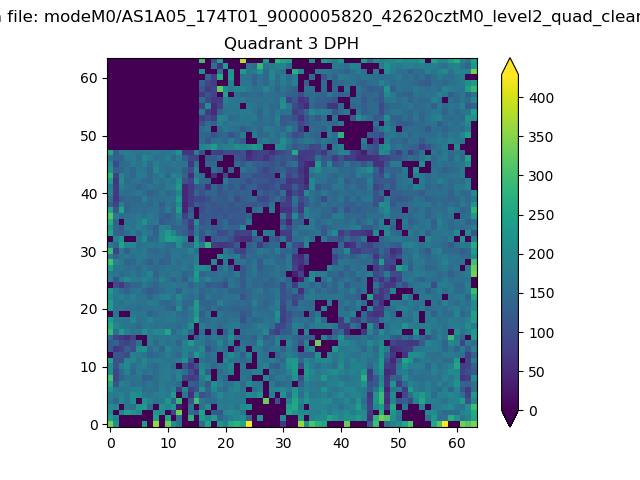 |
 |
Quadrant C |
| Plot type | Count rate plots | Images |
|---|---|---|
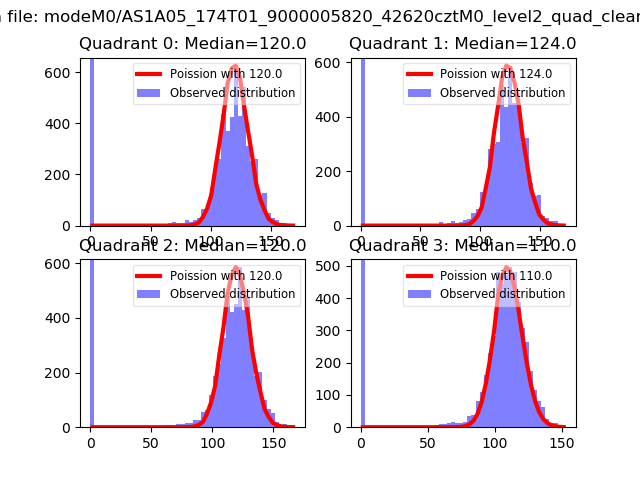
| Comparison with Poisson distribution Blue bars denote a histogram of data divided into 1 sec bins. Red curve is a Poisson curve with rate = median count rate of data. |
 |
 |
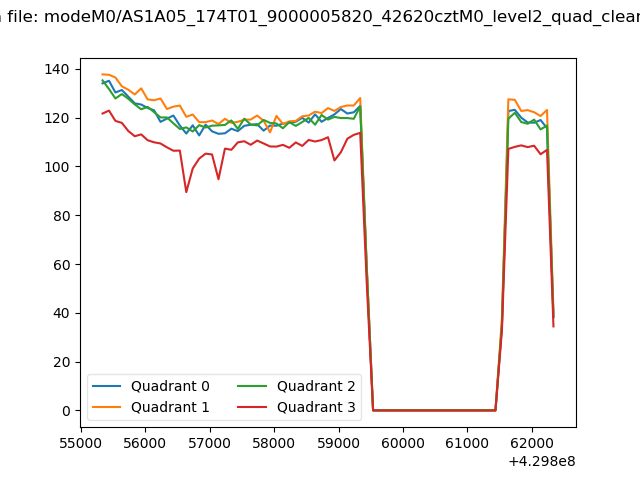
| Quadrant-wise count rates Data is divided into 100 sec bins |
 |
|
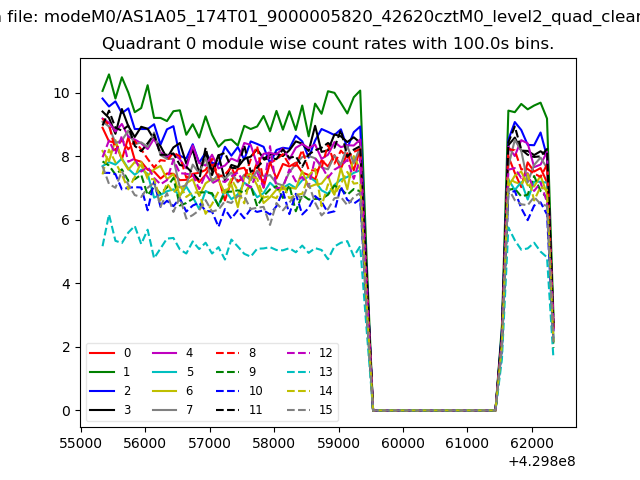
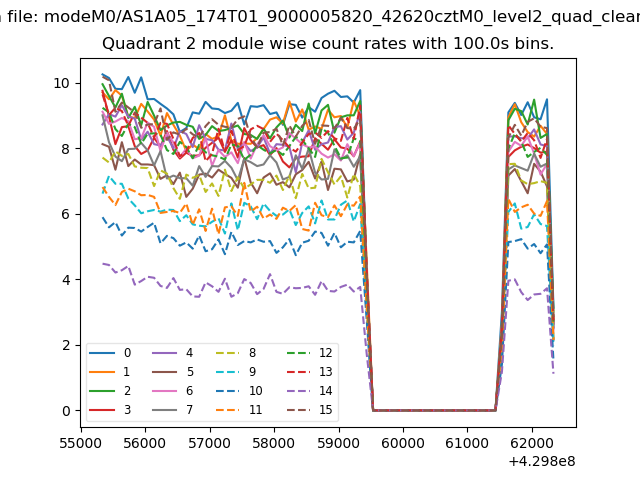
| Module-wise count rates for Quadrant A Data is divided into 100 sec bins |
 |
 |
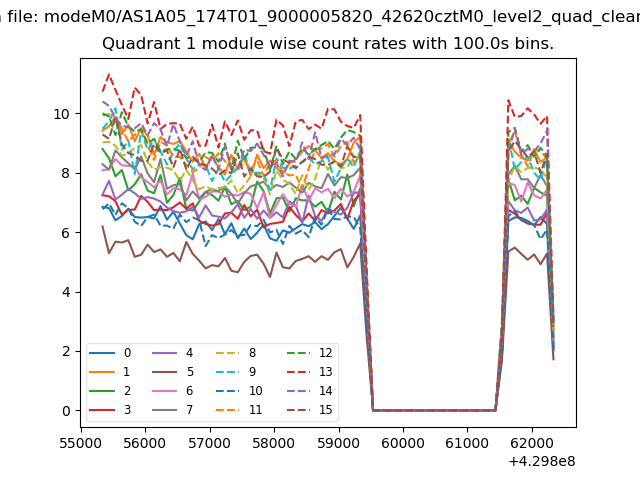
| Module-wise count rates for Quadrant B Data is divided into 100 sec bins |
 |
 |
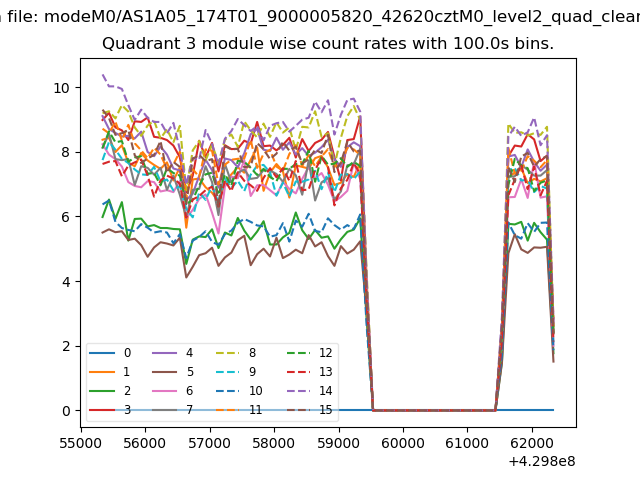
| Module-wise count rates for Quadrant C Data is divided into 100 sec bins |
 |
 |
| Module-wise count rates for Quadrant D Data is divided into 100 sec bins |
 |
 |
| Parameter | Plot |
|---|---|
| CZT HV Monitor | 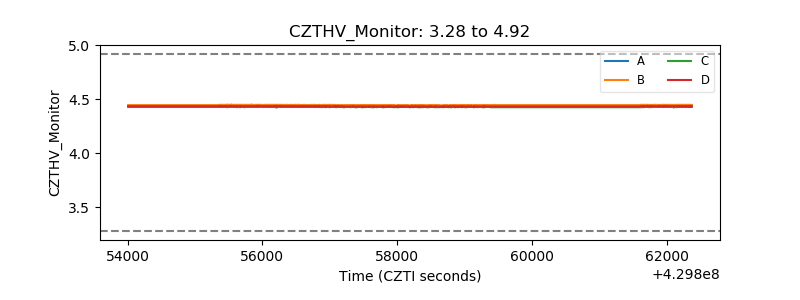 |
| D_VDD | 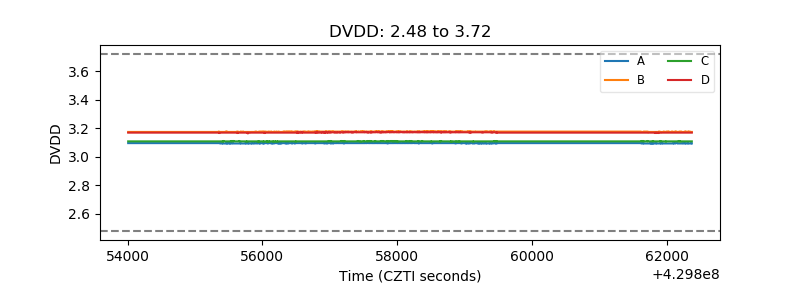 |
| Temperature 1 | 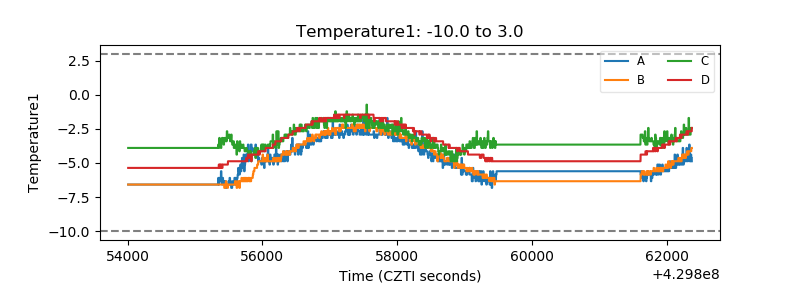 |
| Veto HV Monitor | 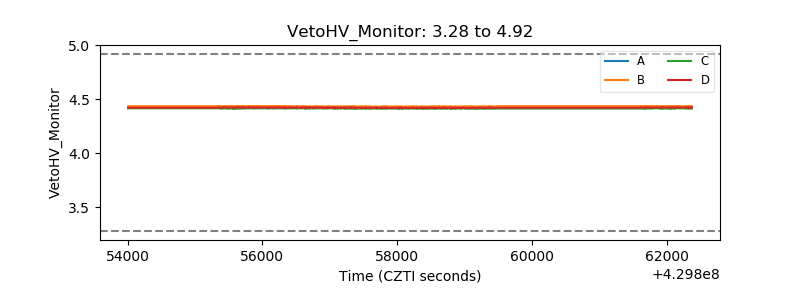 |
| Veto LLD | 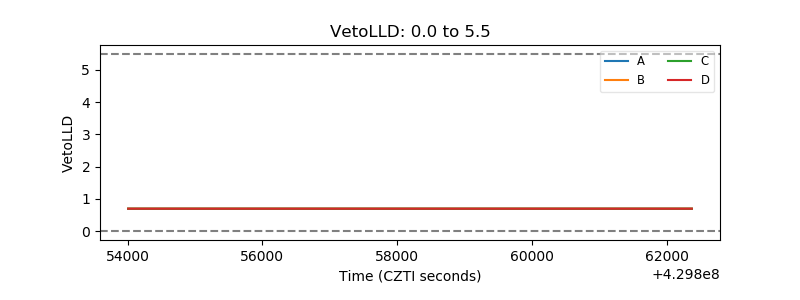 |
| Alpha Counter | 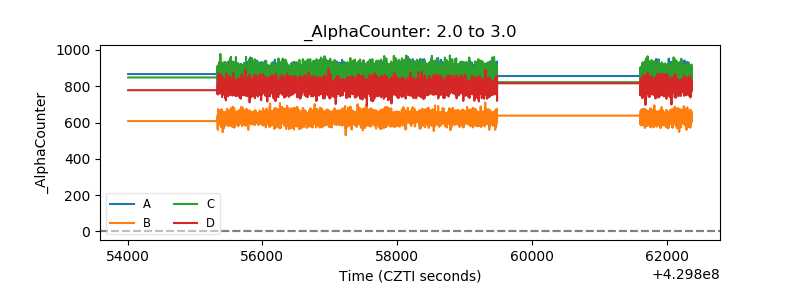 |
| _CPM_Rate | 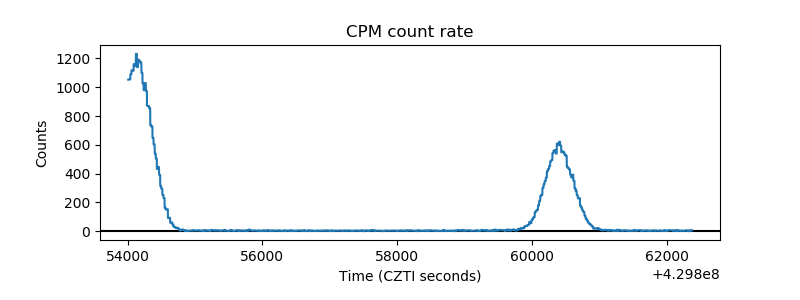 |
| CZT Counter |  |
| +2.5 Volts monitor | 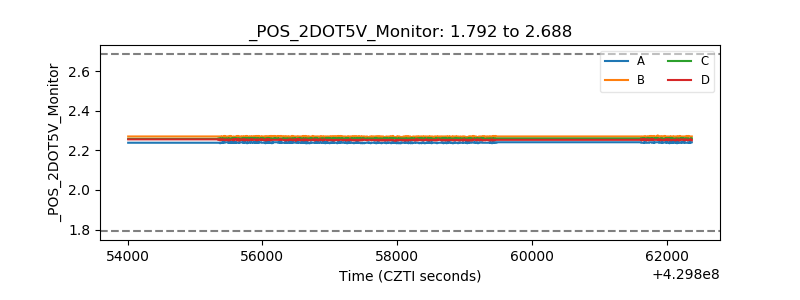 |
| +5 Volts monitor | 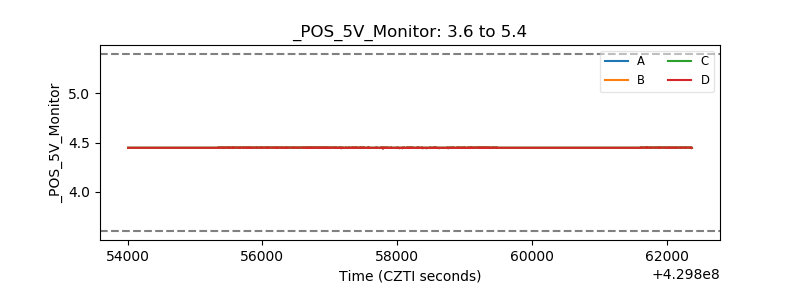 |
| _ROLL_ROT | 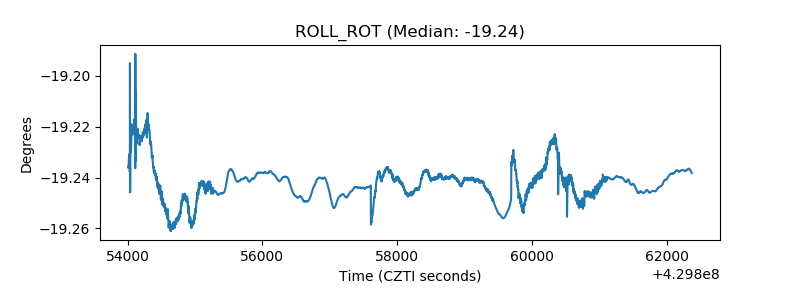 |
| _Roll_DEC | 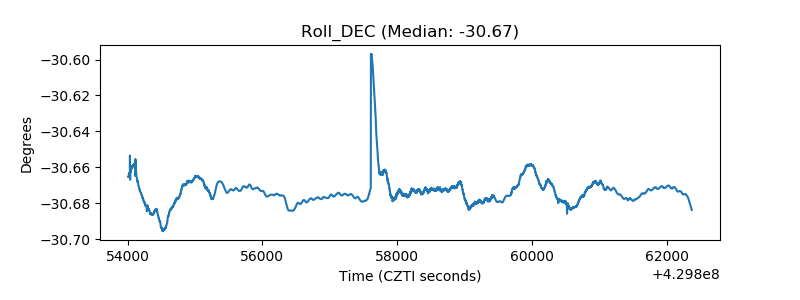 |
| _Roll_RA | 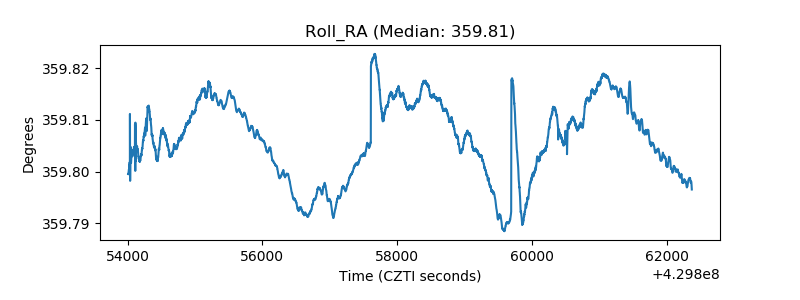 |
| Veto Counter | 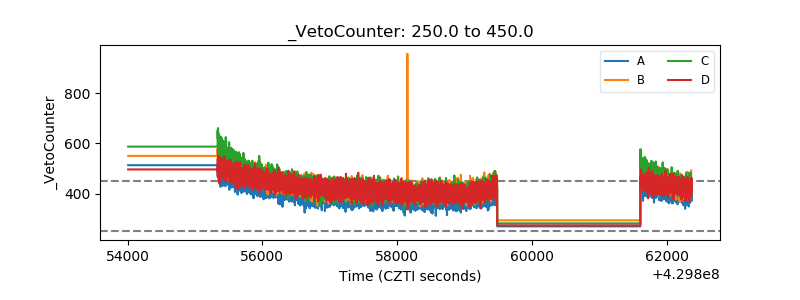 |