| Param | Original file | Final file |
|---|---|---|
| Filename | modeM0/AS1A05_174T01_9000005820_42621cztM0_level2.fits | modeM0/AS1A05_174T01_9000005820_42621cztM0_level2_quad_clean.evt |
| Size (bytes) | 302,866,560 | 83,301,120 |
| Size | 288.8 MB | 79.4 MB |
| Events in quadrant A | 2,799,350 | 560,242 |
| Events in quadrant B | 2,261,757 | 572,173 |
| Events in quadrant C | 2,408,767 | 554,134 |
| Events in quadrant D | 3,363,056 | 495,203 |
| Mode M9 | |||
|---|---|---|---|
| Quadrant | BADHDUFLAG | Total packets | Discarded packets |
| A | 0 | 24 | 0 |
| B | 0 | 25 | 0 |
| C | 0 | 25 | 0 |
| D | 0 | 25 | 0 |
| Mode SS | |||
|---|---|---|---|
| Quadrant | BADHDUFLAG | Total packets | Discarded packets |
| A | 0 | 100 | 0 |
| B | 0 | 100 | 0 |
| C | 0 | 100 | 0 |
| D | 0 | 100 | 0 |
| Mode M0 | |||
|---|---|---|---|
| Quadrant | BADHDUFLAG | Total packets | Discarded packets |
| A | 0 | 11128 | 2 |
| B | 0 | 9961 | 2 |
| C | 0 | 9948 | 2 |
| D | 0 | 13217 | 2 |
| Quadrant | Total seconds | Saturated seconds | Saturation percentage |
|---|---|---|---|
| A | 4852 | 11 | 0.226711% |
| B | 4852 | 3 | 0.061830% |
| C | 4852 | 8 | 0.164880% |
| D | 4852 | 196 | 4.039571% |
Noise dominated data is calculated using 1-second bins in cleaned event files. If a bin has >2000 counts, and if more than 50% of those come from <1% of pixels, then it is considered to be noise-dominated and hence unusable.
| Quadrant | # 1 sec bins | Bins with >0 counts | Bins with >2000 counts | High rate bins dominated by noise | Noise dominated (total time) | Noise dominated (detector-on time) | Marked lightcurve |
|---|---|---|---|---|---|---|---|
| A | 6944 | 4853 | 3 | 3 | 0.04% | 0.06% | 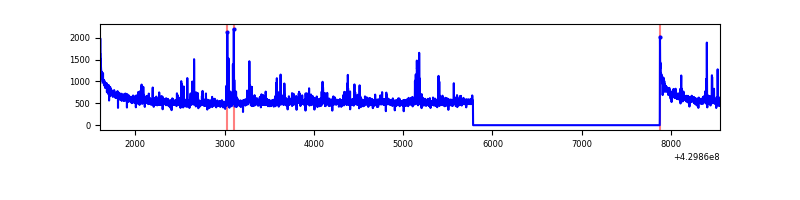 |
| B | 6944 | 4853 | 0 | 0 | 0.00% | 0.00% | 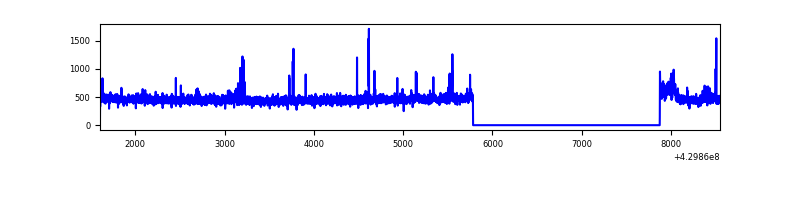 |
| C | 6944 | 4853 | 4 | 4 | 0.06% | 0.08% | 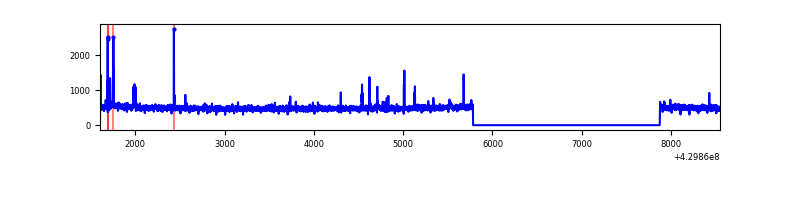 |
| D | 6944 | 4853 | 177 | 177 | 2.55% | 3.65% | 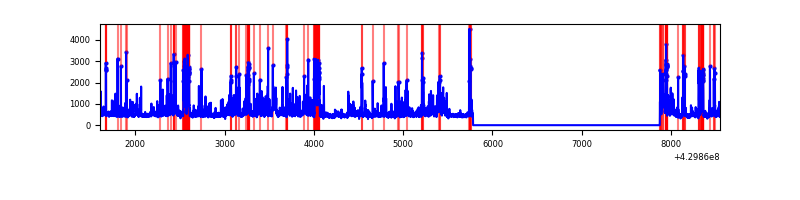 |
Top three noisy pixels from each quadrant. If the there are fewer than three noisy pixels in the level2.evt file, extra rows are filled as -1
| Pixel properties | Quadrant properties | ||||||
|---|---|---|---|---|---|---|---|
| Quadrant | DetID | PixID | Counts | Sigma | Mean | Median | Sigma |
| A | 10 | 83 | 509553 | 4453.93 | 557 | 546 | 114.3 |
| A | 2 | 79 | 99027 | 861.73 | 557 | 546 | 114.3 |
| A | 13 | 248 | 25550 | 218.79 | 557 | 546 | 114.3 |
| B | 0 | 245 | 46994 | 439.71 | 548 | 534 | 105.7 |
| B | 7 | 219 | 32373 | 301.33 | 548 | 534 | 105.7 |
| B | 12 | 111 | 13381 | 121.59 | 548 | 534 | 105.7 |
| C | 15 | 214 | 205572 | 1595.65 | 546 | 551 | 128.5 |
| C | 14 | 254 | 43645 | 335.39 | 546 | 551 | 128.5 |
| C | 7 | 220 | 10570 | 77.98 | 546 | 551 | 128.5 |
| D | 1 | 52 | 346580 | 2626.95 | 539 | 523 | 131.7 |
| D | 13 | 249 | 339465 | 2572.93 | 539 | 523 | 131.7 |
| D | 5 | 70 | 122241 | 923.97 | 539 | 523 | 131.7 |
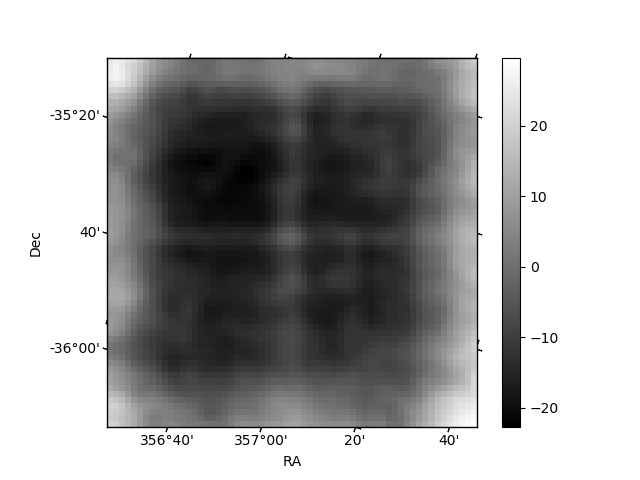
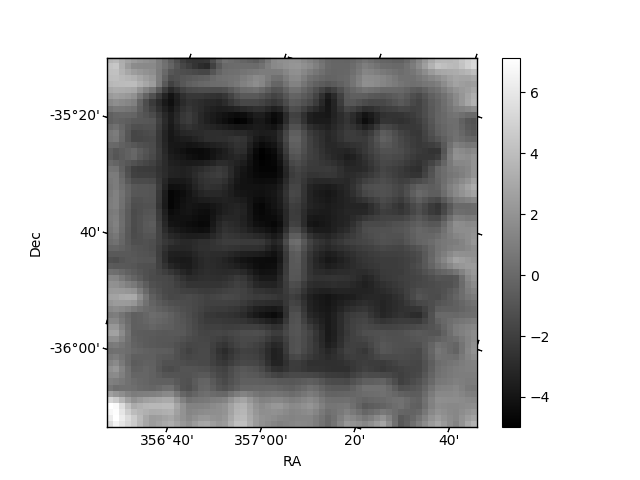
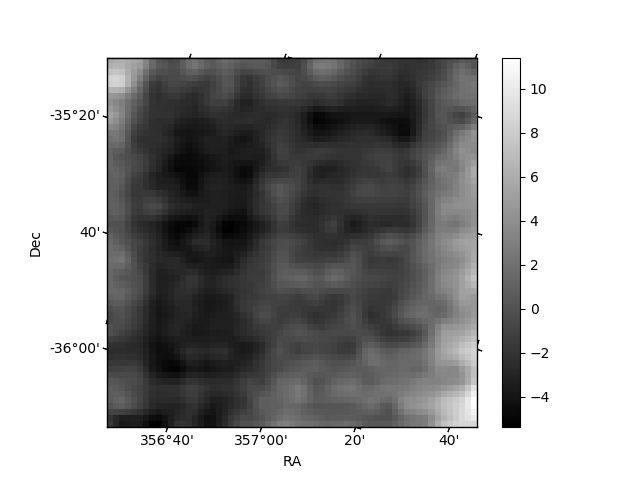
Histogram calculated using DETX and DETY for each event in the final _common_clean file
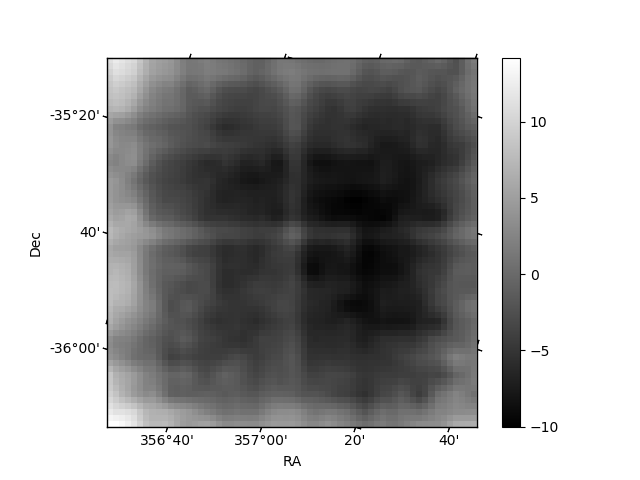
| Quadrant A | 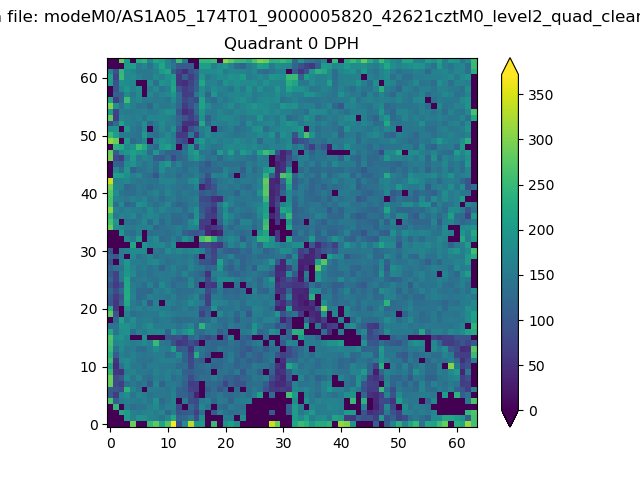 |
 |
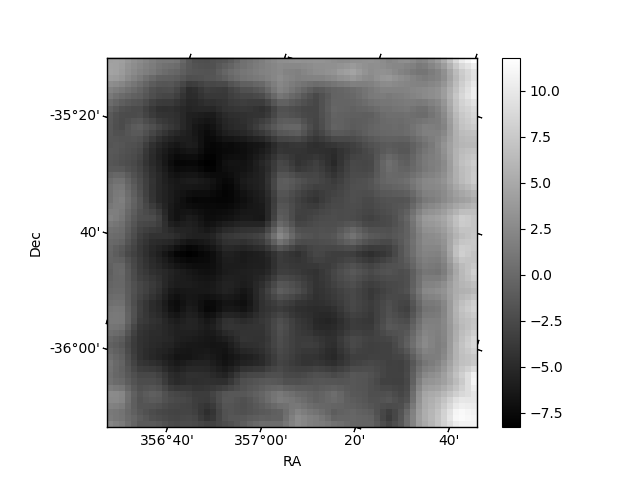
Quadrant B |
|---|---|---|---|
| Quadrant D | 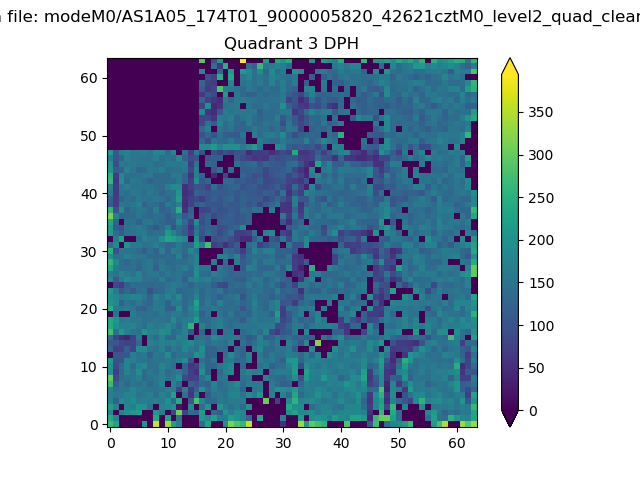 |
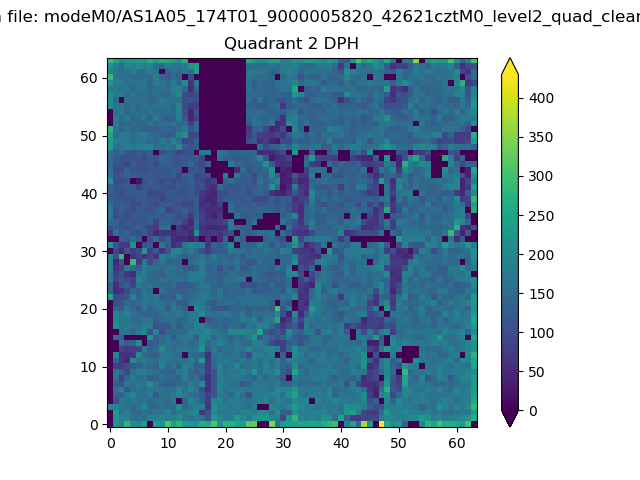 |
Quadrant C |
| Plot type | Count rate plots | Images |
|---|---|---|
| Comparison with Poisson distribution Blue bars denote a histogram of data divided into 1 sec bins. Red curve is a Poisson curve with rate = median count rate of data. |
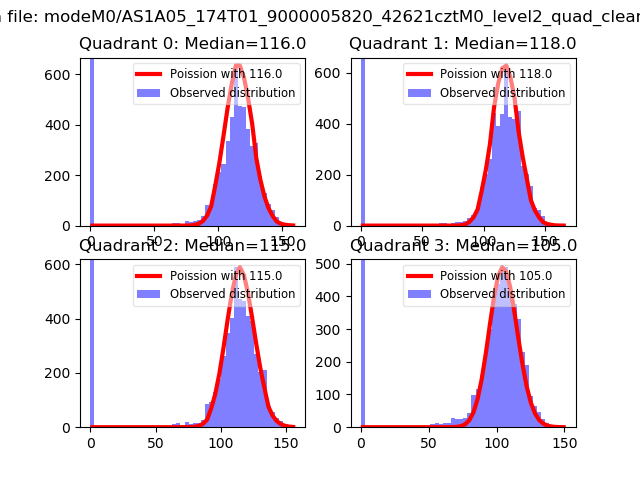 |
 |
| Quadrant-wise count rates Data is divided into 100 sec bins |
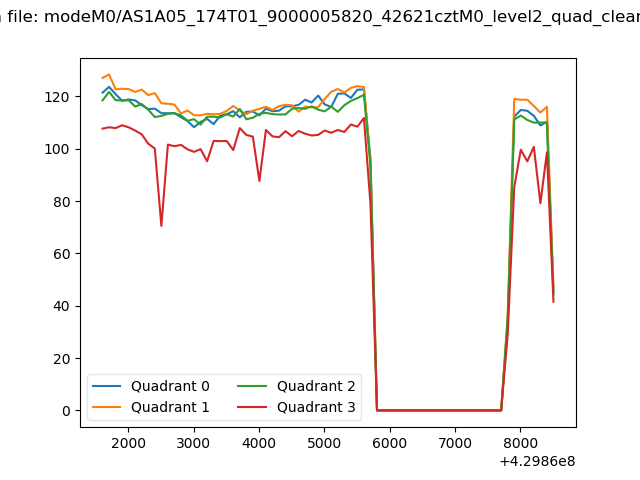 |
|
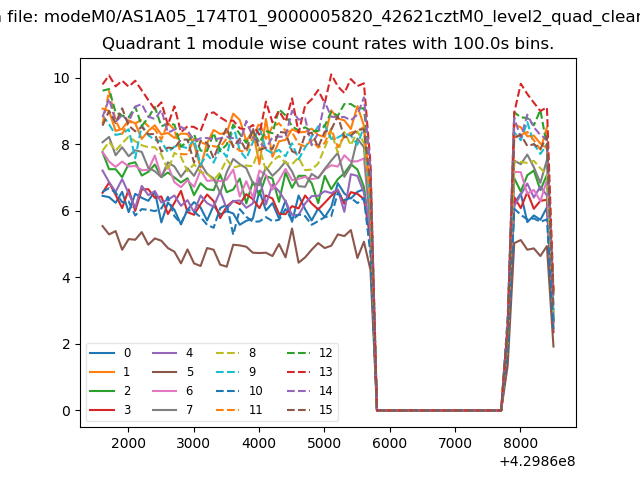
| Module-wise count rates for Quadrant A Data is divided into 100 sec bins |
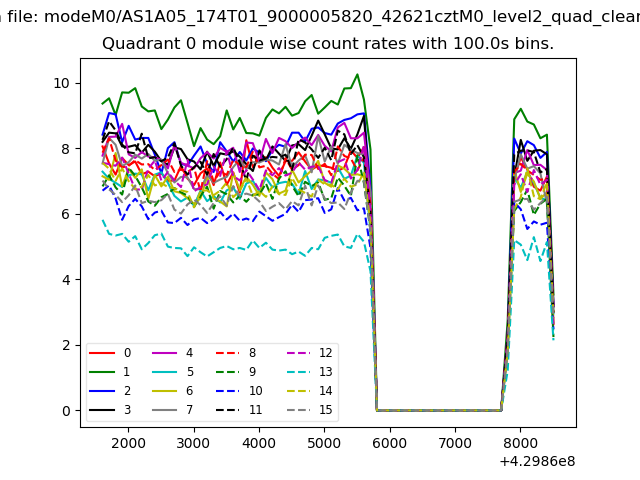 |
 |
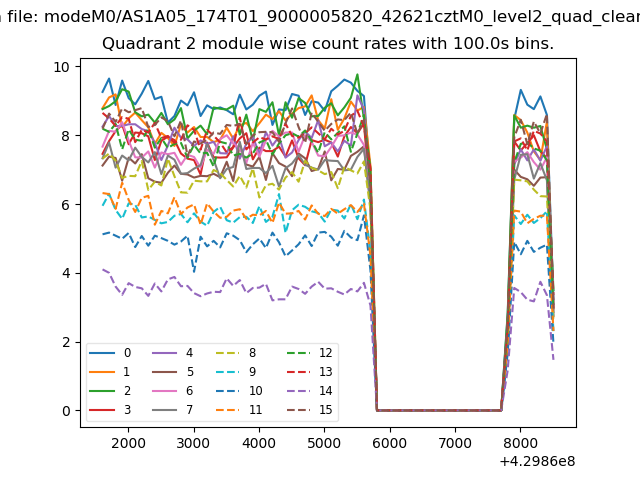
| Module-wise count rates for Quadrant B Data is divided into 100 sec bins |
 |
 |
| Module-wise count rates for Quadrant C Data is divided into 100 sec bins |
 |
 |
| Module-wise count rates for Quadrant D Data is divided into 100 sec bins |
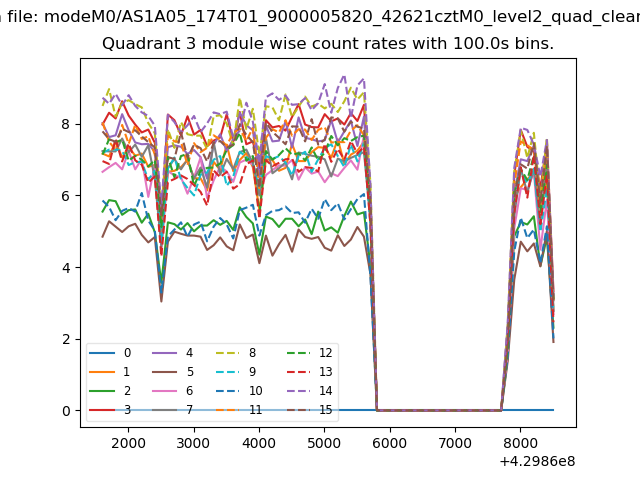 |
 |
| Parameter | Plot |
|---|---|
| CZT HV Monitor | 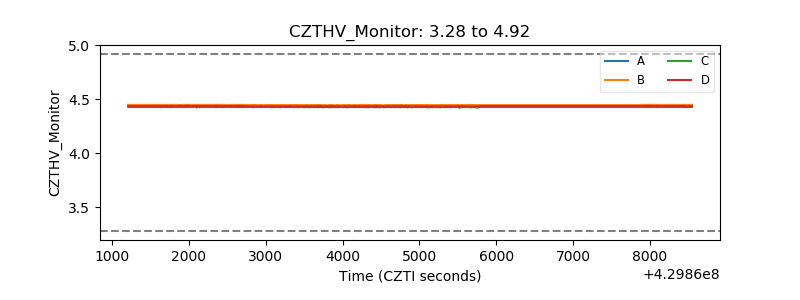 |
| D_VDD | 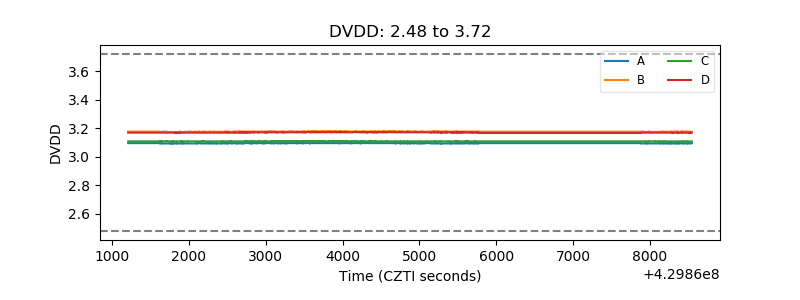 |
| Temperature 1 | 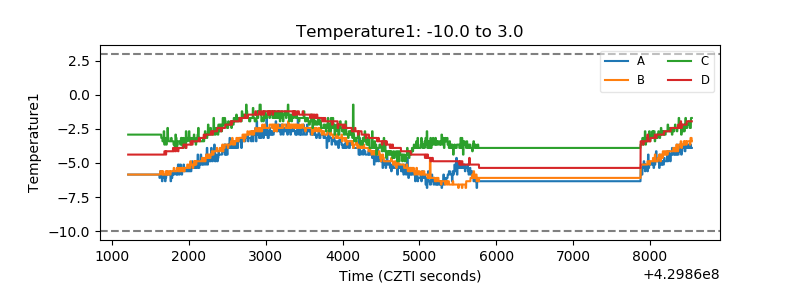 |
| Veto HV Monitor |  |
| Veto LLD | 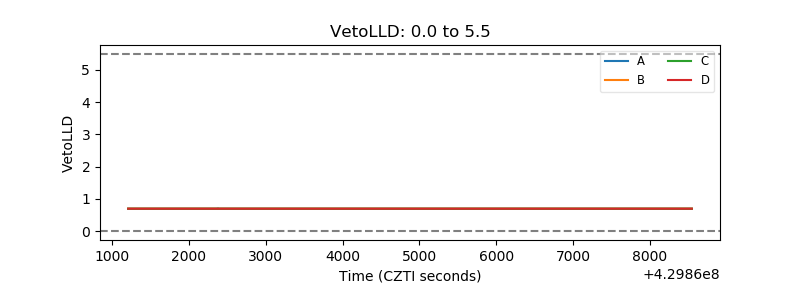 |
| Alpha Counter | 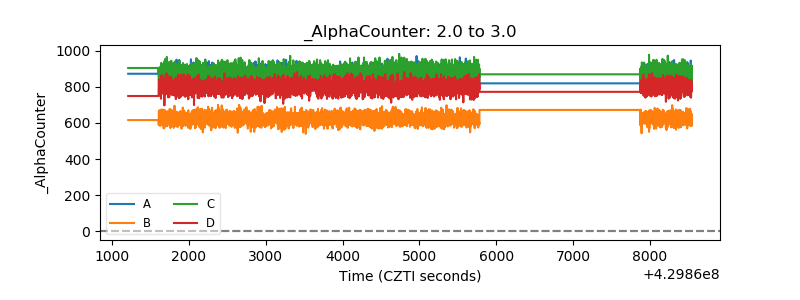 |
| _CPM_Rate | 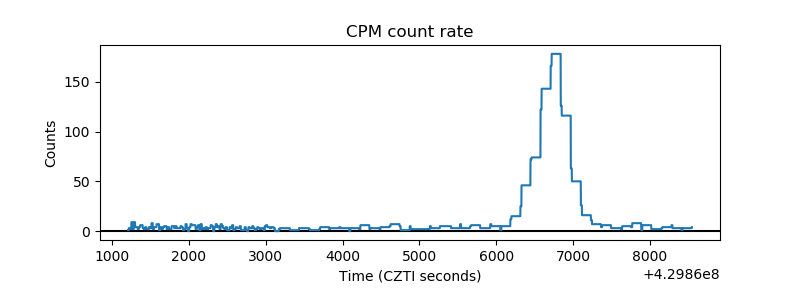 |
| CZT Counter |  |
| +2.5 Volts monitor | 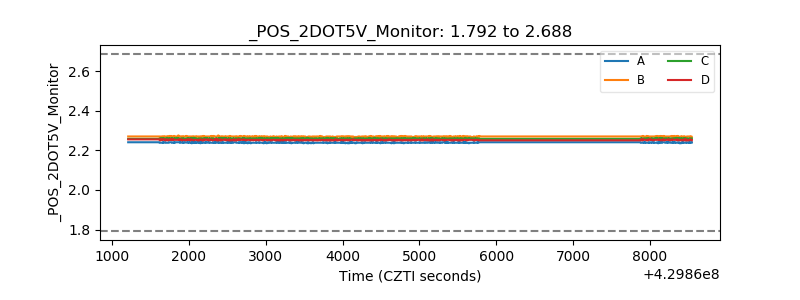 |
| +5 Volts monitor | 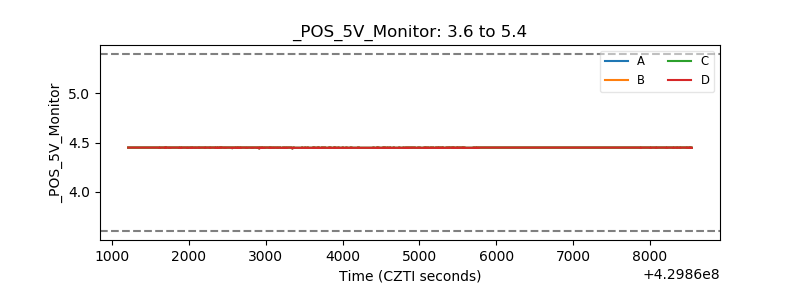 |
| _ROLL_ROT | 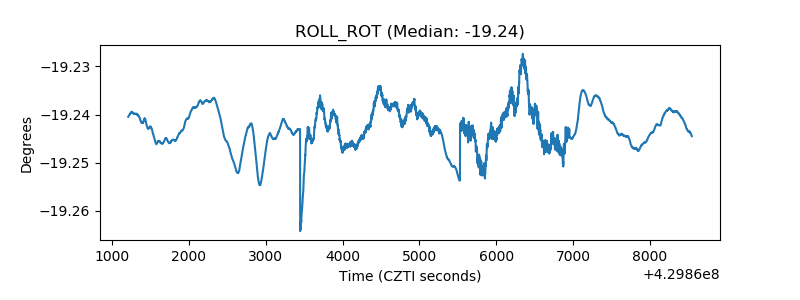 |
| _Roll_DEC | 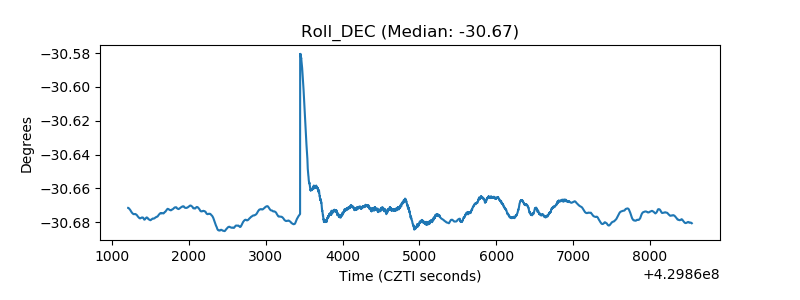 |
| _Roll_RA | 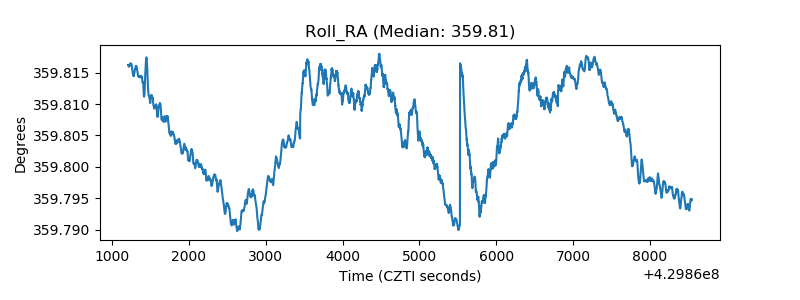 |
| Veto Counter | 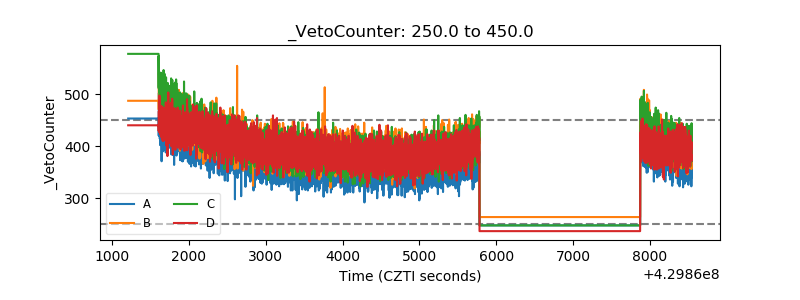 |