| Param | Original file | Final file |
|---|---|---|
| Filename | modeM0/AS1A05_174T01_9000005820_42622cztM0_level2.fits | modeM0/AS1A05_174T01_9000005820_42622cztM0_level2_quad_clean.evt |
| Size (bytes) | 304,940,160 | 84,127,680 |
| Size | 290.8 MB | 80.2 MB |
| Events in quadrant A | 2,922,629 | 560,212 |
| Events in quadrant B | 2,356,242 | 575,945 |
| Events in quadrant C | 2,435,962 | 554,065 |
| Events in quadrant D | 3,177,639 | 501,482 |
| Mode M9 | |||
|---|---|---|---|
| Quadrant | BADHDUFLAG | Total packets | Discarded packets |
| A | 0 | 28 | 0 |
| B | 0 | 29 | 0 |
| C | 0 | 29 | 0 |
| D | 0 | 29 | 0 |
| Mode SS | |||
|---|---|---|---|
| Quadrant | BADHDUFLAG | Total packets | Discarded packets |
| A | 0 | 104 | 0 |
| B | 0 | 104 | 0 |
| C | 0 | 104 | 0 |
| D | 0 | 104 | 0 |
| Mode M0 | |||
|---|---|---|---|
| Quadrant | BADHDUFLAG | Total packets | Discarded packets |
| A | 0 | 11736 | 2 |
| B | 0 | 10434 | 2 |
| C | 0 | 10306 | 2 |
| D | 0 | 12961 | 2 |
| Quadrant | Total seconds | Saturated seconds | Saturation percentage |
|---|---|---|---|
| A | 5071 | 26 | 0.512719% |
| B | 5071 | 6 | 0.118320% |
| C | 5071 | 10 | 0.197200% |
| D | 5071 | 187 | 3.687636% |
Noise dominated data is calculated using 1-second bins in cleaned event files. If a bin has >2000 counts, and if more than 50% of those come from <1% of pixels, then it is considered to be noise-dominated and hence unusable.
| Quadrant | # 1 sec bins | Bins with >0 counts | Bins with >2000 counts | High rate bins dominated by noise | Noise dominated (total time) | Noise dominated (detector-on time) | Marked lightcurve |
|---|---|---|---|---|---|---|---|
| A | 6984 | 5072 | 10 | 10 | 0.14% | 0.20% | 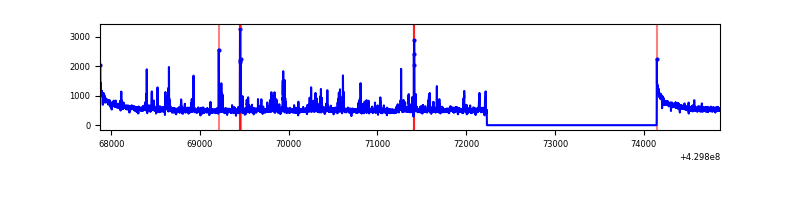 |
| B | 6984 | 5072 | 0 | 0 | 0.00% | 0.00% | 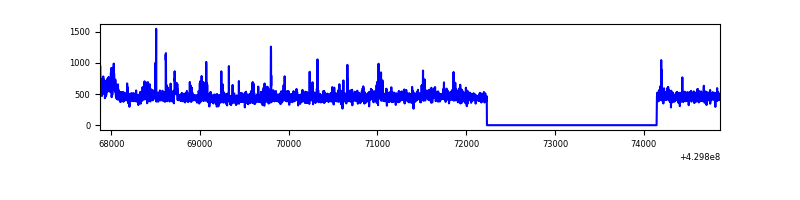 |
| C | 6984 | 5072 | 5 | 5 | 0.07% | 0.10% | 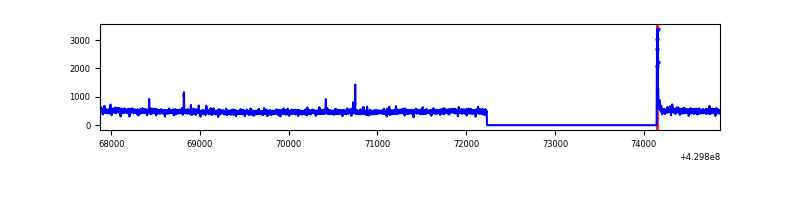 |
| D | 6984 | 5072 | 160 | 160 | 2.29% | 3.15% | 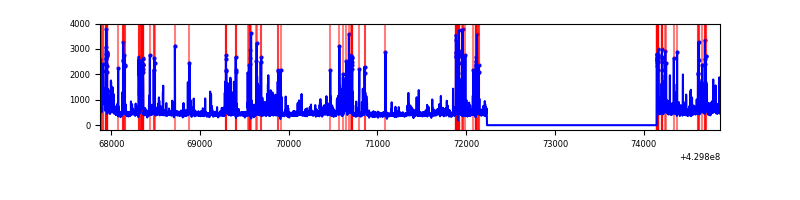 |
Top three noisy pixels from each quadrant. If the there are fewer than three noisy pixels in the level2.evt file, extra rows are filled as -1
| Pixel properties | Quadrant properties | ||||||
|---|---|---|---|---|---|---|---|
| Quadrant | DetID | PixID | Counts | Sigma | Mean | Median | Sigma |
| A | 10 | 83 | 523494 | 4515.98 | 564 | 551 | 115.8 |
| A | 2 | 79 | 199634 | 1719.22 | 564 | 551 | 115.8 |
| A | 9 | 254 | 13005 | 107.55 | 564 | 551 | 115.8 |
| B | 0 | 245 | 72841 | 666.35 | 562 | 548 | 108.5 |
| B | 7 | 219 | 32368 | 293.3 | 562 | 548 | 108.5 |
| B | 12 | 111 | 14006 | 124.05 | 562 | 548 | 108.5 |
| C | 15 | 214 | 213614 | 1616.89 | 557 | 560 | 131.8 |
| C | 3 | 233 | 30691 | 228.67 | 557 | 560 | 131.8 |
| C | 14 | 254 | 17567 | 129.07 | 557 | 560 | 131.8 |
| D | 1 | 52 | 340564 | 2515.99 | 549 | 534 | 135.1 |
| D | 2 | 249 | 303615 | 2242.59 | 549 | 534 | 135.1 |
| D | 13 | 249 | 274342 | 2025.99 | 549 | 534 | 135.1 |
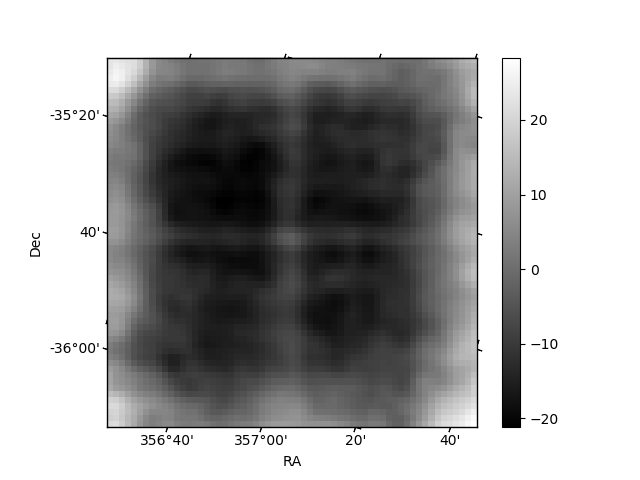
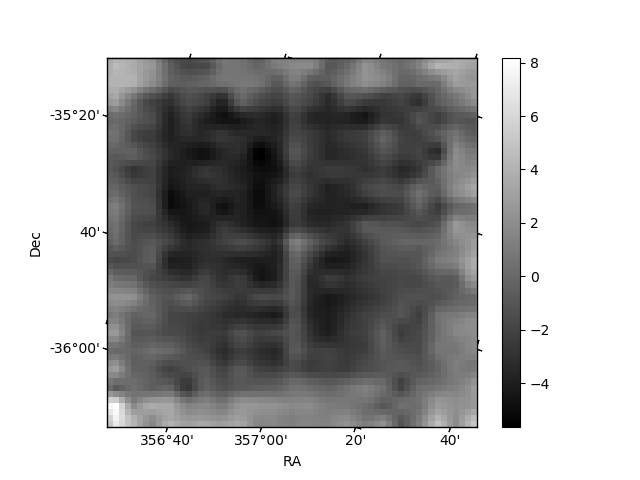
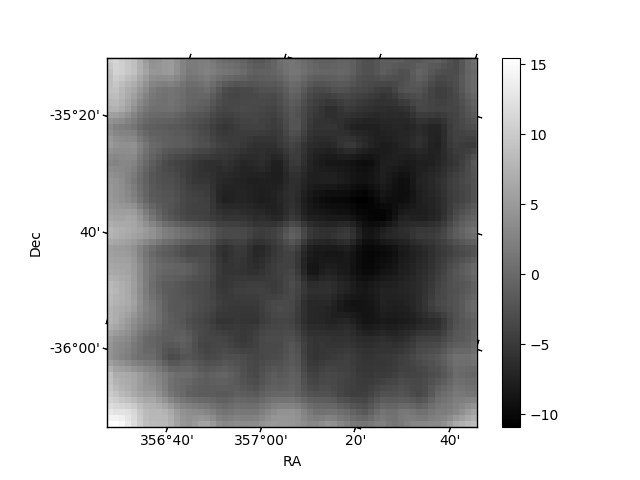
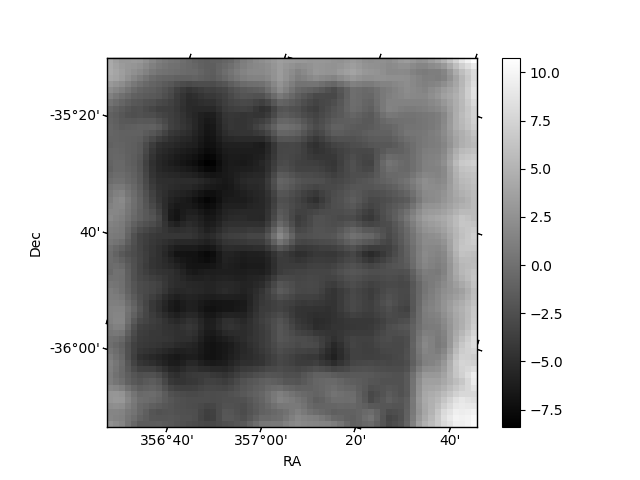
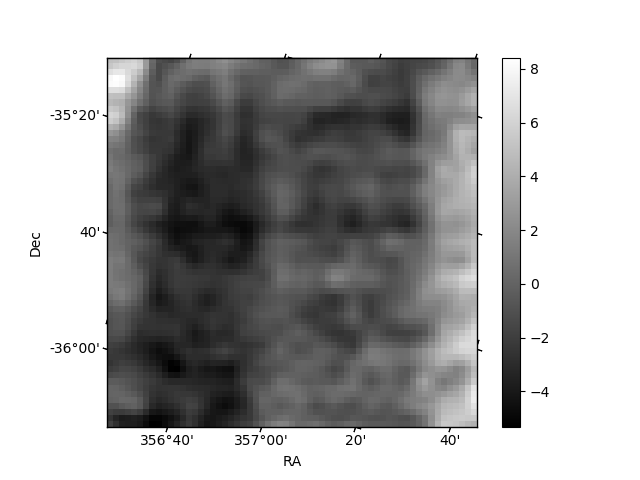
Histogram calculated using DETX and DETY for each event in the final _common_clean file
| Quadrant A | 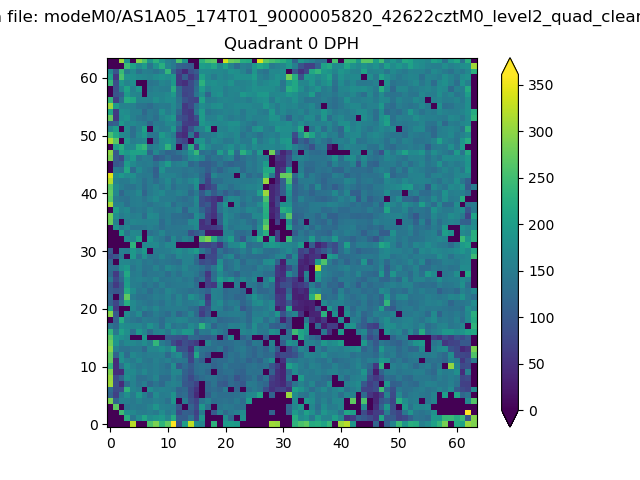 |
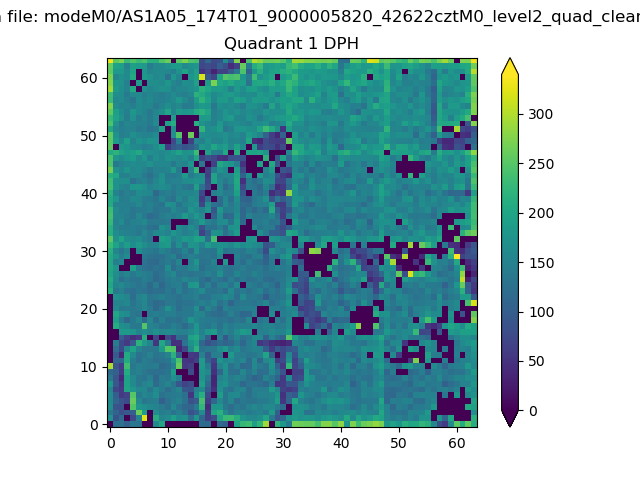 |
Quadrant B |
|---|---|---|---|
| Quadrant D | 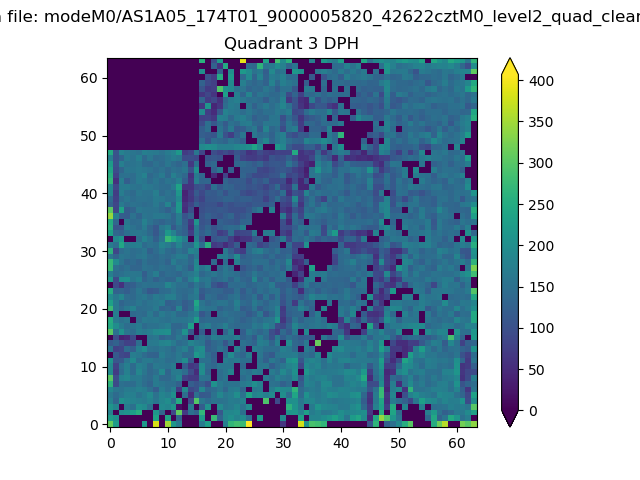 |
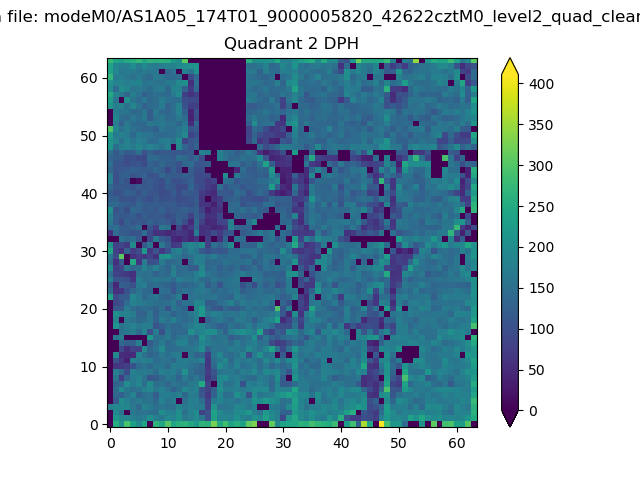 |
Quadrant C |
| Plot type | Count rate plots | Images |
|---|---|---|
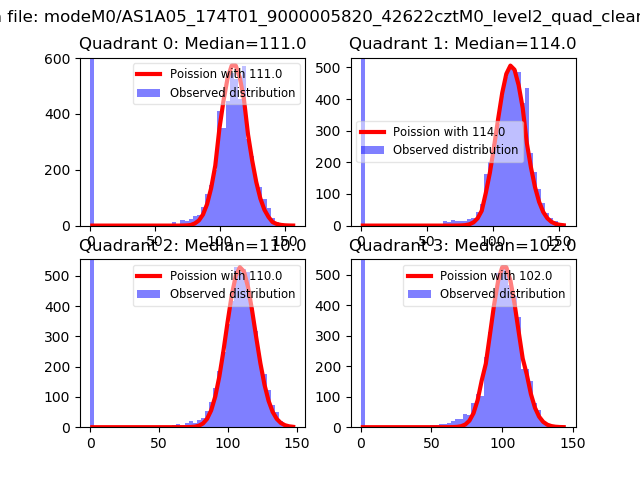
| Comparison with Poisson distribution Blue bars denote a histogram of data divided into 1 sec bins. Red curve is a Poisson curve with rate = median count rate of data. |
 |
 |
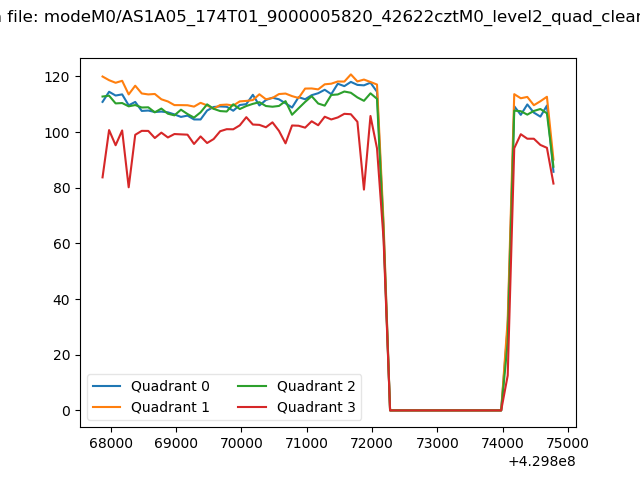
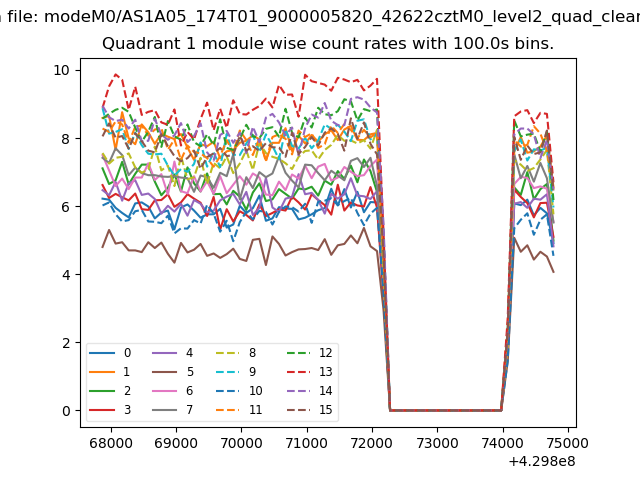
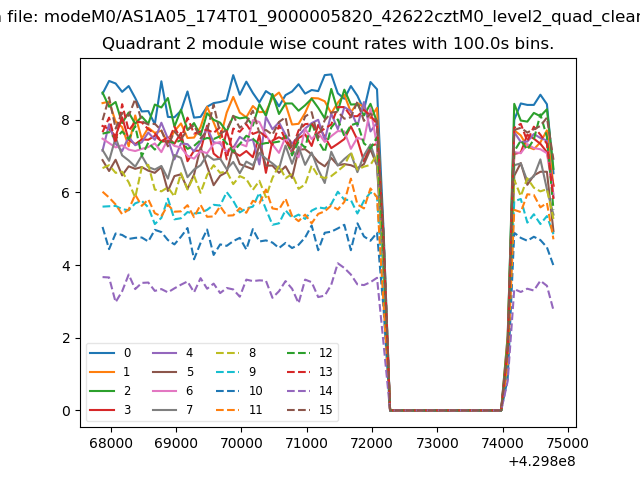
| Quadrant-wise count rates Data is divided into 100 sec bins |
 |
|
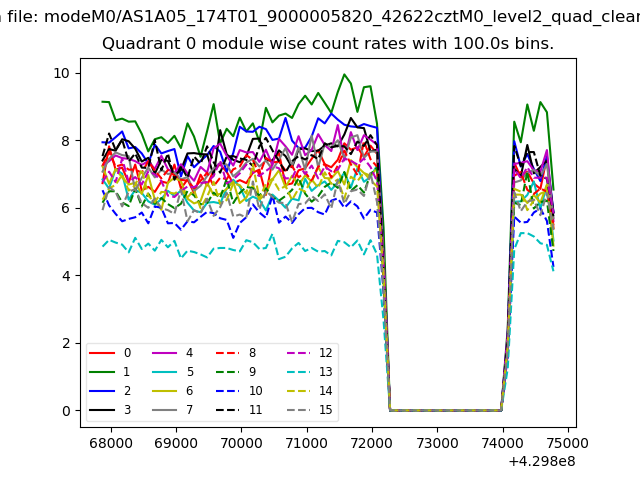
| Module-wise count rates for Quadrant A Data is divided into 100 sec bins |
 |
 |
| Module-wise count rates for Quadrant B Data is divided into 100 sec bins |
 |
 |
| Module-wise count rates for Quadrant C Data is divided into 100 sec bins |
 |
 |
| Module-wise count rates for Quadrant D Data is divided into 100 sec bins |
 |
 |
| Parameter | Plot |
|---|---|
| CZT HV Monitor | 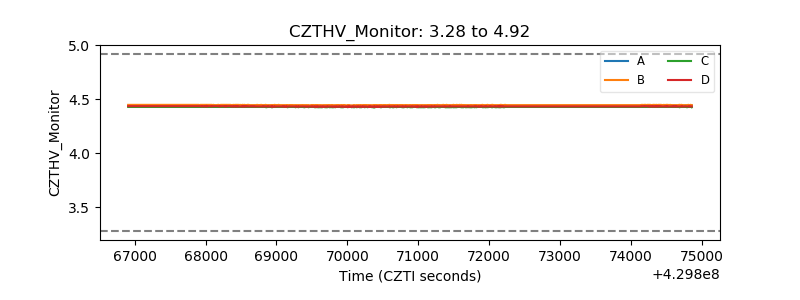 |
| D_VDD | 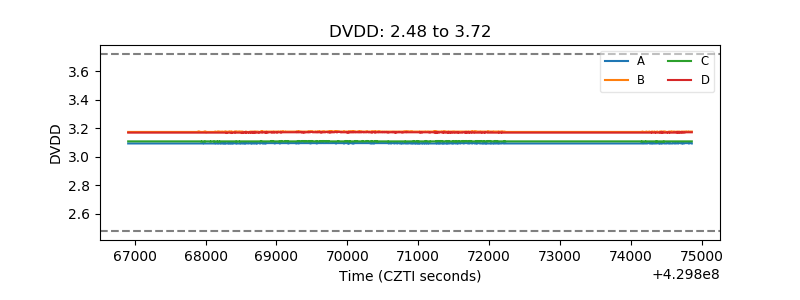 |
| Temperature 1 | 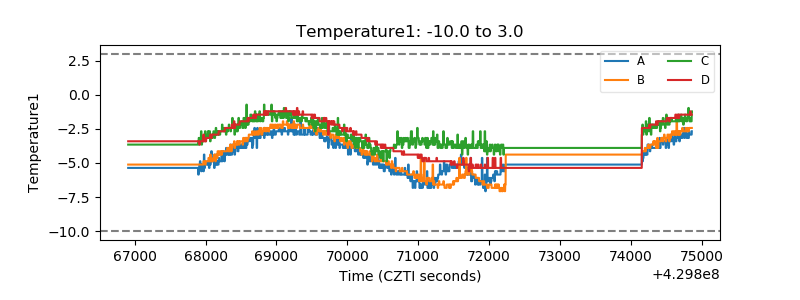 |
| Veto HV Monitor | 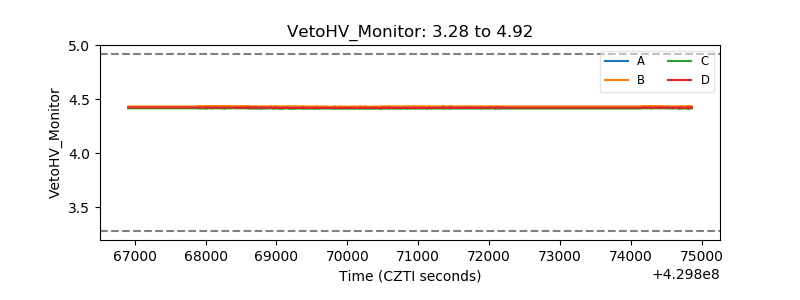 |
| Veto LLD | 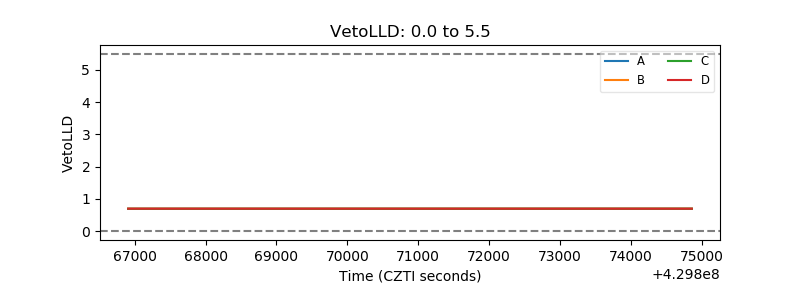 |
| Alpha Counter | 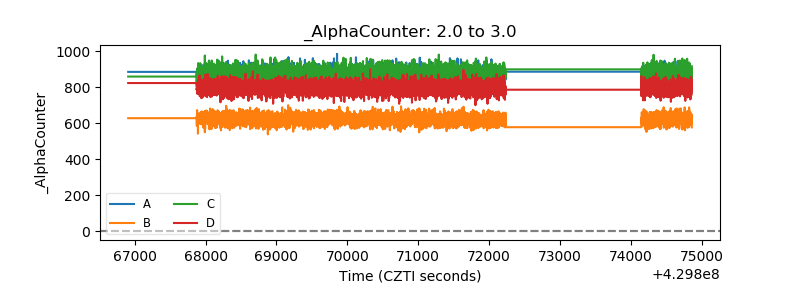 |
| _CPM_Rate | 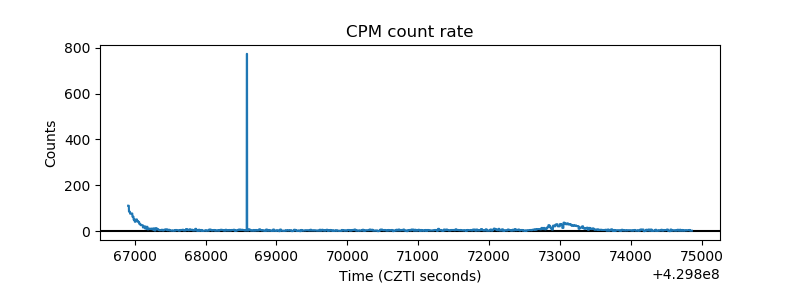 |
| CZT Counter |  |
| +2.5 Volts monitor | 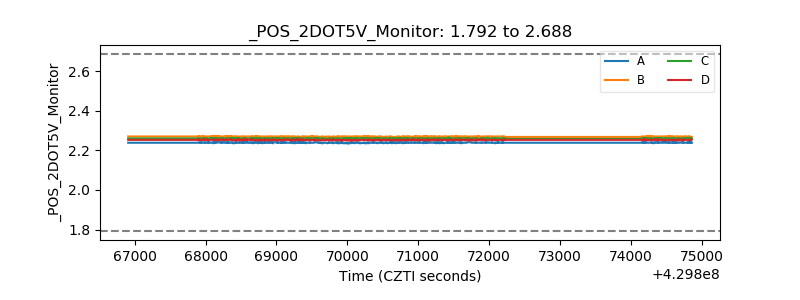 |
| +5 Volts monitor | 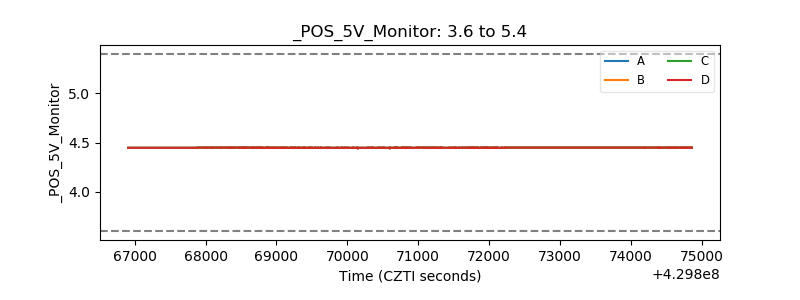 |
| _ROLL_ROT |  |
| _Roll_DEC | 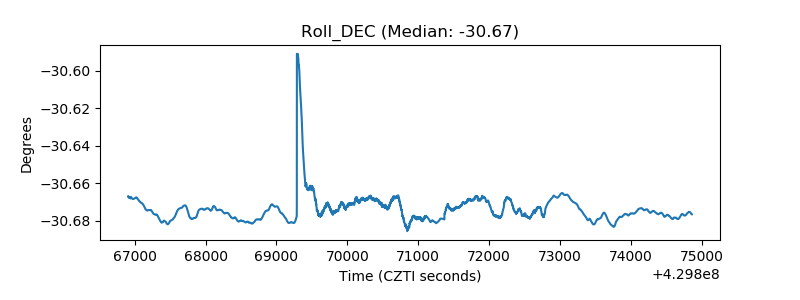 |
| _Roll_RA | 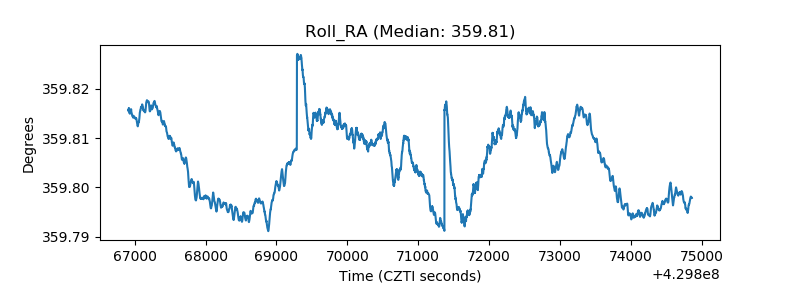 |
| Veto Counter | 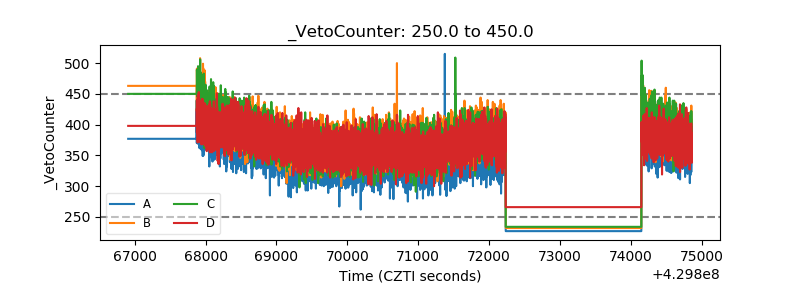 |