| Param | Original file | Final file |
|---|---|---|
| Filename | modeM0/AS1A05_174T01_9000005820_42623cztM0_level2.fits | modeM0/AS1A05_174T01_9000005820_42623cztM0_level2_quad_clean.evt |
| Size (bytes) | 333,495,360 | 93,781,440 |
| Size | 318.0 MB | 89.4 MB |
| Events in quadrant A | 3,042,565 | 624,104 |
| Events in quadrant B | 2,577,202 | 636,511 |
| Events in quadrant C | 2,831,930 | 615,944 |
| Events in quadrant D | 3,447,344 | 563,030 |
| Mode M9 | |||
|---|---|---|---|
| Quadrant | BADHDUFLAG | Total packets | Discarded packets |
| A | 0 | 29 | 0 |
| B | 0 | 30 | 0 |
| C | 0 | 30 | 0 |
| D | 0 | 30 | 0 |
| Mode SS | |||
|---|---|---|---|
| Quadrant | BADHDUFLAG | Total packets | Discarded packets |
| A | 0 | 116 | 0 |
| B | 0 | 116 | 0 |
| C | 0 | 116 | 0 |
| D | 0 | 116 | 0 |
| Mode M0 | |||
|---|---|---|---|
| Quadrant | BADHDUFLAG | Total packets | Discarded packets |
| A | 0 | 12406 | 2 |
| B | 0 | 11573 | 2 |
| C | 0 | 11956 | 2 |
| D | 0 | 14238 | 2 |
| Quadrant | Total seconds | Saturated seconds | Saturation percentage |
|---|---|---|---|
| A | 5722 | 19 | 0.332052% |
| B | 5722 | 11 | 0.192240% |
| C | 5722 | 20 | 0.349528% |
| D | 5722 | 124 | 2.167074% |
Noise dominated data is calculated using 1-second bins in cleaned event files. If a bin has >2000 counts, and if more than 50% of those come from <1% of pixels, then it is considered to be noise-dominated and hence unusable.
| Quadrant | # 1 sec bins | Bins with >0 counts | Bins with >2000 counts | High rate bins dominated by noise | Noise dominated (total time) | Noise dominated (detector-on time) | Marked lightcurve |
|---|---|---|---|---|---|---|---|
| A | 7245 | 5723 | 1 | 1 | 0.01% | 0.02% | 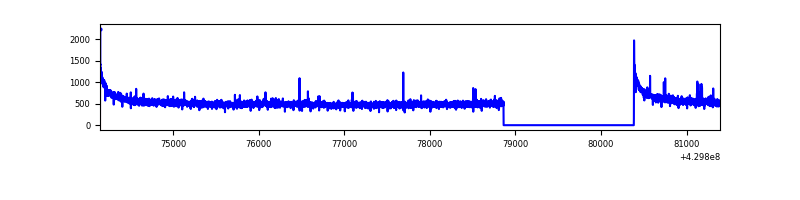 |
| B | 7245 | 5723 | 0 | 0 | 0.00% | 0.00% | 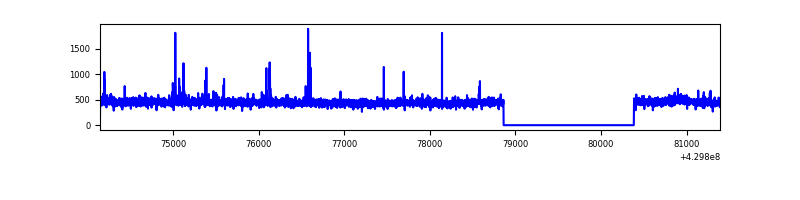 |
| C | 7245 | 5723 | 11 | 11 | 0.15% | 0.19% | 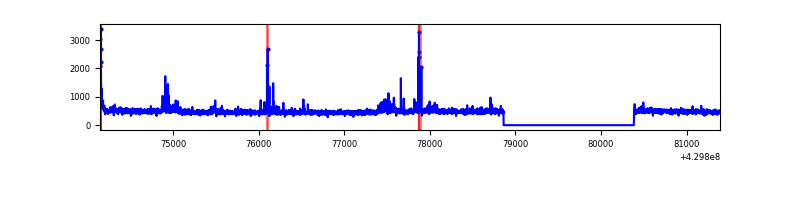 |
| D | 7245 | 5723 | 106 | 106 | 1.46% | 1.85% | 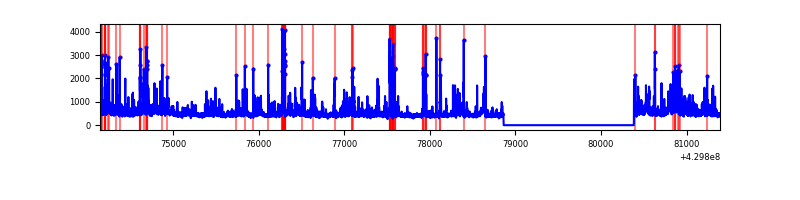 |
Top three noisy pixels from each quadrant. If the there are fewer than three noisy pixels in the level2.evt file, extra rows are filled as -1
| Pixel properties | Quadrant properties | ||||||
|---|---|---|---|---|---|---|---|
| Quadrant | DetID | PixID | Counts | Sigma | Mean | Median | Sigma |
| A | 10 | 83 | 578237 | 4392.79 | 630 | 615 | 131.5 |
| A | 2 | 79 | 12126 | 87.54 | 630 | 615 | 131.5 |
| A | 13 | 248 | 8032 | 56.41 | 630 | 615 | 131.5 |
| B | 7 | 202 | 46417 | 376.52 | 626 | 608 | 121.7 |
| B | 0 | 245 | 37884 | 306.38 | 626 | 608 | 121.7 |
| B | 12 | 111 | 15575 | 123.02 | 626 | 608 | 121.7 |
| C | 15 | 214 | 237900 | 1652.12 | 617 | 622 | 143.6 |
| C | 14 | 254 | 148615 | 1030.44 | 617 | 622 | 143.6 |
| C | 3 | 233 | 33776 | 230.84 | 617 | 622 | 143.6 |
| D | 1 | 52 | 356065 | 2323.42 | 614 | 595 | 153.0 |
| D | 2 | 249 | 258252 | 1684.09 | 614 | 595 | 153.0 |
| D | 12 | 6 | 122962 | 799.81 | 614 | 595 | 153.0 |
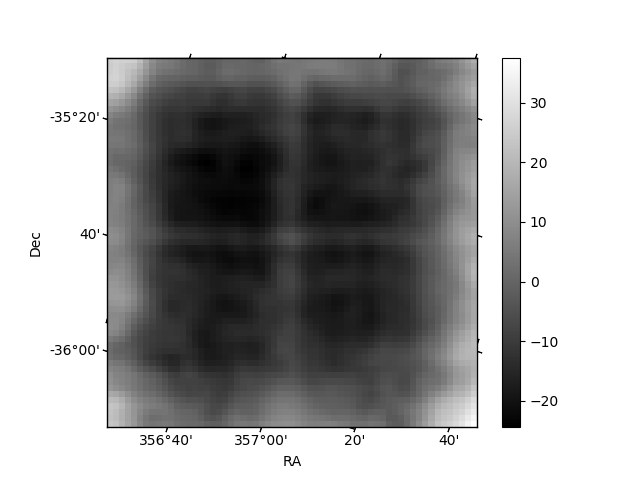
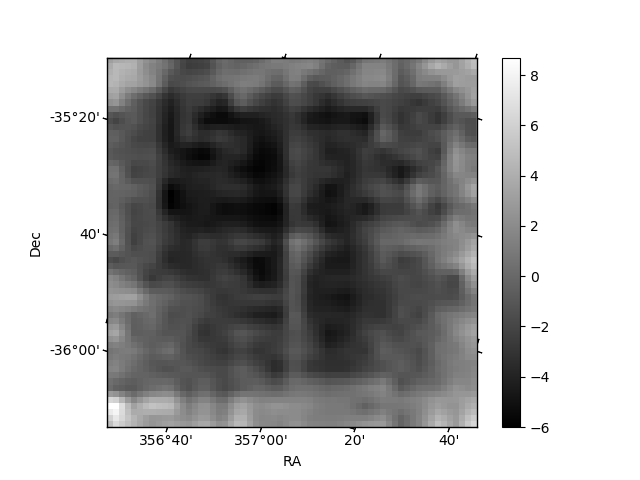
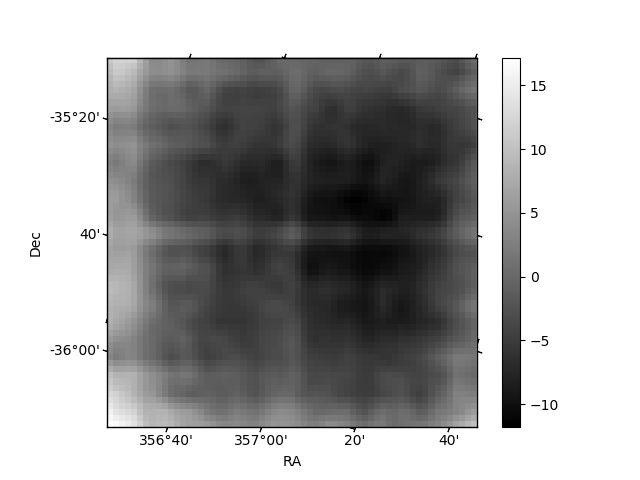
Histogram calculated using DETX and DETY for each event in the final _common_clean file
| Quadrant A | 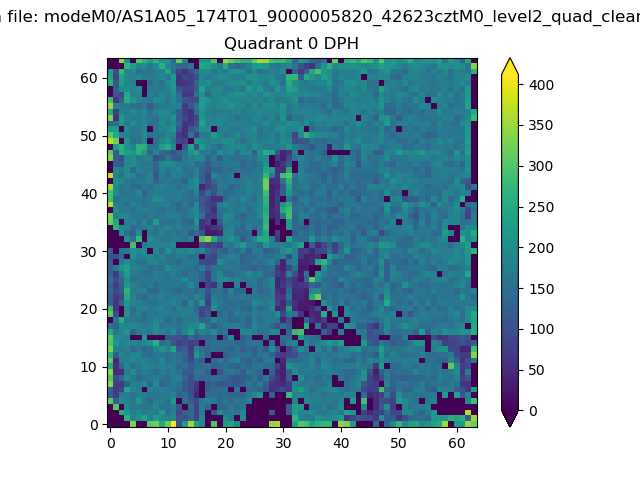 |
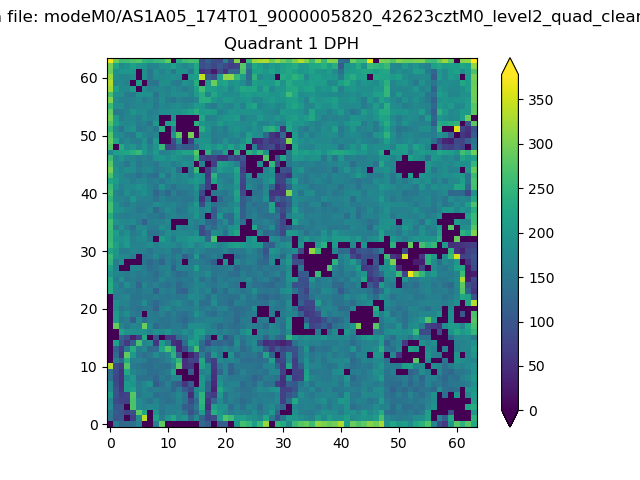 |
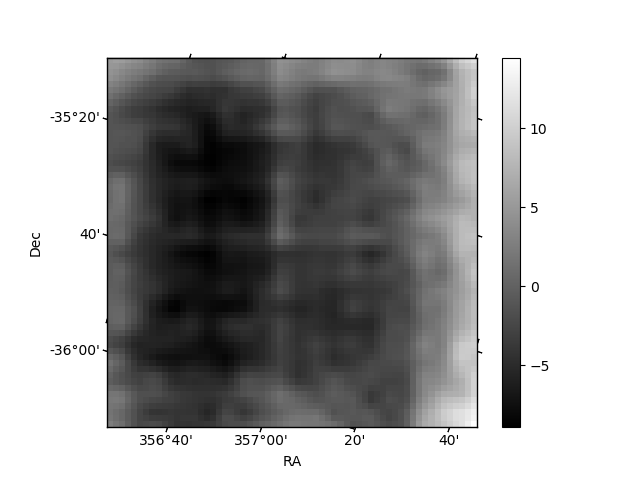
Quadrant B |
|---|---|---|---|
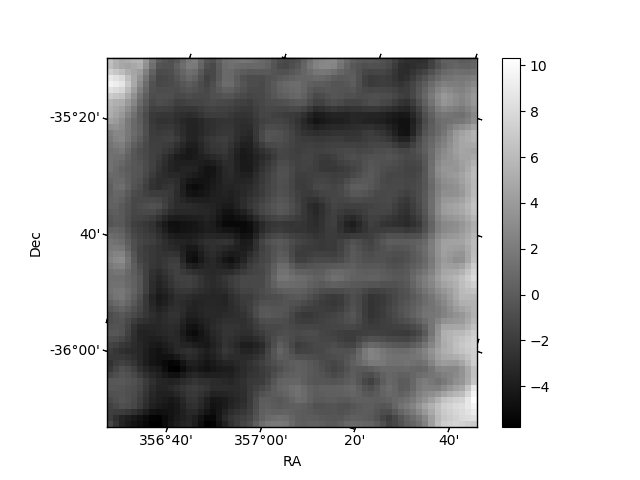
| Quadrant D |  |
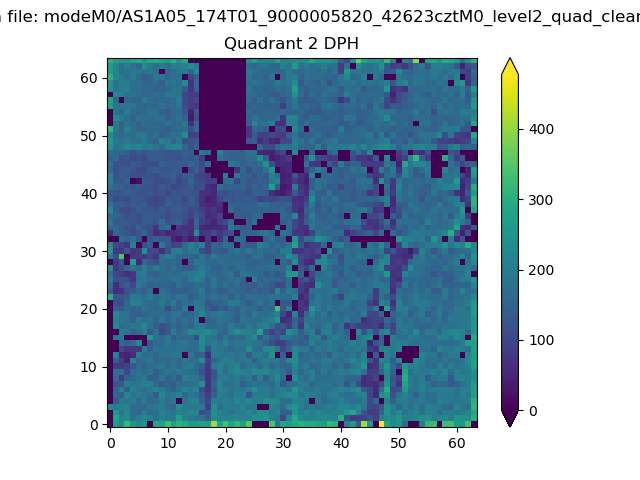 |
Quadrant C |
| Plot type | Count rate plots | Images |
|---|---|---|
| Comparison with Poisson distribution Blue bars denote a histogram of data divided into 1 sec bins. Red curve is a Poisson curve with rate = median count rate of data. |
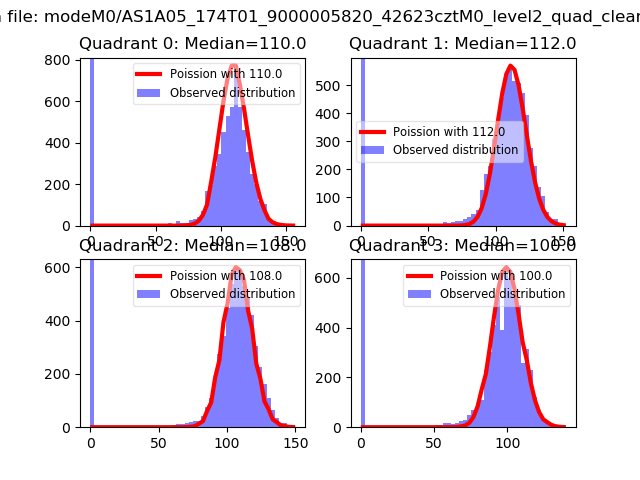 |
 |
| Quadrant-wise count rates Data is divided into 100 sec bins |
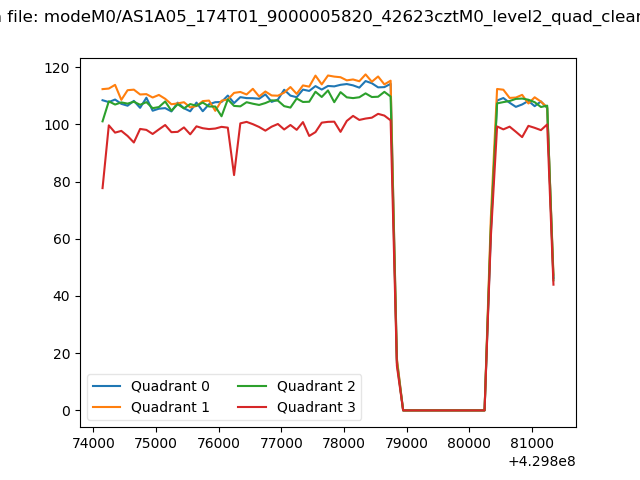 |
|
| Module-wise count rates for Quadrant A Data is divided into 100 sec bins |
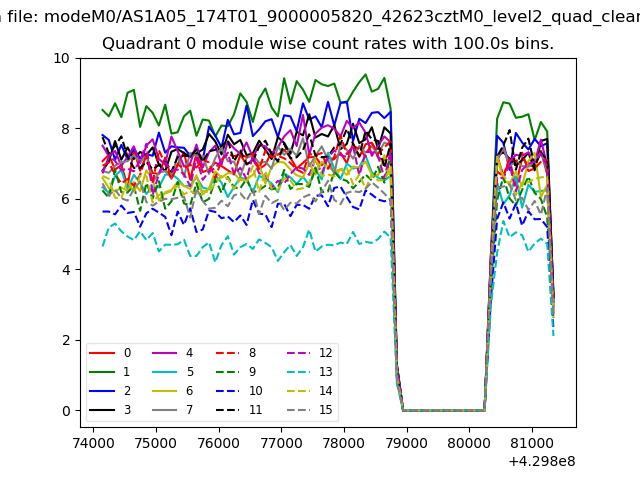 |
 |
| Module-wise count rates for Quadrant B Data is divided into 100 sec bins |
 |
 |
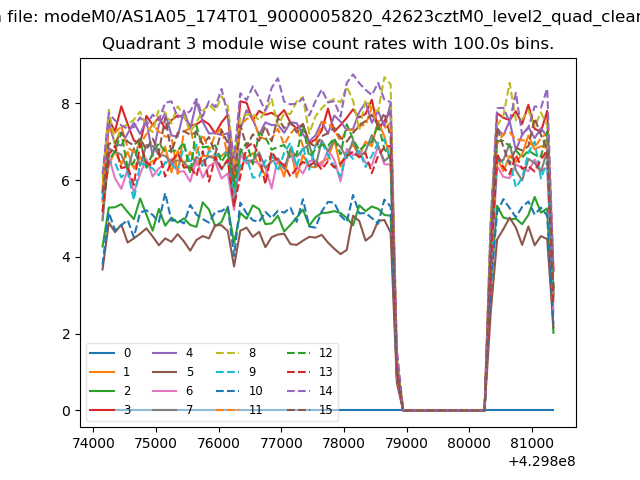
| Module-wise count rates for Quadrant C Data is divided into 100 sec bins |
 |
 |
| Module-wise count rates for Quadrant D Data is divided into 100 sec bins |
 |
 |
| Parameter | Plot |
|---|---|
| CZT HV Monitor |  |
| D_VDD | 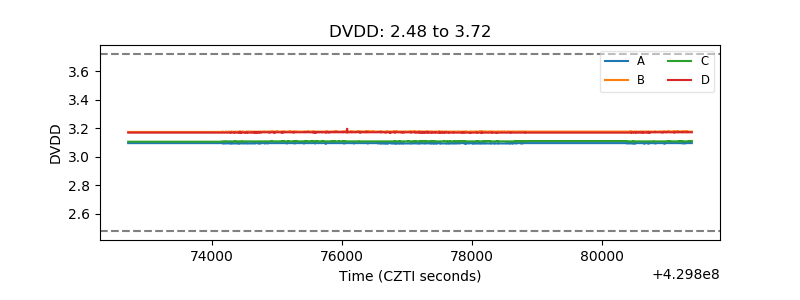 |
| Temperature 1 | 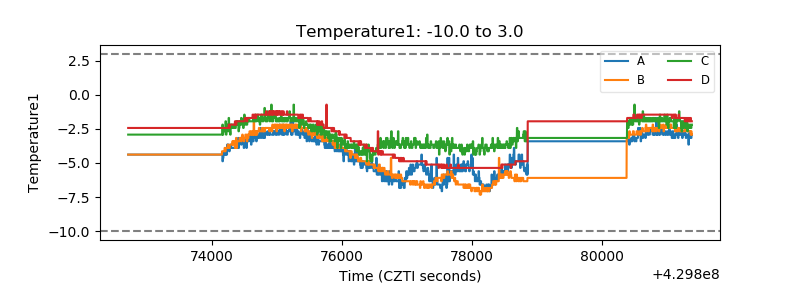 |
| Veto HV Monitor | 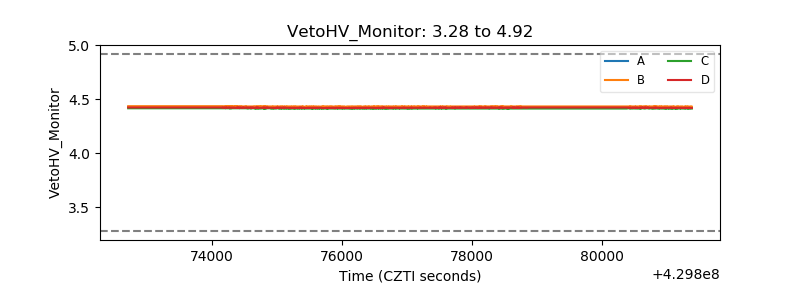 |
| Veto LLD | 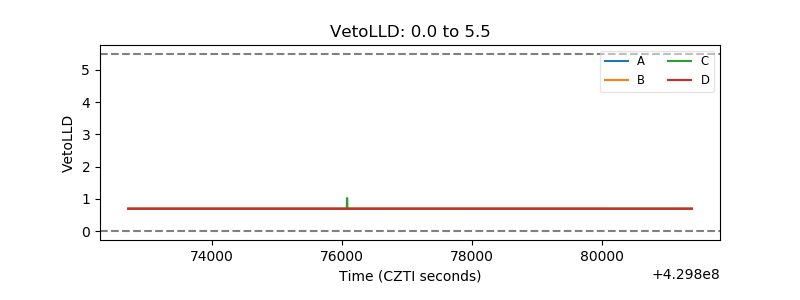 |
| Alpha Counter | 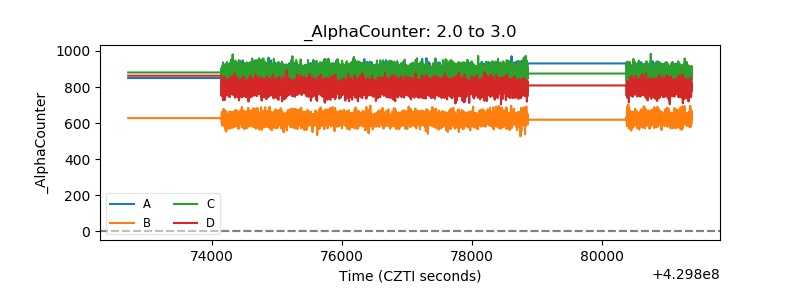 |
| _CPM_Rate | 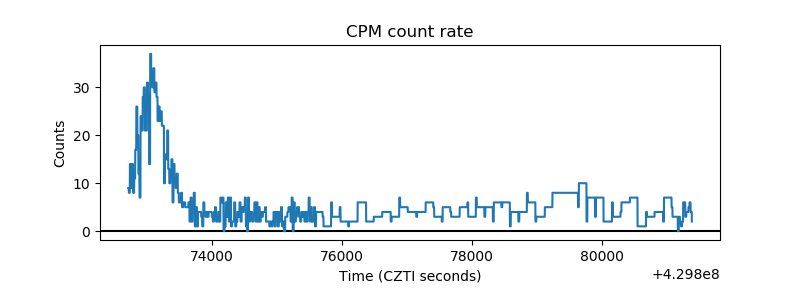 |
| CZT Counter | 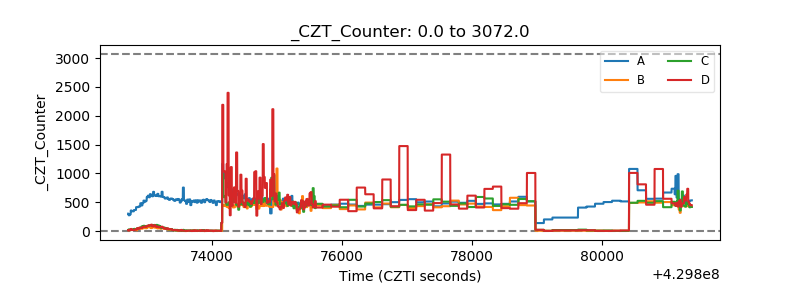 |
| +2.5 Volts monitor | 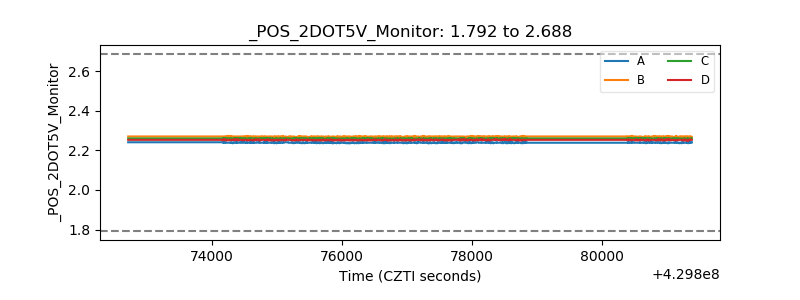 |
| +5 Volts monitor | 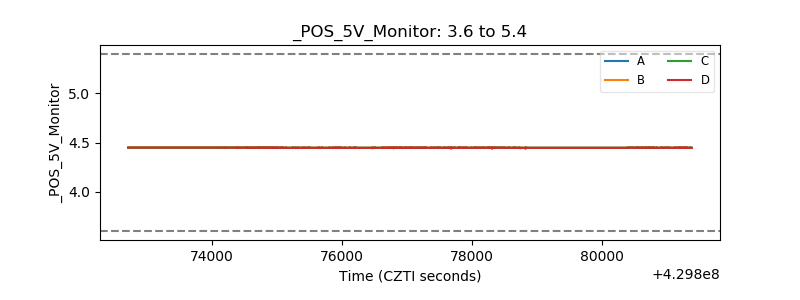 |
| _ROLL_ROT |  |
| _Roll_DEC | 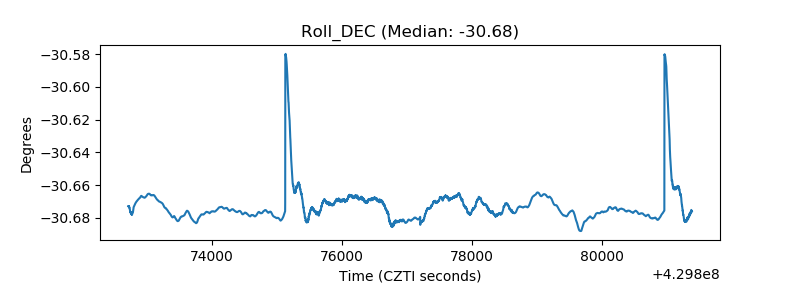 |
| _Roll_RA | 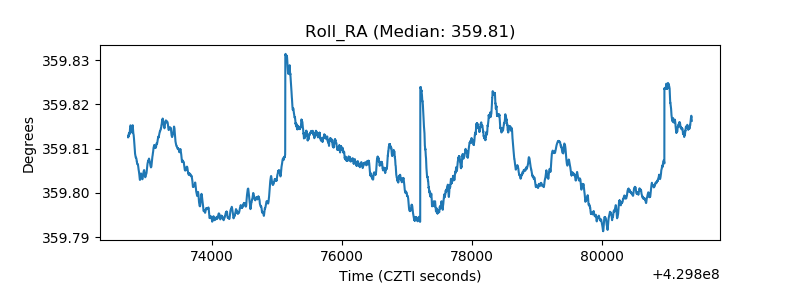 |
| Veto Counter | 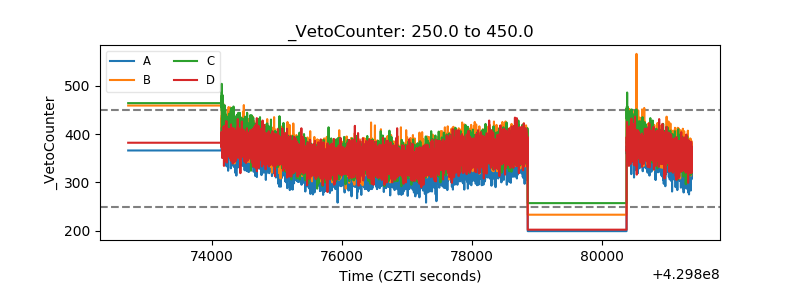 |