| Param | Original file | Final file |
|---|---|---|
| Filename | modeM0/AS1A05_174T01_9000005820_42624cztM0_level2.fits | modeM0/AS1A05_174T01_9000005820_42624cztM0_level2_quad_clean.evt |
| Size (bytes) | 394,577,280 | 103,245,120 |
| Size | 376.3 MB | 98.5 MB |
| Events in quadrant A | 3,538,538 | 690,842 |
| Events in quadrant B | 2,967,959 | 704,720 |
| Events in quadrant C | 3,048,318 | 683,655 |
| Events in quadrant D | 4,551,713 | 598,857 |
| Mode M9 | |||
|---|---|---|---|
| Quadrant | BADHDUFLAG | Total packets | Discarded packets |
| A | 0 | 28 | 0 |
| B | 0 | 28 | 0 |
| C | 0 | 28 | 0 |
| D | 0 | 28 | 0 |
| Mode SS | |||
|---|---|---|---|
| Quadrant | BADHDUFLAG | Total packets | Discarded packets |
| A | 0 | 134 | 0 |
| B | 0 | 134 | 0 |
| C | 0 | 134 | 0 |
| D | 0 | 134 | 0 |
| Mode M0 | |||
|---|---|---|---|
| Quadrant | BADHDUFLAG | Total packets | Discarded packets |
| A | 0 | 14373 | 2 |
| B | 0 | 13264 | 2 |
| C | 0 | 13108 | 2 |
| D | 0 | 18003 | 2 |
| Quadrant | Total seconds | Saturated seconds | Saturation percentage |
|---|---|---|---|
| A | 6417 | 36 | 0.561010% |
| B | 6418 | 25 | 0.389529% |
| C | 6418 | 17 | 0.264880% |
| D | 6418 | 471 | 7.338735% |
Noise dominated data is calculated using 1-second bins in cleaned event files. If a bin has >2000 counts, and if more than 50% of those come from <1% of pixels, then it is considered to be noise-dominated and hence unusable.
| Quadrant | # 1 sec bins | Bins with >0 counts | Bins with >2000 counts | High rate bins dominated by noise | Noise dominated (total time) | Noise dominated (detector-on time) | Marked lightcurve |
|---|---|---|---|---|---|---|---|
| A | 9282 | 6419 | 14 | 14 | 0.15% | 0.22% | 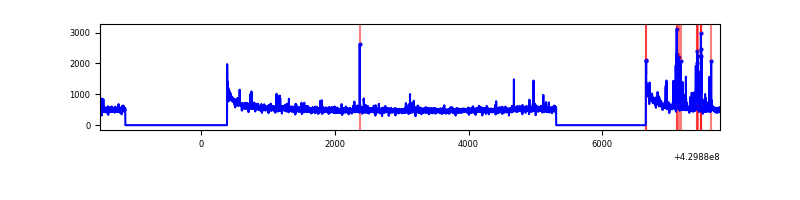 |
| B | 9283 | 6420 | 13 | 13 | 0.14% | 0.20% | 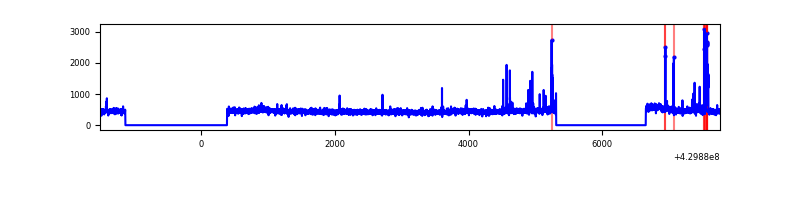 |
| C | 9283 | 6420 | 10 | 10 | 0.11% | 0.16% | 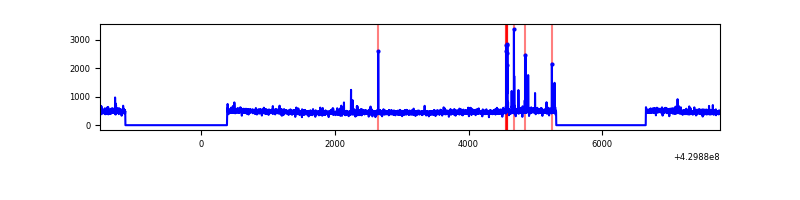 |
| D | 9283 | 6420 | 429 | 429 | 4.62% | 6.68% | 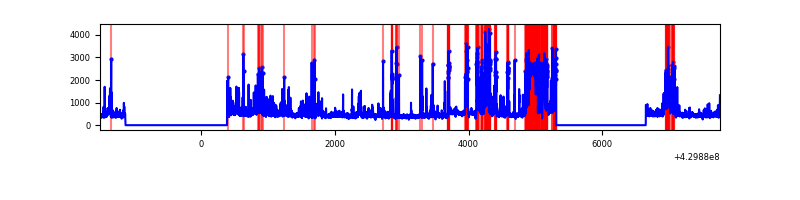 |
Top three noisy pixels from each quadrant. If the there are fewer than three noisy pixels in the level2.evt file, extra rows are filled as -1
| Pixel properties | Quadrant properties | ||||||
|---|---|---|---|---|---|---|---|
| Quadrant | DetID | PixID | Counts | Sigma | Mean | Median | Sigma |
| A | 10 | 83 | 630749 | 4327.01 | 703 | 687 | 145.6 |
| A | 2 | 79 | 164933 | 1127.98 | 703 | 687 | 145.6 |
| A | 13 | 248 | 13449 | 87.64 | 703 | 687 | 145.6 |
| B | 10 | 246 | 83788 | 607.08 | 698 | 677 | 136.9 |
| B | 7 | 202 | 52951 | 381.83 | 698 | 677 | 136.9 |
| B | 5 | 255 | 43303 | 311.36 | 698 | 677 | 136.9 |
| C | 15 | 214 | 266265 | 1651.72 | 690 | 692 | 160.8 |
| C | 14 | 254 | 78451 | 483.62 | 690 | 692 | 160.8 |
| C | 3 | 233 | 6531 | 36.32 | 690 | 692 | 160.8 |
| D | 13 | 249 | 748114 | 4511.28 | 665 | 645 | 165.7 |
| D | 12 | 6 | 469275 | 2828.38 | 665 | 645 | 165.7 |
| D | 2 | 249 | 351284 | 2116.25 | 665 | 645 | 165.7 |
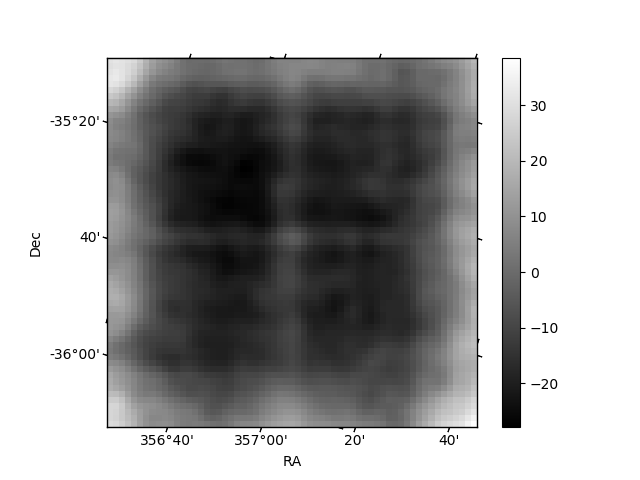
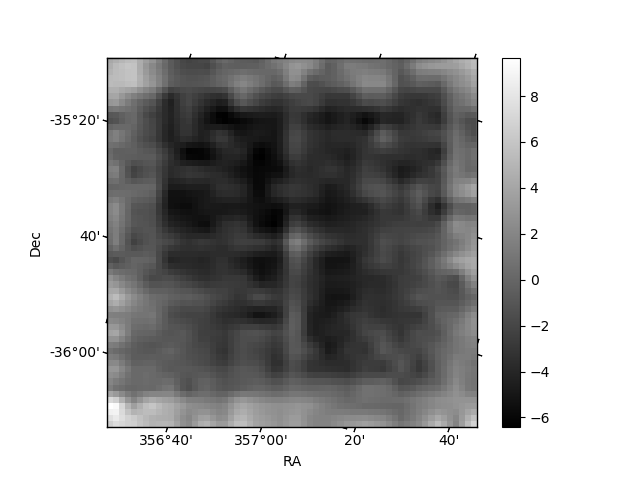
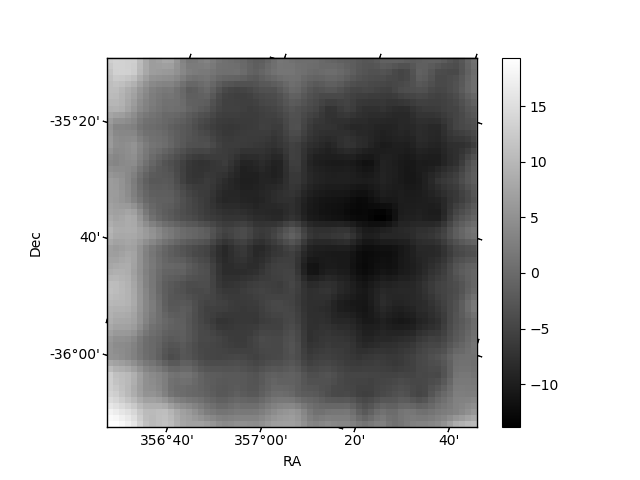
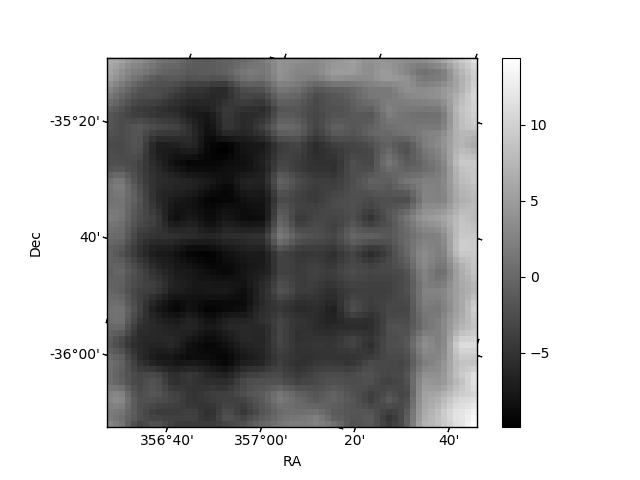
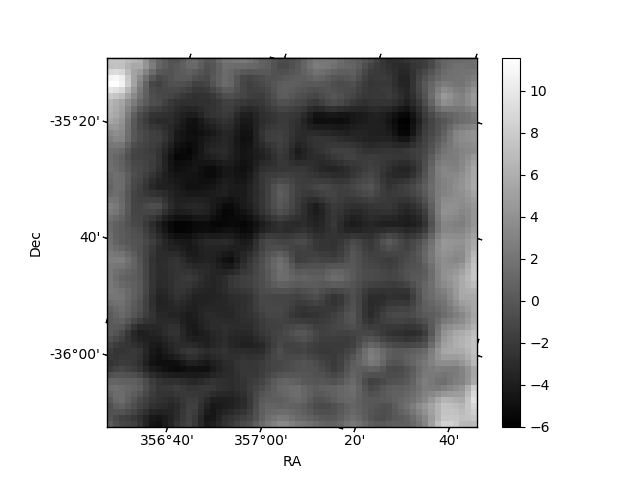
Histogram calculated using DETX and DETY for each event in the final _common_clean file
| Quadrant A | 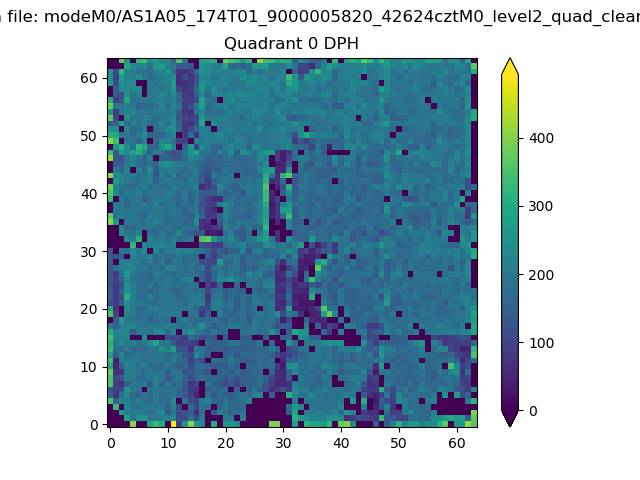 |
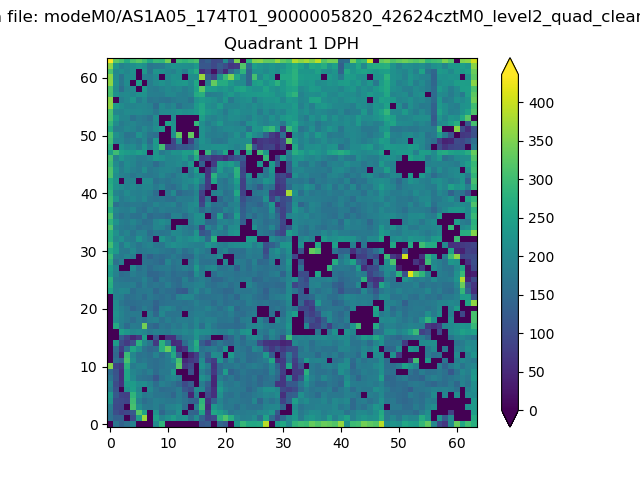 |
Quadrant B |
|---|---|---|---|
| Quadrant D | 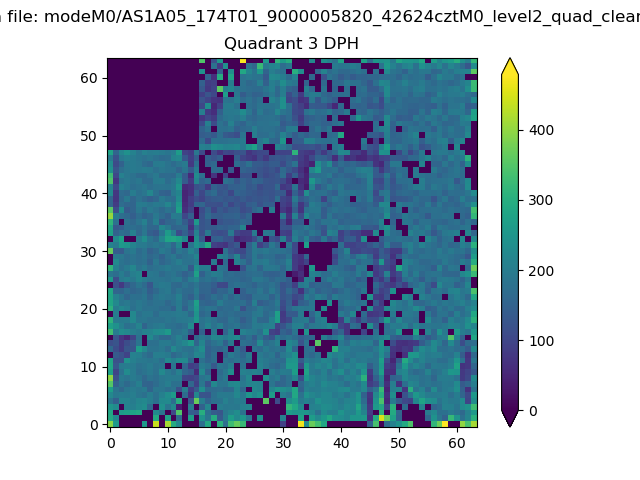 |
 |
Quadrant C |
| Plot type | Count rate plots | Images |
|---|---|---|
| Comparison with Poisson distribution Blue bars denote a histogram of data divided into 1 sec bins. Red curve is a Poisson curve with rate = median count rate of data. |
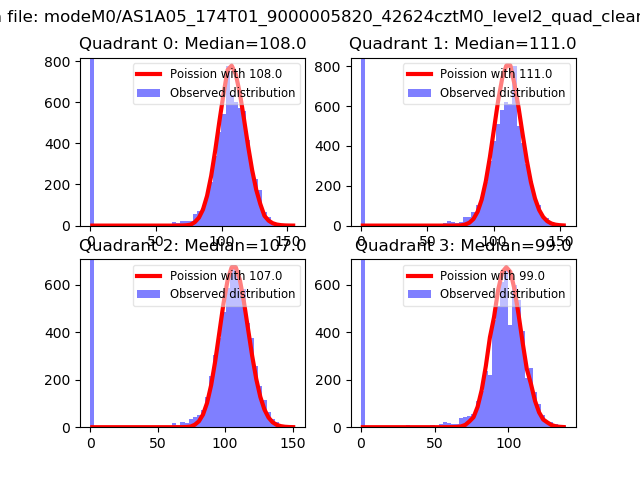 |
 |
| Quadrant-wise count rates Data is divided into 100 sec bins |
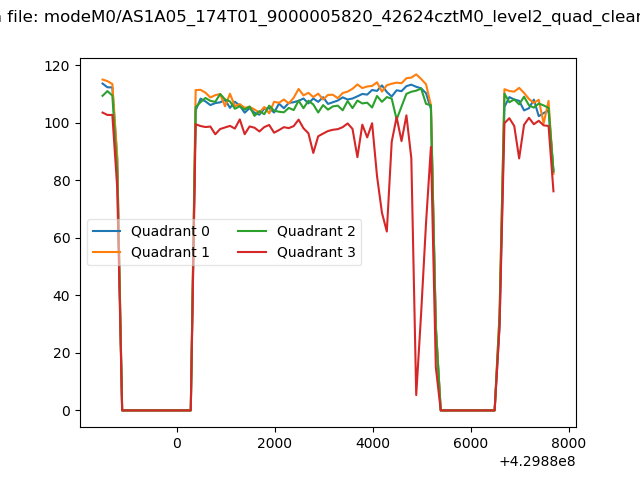 |
|
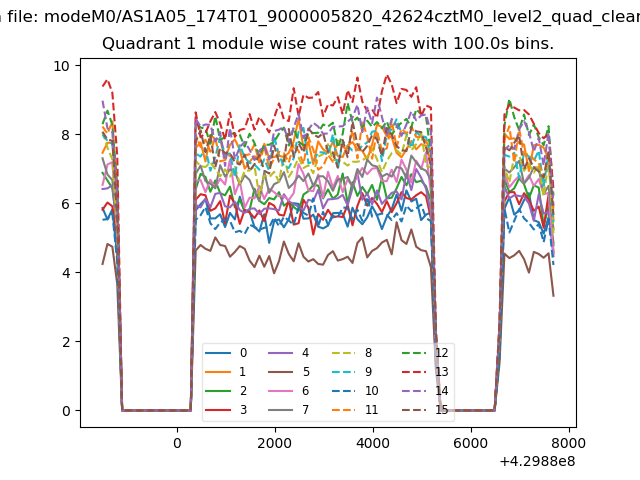
| Module-wise count rates for Quadrant A Data is divided into 100 sec bins |
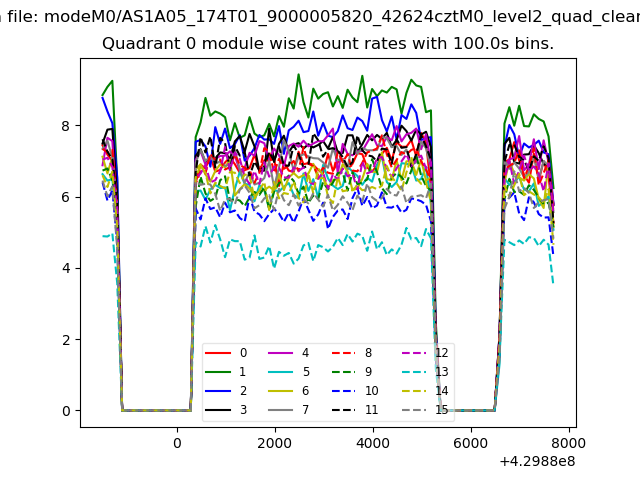 |
 |
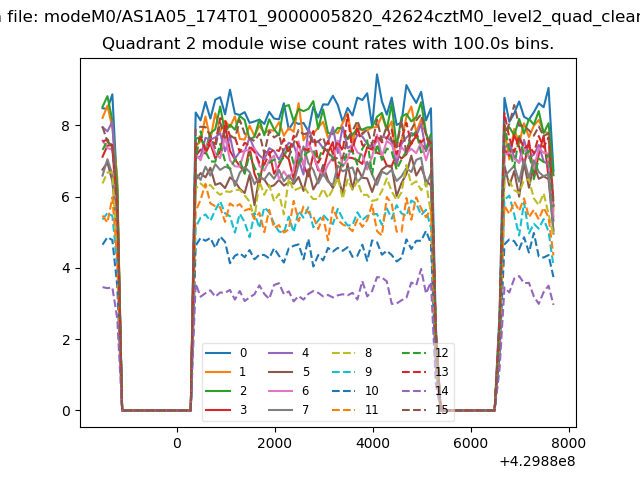
| Module-wise count rates for Quadrant B Data is divided into 100 sec bins |
 |
 |
| Module-wise count rates for Quadrant C Data is divided into 100 sec bins |
 |
 |
| Module-wise count rates for Quadrant D Data is divided into 100 sec bins |
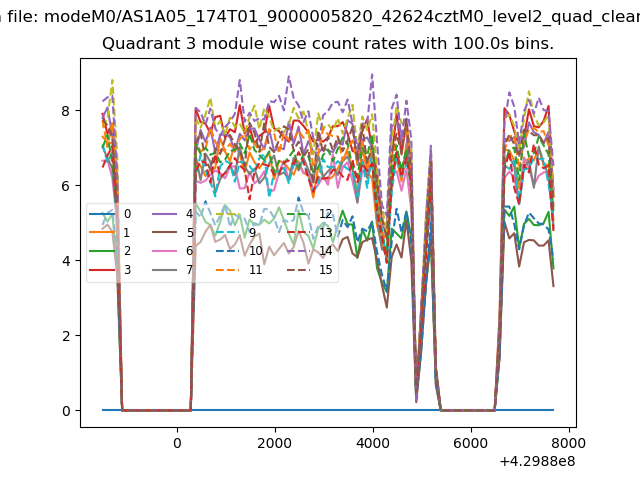 |
 |
| Parameter | Plot |
|---|---|
| CZT HV Monitor |  |
| D_VDD | 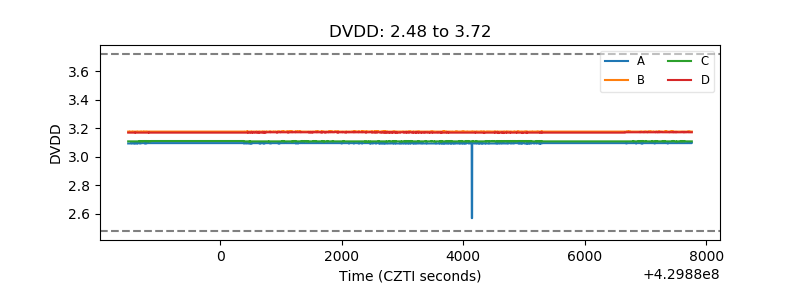 |
| Temperature 1 | 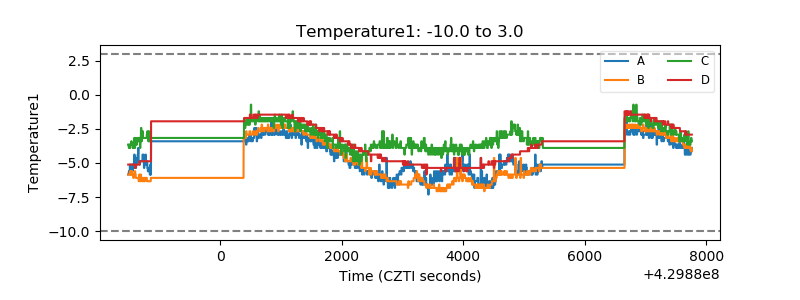 |
| Veto HV Monitor | 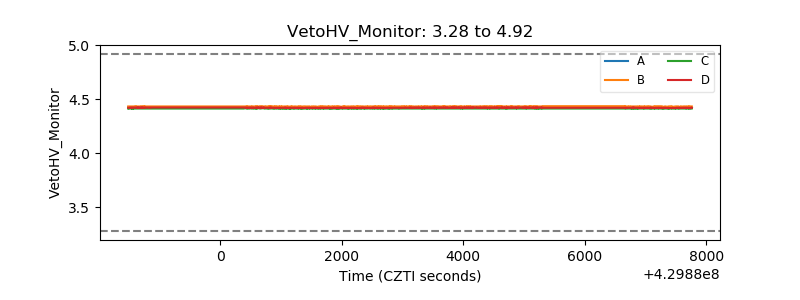 |
| Veto LLD | 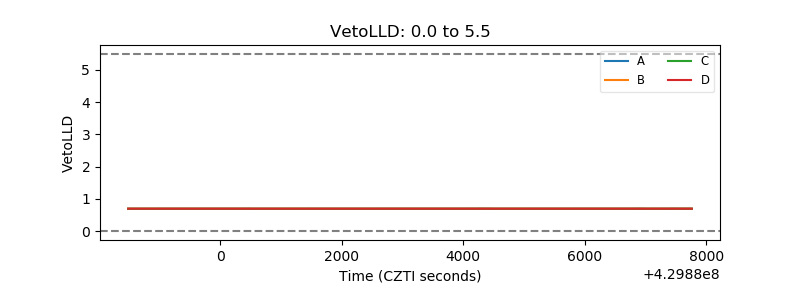 |
| Alpha Counter | 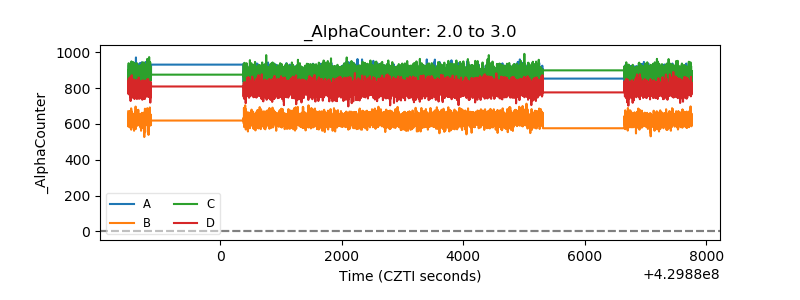 |
| _CPM_Rate | 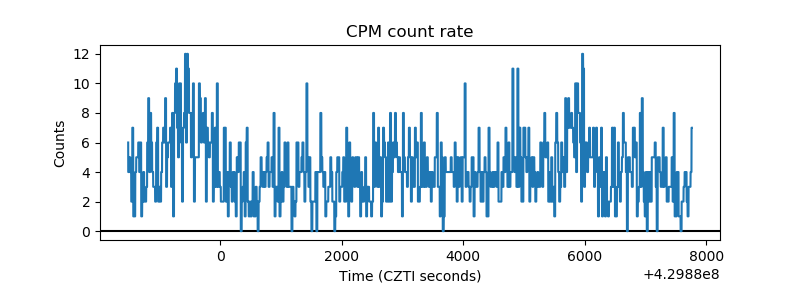 |
| CZT Counter | 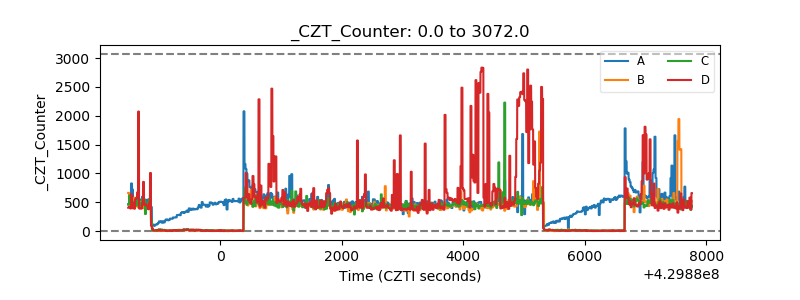 |
| +2.5 Volts monitor | 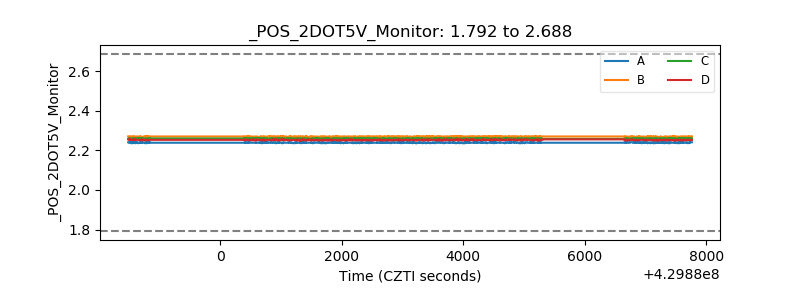 |
| +5 Volts monitor | 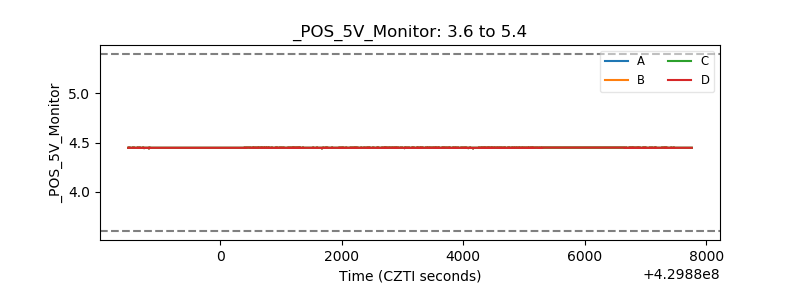 |
| _ROLL_ROT | 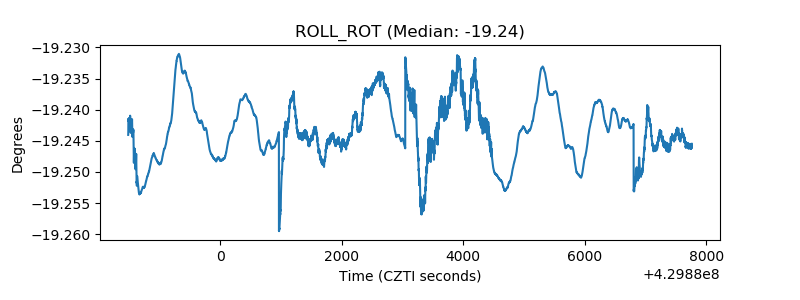 |
| _Roll_DEC | 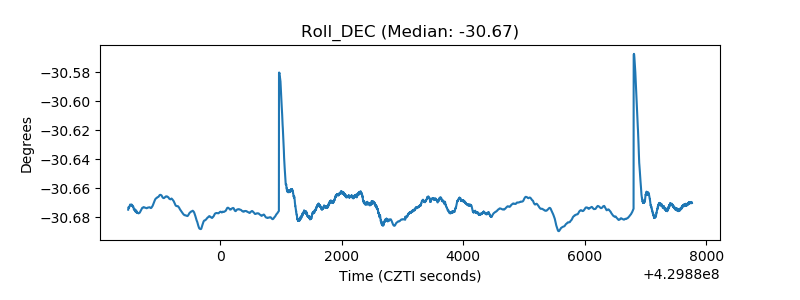 |
| _Roll_RA | 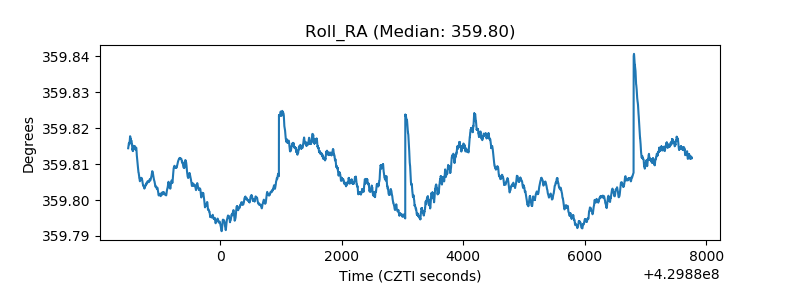 |
| Veto Counter | 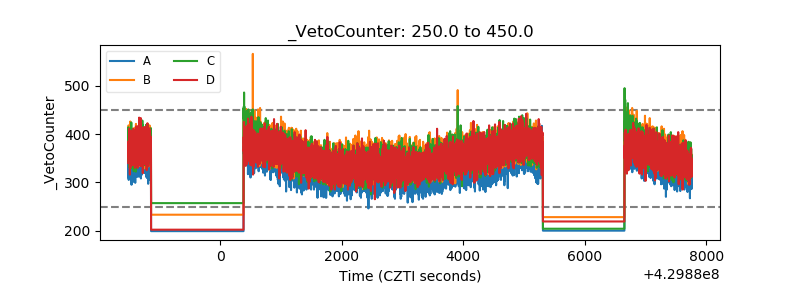 |