| Param | Original file | Final file |
|---|---|---|
| Filename | modeM0/AS1A05_174T01_9000005820_42625cztM0_level2.fits | modeM0/AS1A05_174T01_9000005820_42625cztM0_level2_quad_clean.evt |
| Size (bytes) | 368,475,840 | 96,589,440 |
| Size | 351.4 MB | 92.1 MB |
| Events in quadrant A | 3,427,335 | 644,796 |
| Events in quadrant B | 2,784,055 | 656,611 |
| Events in quadrant C | 2,957,716 | 633,991 |
| Events in quadrant D | 4,004,274 | 570,189 |
| Mode M9 | |||
|---|---|---|---|
| Quadrant | BADHDUFLAG | Total packets | Discarded packets |
| A | 0 | 26 | 0 |
| B | 0 | 26 | 0 |
| C | 0 | 26 | 0 |
| D | 0 | 26 | 0 |
| Mode SS | |||
|---|---|---|---|
| Quadrant | BADHDUFLAG | Total packets | Discarded packets |
| A | 0 | 126 | 0 |
| B | 0 | 126 | 0 |
| C | 0 | 126 | 0 |
| D | 0 | 126 | 0 |
| Mode M0 | |||
|---|---|---|---|
| Quadrant | BADHDUFLAG | Total packets | Discarded packets |
| A | 0 | 13864 | 3 |
| B | 0 | 12354 | 2 |
| C | 0 | 12578 | 2 |
| D | 0 | 16121 | 2 |
| Quadrant | Total seconds | Saturated seconds | Saturation percentage |
|---|---|---|---|
| A | 5991 | 34 | 0.567518% |
| B | 5991 | 21 | 0.350526% |
| C | 5991 | 31 | 0.517443% |
| D | 5991 | 242 | 4.039392% |
Noise dominated data is calculated using 1-second bins in cleaned event files. If a bin has >2000 counts, and if more than 50% of those come from <1% of pixels, then it is considered to be noise-dominated and hence unusable.
| Quadrant | # 1 sec bins | Bins with >0 counts | Bins with >2000 counts | High rate bins dominated by noise | Noise dominated (total time) | Noise dominated (detector-on time) | Marked lightcurve |
|---|---|---|---|---|---|---|---|
| A | 8645 | 5993 | 23 | 23 | 0.27% | 0.38% | 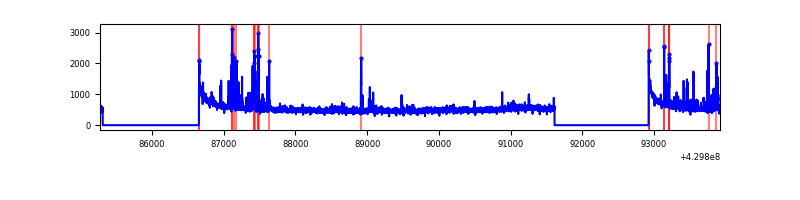 |
| B | 8645 | 5993 | 13 | 13 | 0.15% | 0.22% | 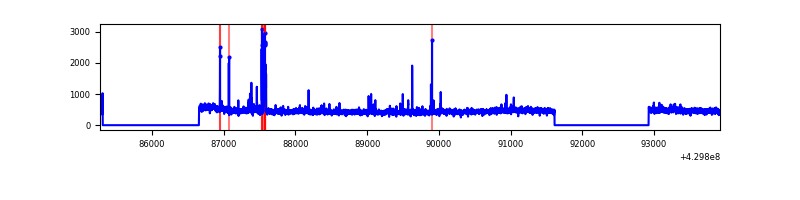 |
| C | 8645 | 5993 | 22 | 22 | 0.25% | 0.37% | 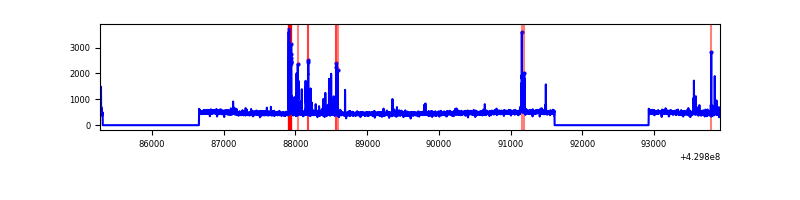 |
| D | 8645 | 5993 | 219 | 219 | 2.53% | 3.65% | 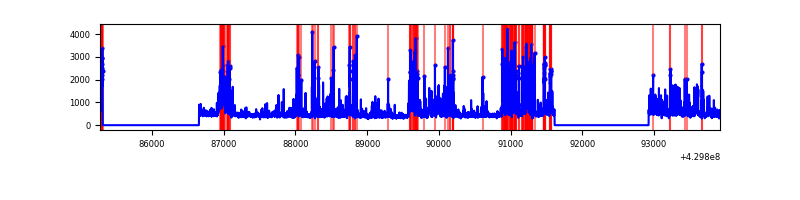 |
Top three noisy pixels from each quadrant. If the there are fewer than three noisy pixels in the level2.evt file, extra rows are filled as -1
| Pixel properties | Quadrant properties | ||||||
|---|---|---|---|---|---|---|---|
| Quadrant | DetID | PixID | Counts | Sigma | Mean | Median | Sigma |
| A | 10 | 83 | 611066 | 4494.35 | 655 | 640 | 135.8 |
| A | 2 | 79 | 268667 | 1973.39 | 655 | 640 | 135.8 |
| A | 15 | 222 | 12650 | 88.43 | 655 | 640 | 135.8 |
| B | 10 | 246 | 88387 | 686.52 | 650 | 630 | 127.8 |
| B | 7 | 202 | 57977 | 448.63 | 650 | 630 | 127.8 |
| B | 0 | 168 | 36190 | 278.19 | 650 | 630 | 127.8 |
| C | 15 | 214 | 247715 | 1636.53 | 641 | 645 | 151.0 |
| C | 14 | 254 | 194834 | 1286.26 | 641 | 645 | 151.0 |
| C | 4 | 254 | 5098 | 29.5 | 641 | 645 | 151.0 |
| D | 2 | 249 | 591404 | 3771.88 | 631 | 613 | 156.6 |
| D | 13 | 249 | 559896 | 3570.72 | 631 | 613 | 156.6 |
| D | 1 | 52 | 124266 | 789.46 | 631 | 613 | 156.6 |
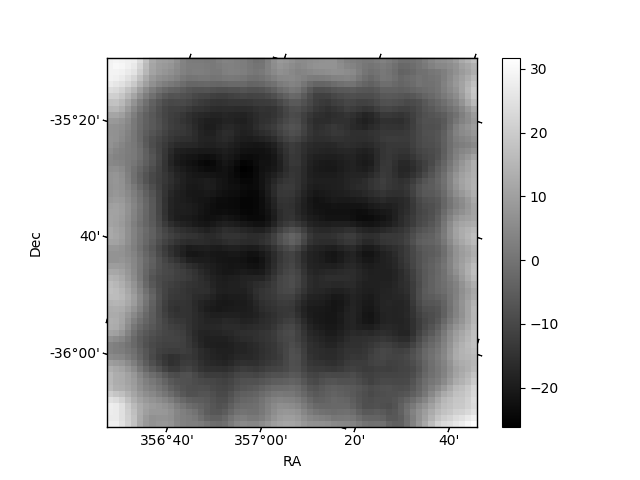
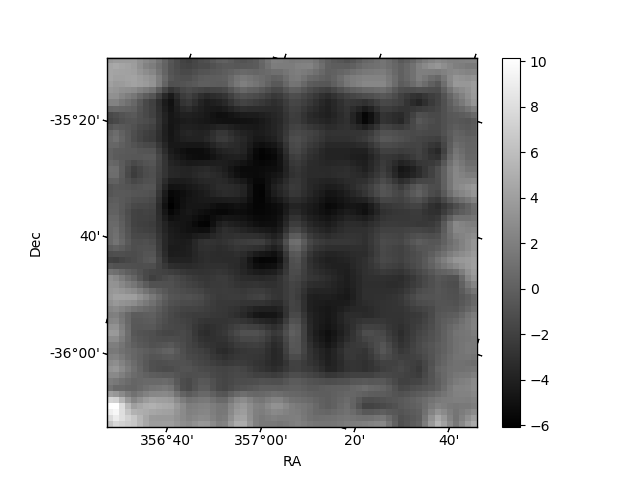
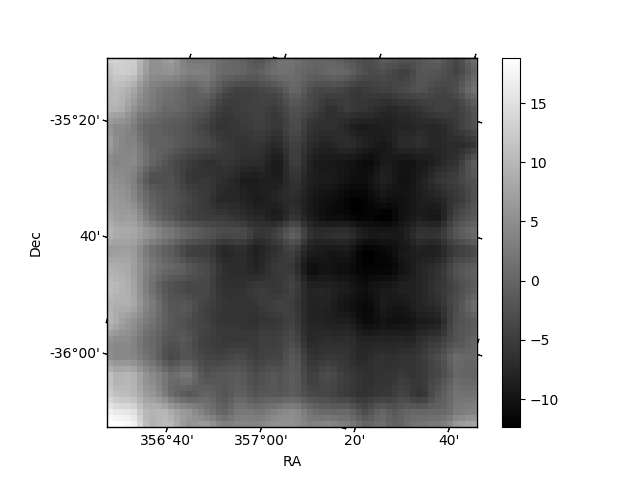
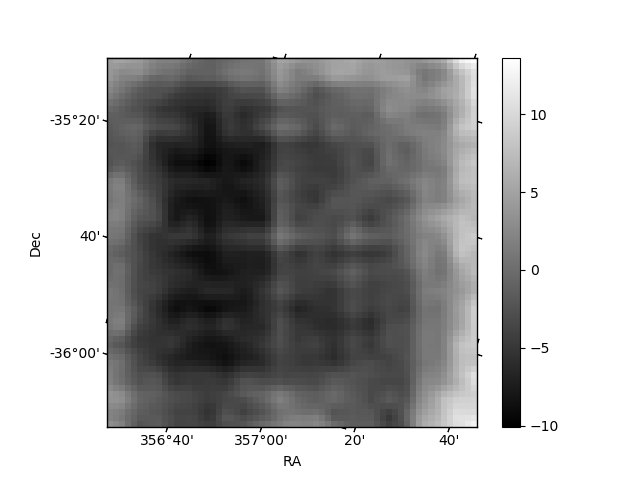
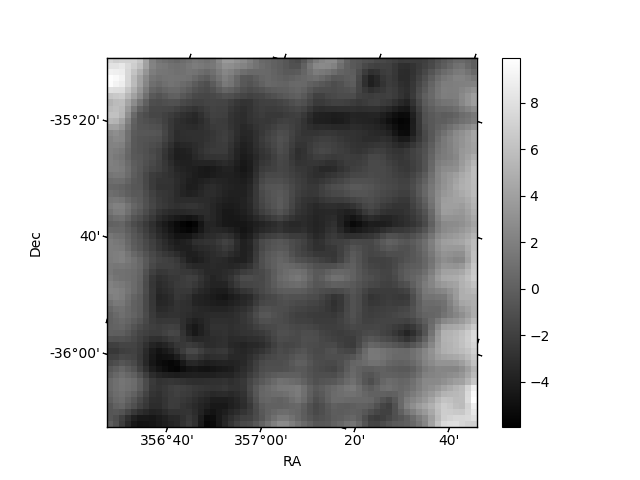
Histogram calculated using DETX and DETY for each event in the final _common_clean file
| Quadrant A | 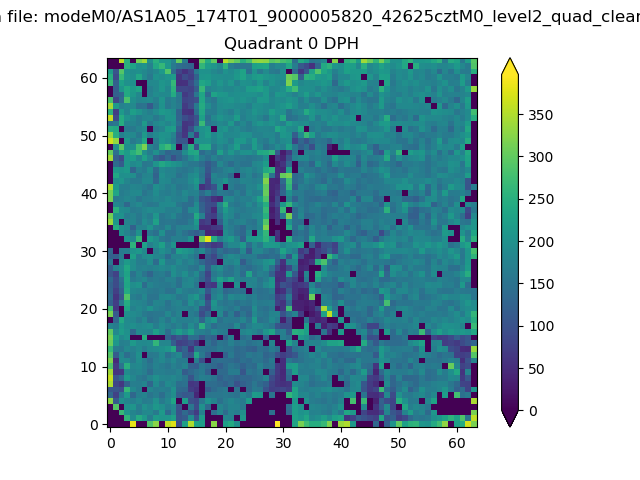 |
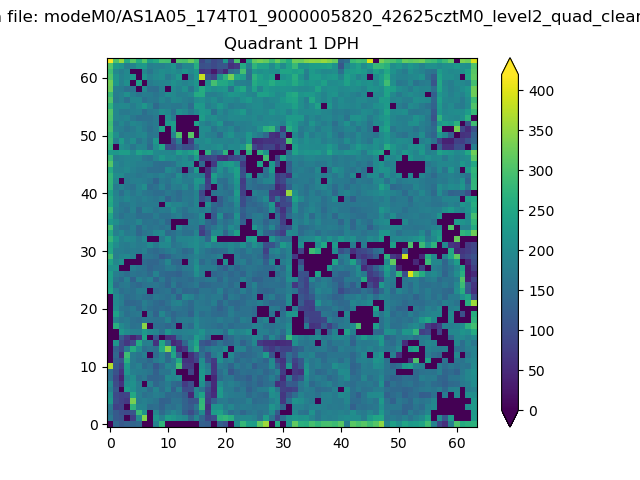 |
Quadrant B |
|---|---|---|---|
| Quadrant D |  |
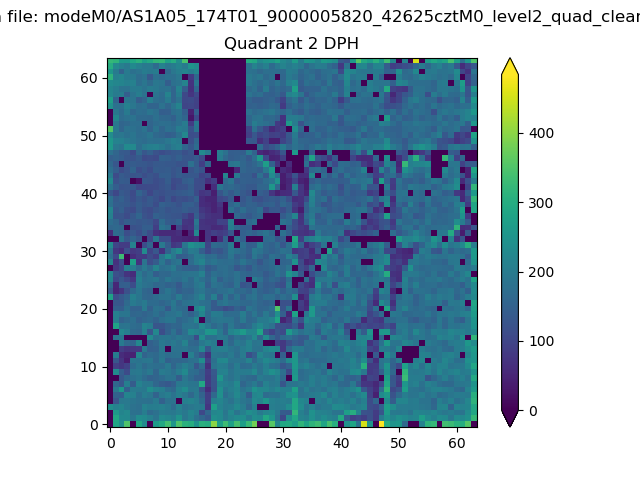 |
Quadrant C |
| Plot type | Count rate plots | Images |
|---|---|---|
| Comparison with Poisson distribution Blue bars denote a histogram of data divided into 1 sec bins. Red curve is a Poisson curve with rate = median count rate of data. |
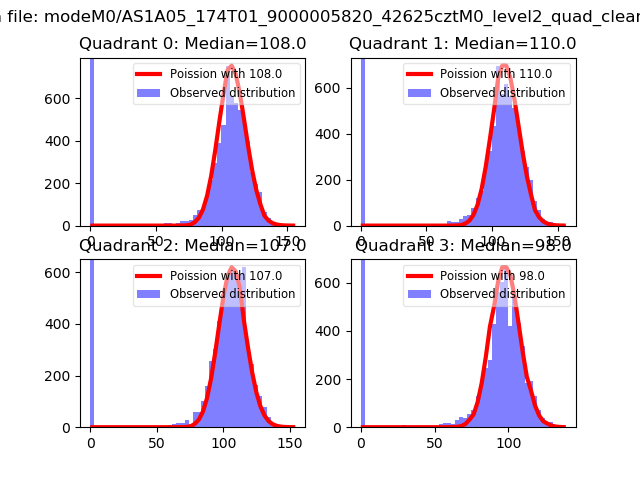 |
 |
| Quadrant-wise count rates Data is divided into 100 sec bins |
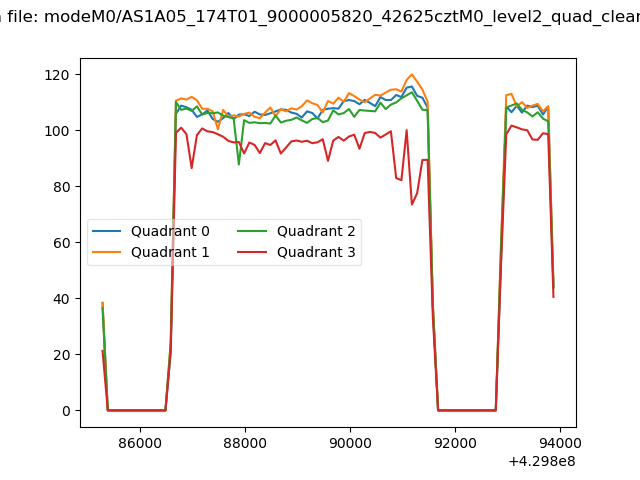 |
|
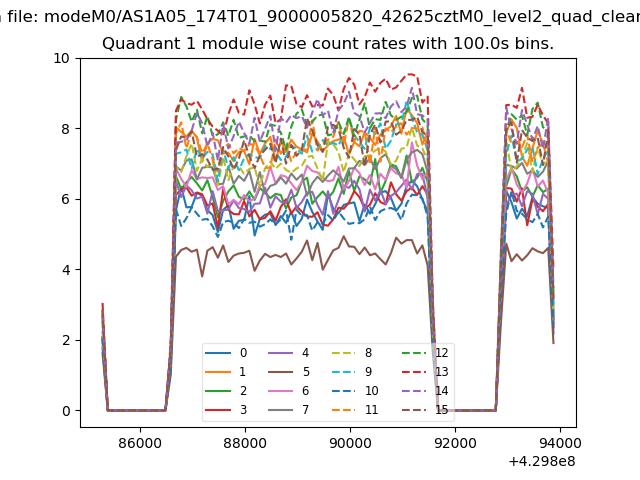
| Module-wise count rates for Quadrant A Data is divided into 100 sec bins |
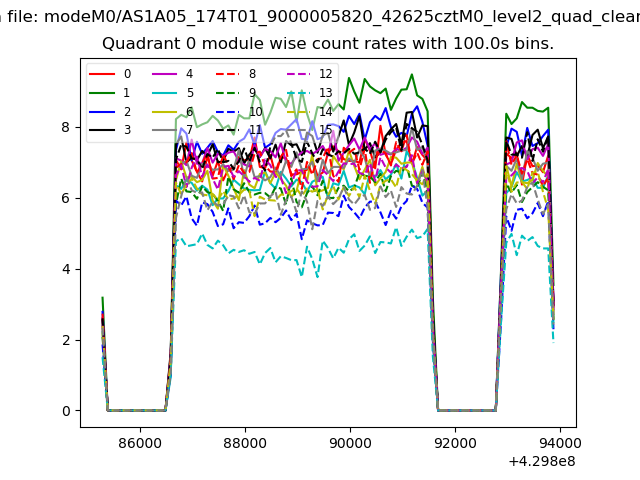 |
 |
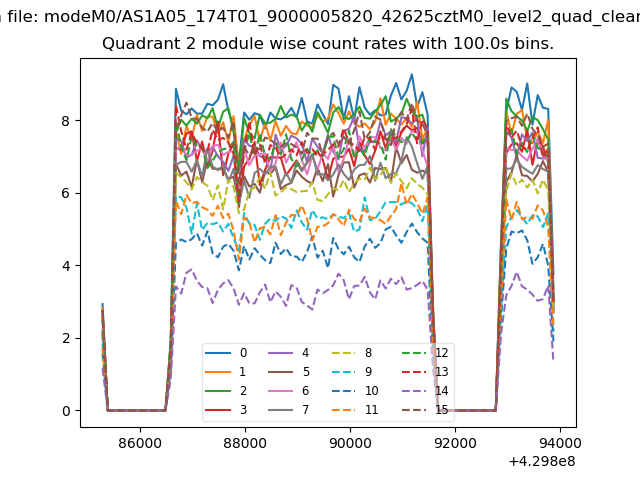
| Module-wise count rates for Quadrant B Data is divided into 100 sec bins |
 |
 |
| Module-wise count rates for Quadrant C Data is divided into 100 sec bins |
 |
 |
| Module-wise count rates for Quadrant D Data is divided into 100 sec bins |
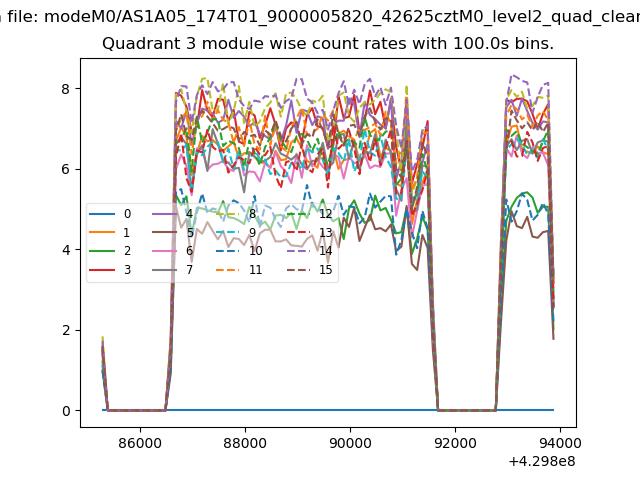 |
 |
| Parameter | Plot |
|---|---|
| CZT HV Monitor |  |
| D_VDD | 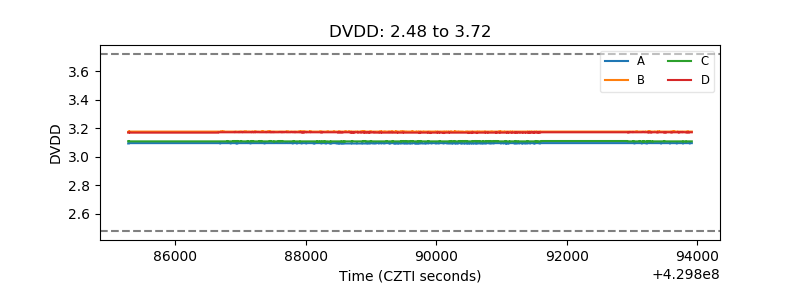 |
| Temperature 1 | 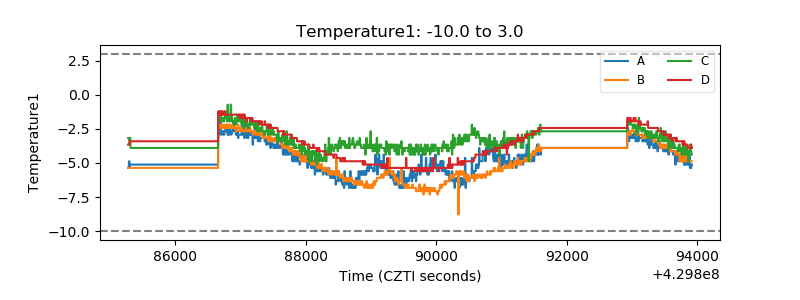 |
| Veto HV Monitor | 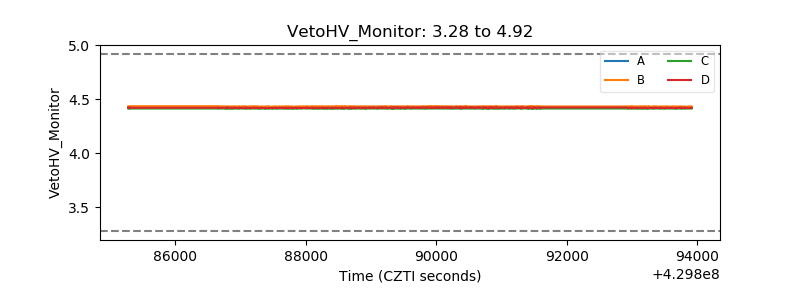 |
| Veto LLD | 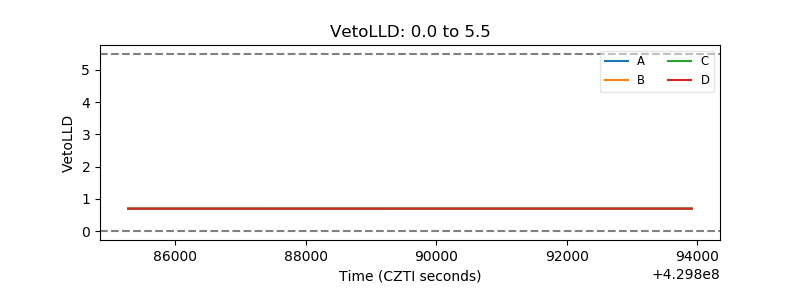 |
| Alpha Counter | 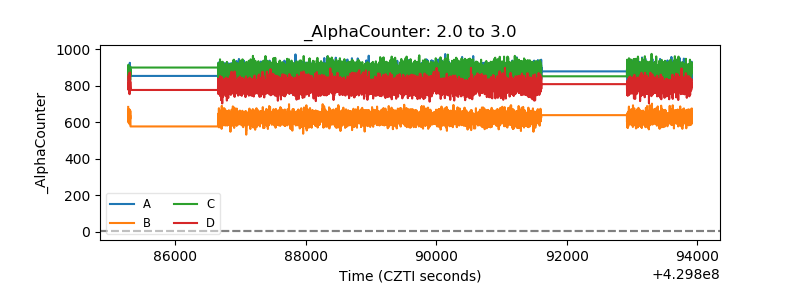 |
| _CPM_Rate | 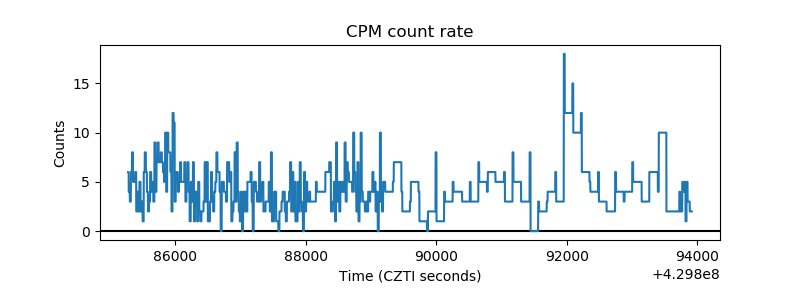 |
| CZT Counter | 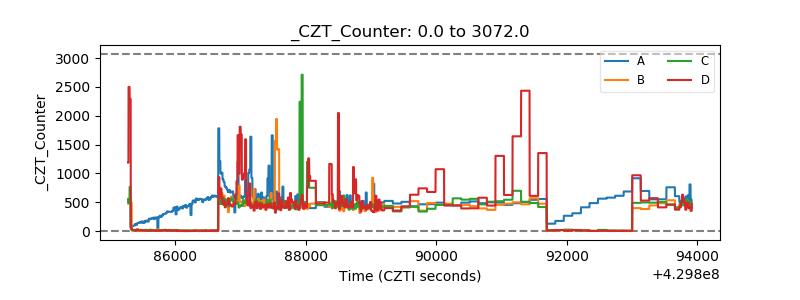 |
| +2.5 Volts monitor | 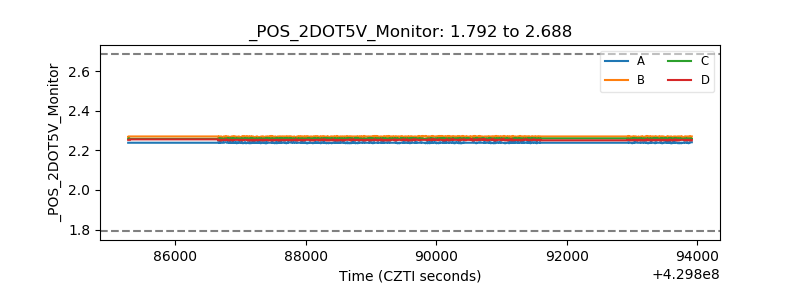 |
| +5 Volts monitor |  |
| _ROLL_ROT | 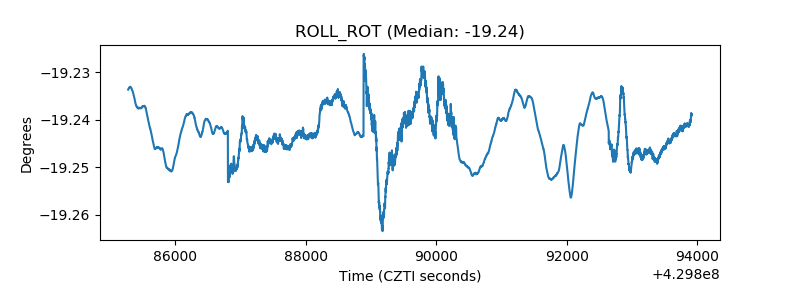 |
| _Roll_DEC | 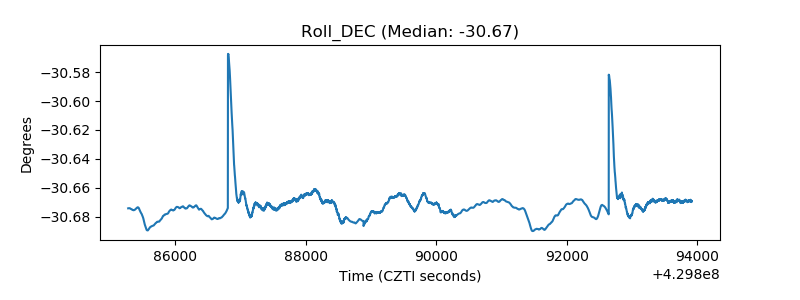 |
| _Roll_RA | 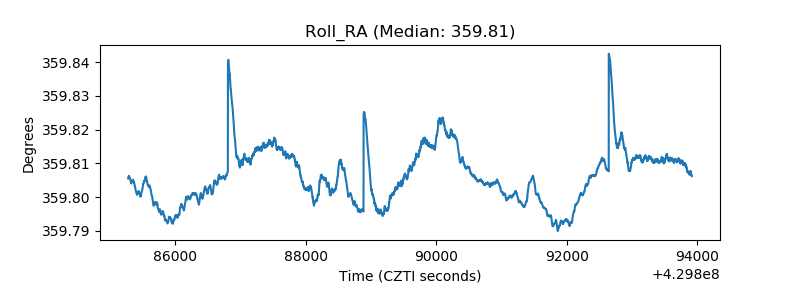 |
| Veto Counter | 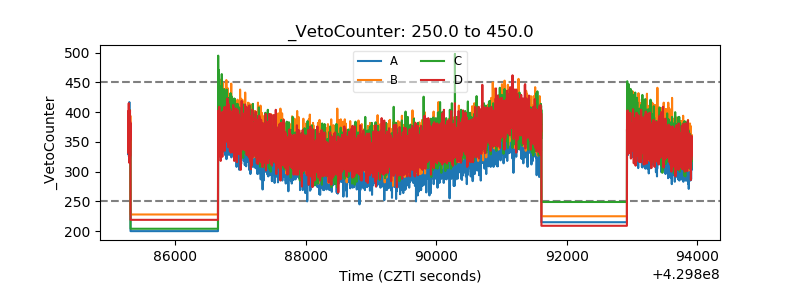 |