| Param | Original file | Final file |
|---|---|---|
| Filename | modeM0/AS1A05_174T01_9000005820_42628cztM0_level2.fits | modeM0/AS1A05_174T01_9000005820_42628cztM0_level2_quad_clean.evt |
| Size (bytes) | 954,570,240 | 256,700,160 |
| Size | 910.3 MB | 244.8 MB |
| Events in quadrant A | 8,542,644 | 1,718,983 |
| Events in quadrant B | 7,249,068 | 1,764,497 |
| Events in quadrant C | 7,769,581 | 1,687,079 |
| Events in quadrant D | 10,536,849 | 1,500,435 |
| Mode M9 | |||
|---|---|---|---|
| Quadrant | BADHDUFLAG | Total packets | Discarded packets |
| A | 0 | 56 | 0 |
| B | 0 | 56 | 0 |
| C | 0 | 56 | 0 |
| D | 0 | 56 | 0 |
| Mode SS | |||
|---|---|---|---|
| Quadrant | BADHDUFLAG | Total packets | Discarded packets |
| A | 0 | 328 | 0 |
| B | 0 | 328 | 0 |
| C | 0 | 328 | 0 |
| D | 0 | 328 | 0 |
| Mode M0 | |||
|---|---|---|---|
| Quadrant | BADHDUFLAG | Total packets | Discarded packets |
| A | 0 | 35215 | 4 |
| B | 0 | 32568 | 4 |
| C | 0 | 33289 | 4 |
| D | 0 | 42929 | 7 |
| Quadrant | Total seconds | Saturated seconds | Saturation percentage |
|---|---|---|---|
| A | 15960 | 46 | 0.288221% |
| B | 15961 | 31 | 0.194223% |
| C | 15961 | 50 | 0.313264% |
| D | 15960 | 823 | 5.156642% |
Noise dominated data is calculated using 1-second bins in cleaned event files. If a bin has >2000 counts, and if more than 50% of those come from <1% of pixels, then it is considered to be noise-dominated and hence unusable.
| Quadrant | # 1 sec bins | Bins with >0 counts | Bins with >2000 counts | High rate bins dominated by noise | Noise dominated (total time) | Noise dominated (detector-on time) | Marked lightcurve |
|---|---|---|---|---|---|---|---|
| A | 21598 | 15964 | 24 | 24 | 0.11% | 0.15% | 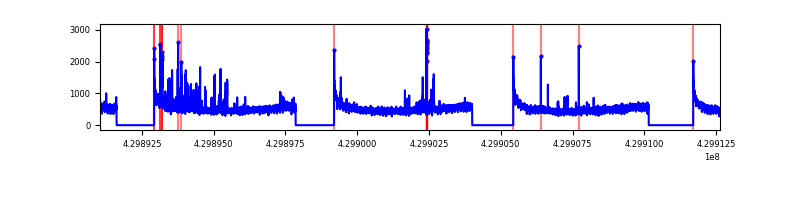 |
| B | 21599 | 15965 | 6 | 6 | 0.03% | 0.04% | 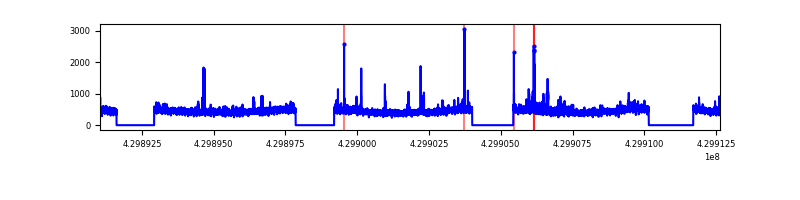 |
| C | 21599 | 15965 | 26 | 26 | 0.12% | 0.16% | 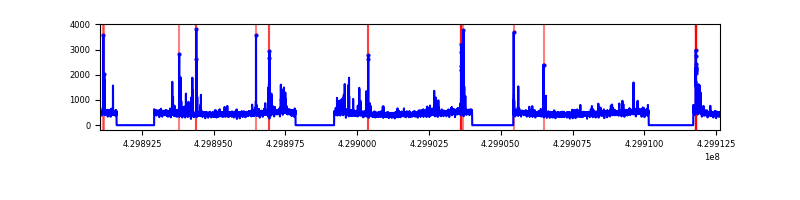 |
| D | 21598 | 15964 | 690 | 690 | 3.19% | 4.32% | 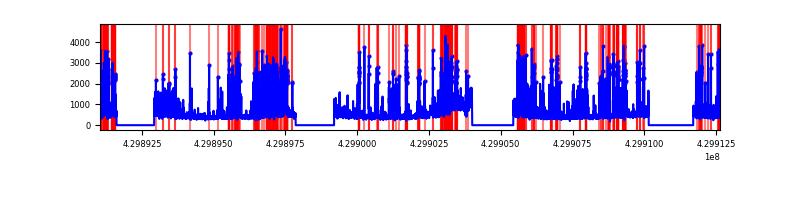 |
Top three noisy pixels from each quadrant. If the there are fewer than three noisy pixels in the level2.evt file, extra rows are filled as -1
| Pixel properties | Quadrant properties | ||||||
|---|---|---|---|---|---|---|---|
| Quadrant | DetID | PixID | Counts | Sigma | Mean | Median | Sigma |
| A | 10 | 83 | 1424893 | 3949.6 | 1754 | 1713 | 360.3 |
| A | 2 | 79 | 238253 | 656.44 | 1754 | 1713 | 360.3 |
| A | 7 | 3 | 105486 | 287.99 | 1754 | 1713 | 360.3 |
| B | 0 | 245 | 259844 | 762.85 | 1743 | 1697 | 338.4 |
| B | 0 | 168 | 53395 | 152.77 | 1743 | 1697 | 338.4 |
| B | 7 | 202 | 51386 | 146.84 | 1743 | 1697 | 338.4 |
| C | 15 | 214 | 654197 | 1618.79 | 1725 | 1735 | 403.1 |
| C | 14 | 254 | 301252 | 743.12 | 1725 | 1735 | 403.1 |
| C | 0 | 239 | 58771 | 141.51 | 1725 | 1735 | 403.1 |
| D | 13 | 249 | 1479399 | 3592.56 | 1681 | 1631 | 411.3 |
| D | 1 | 52 | 733004 | 1778.02 | 1681 | 1631 | 411.3 |
| D | 12 | 6 | 566655 | 1373.61 | 1681 | 1631 | 411.3 |
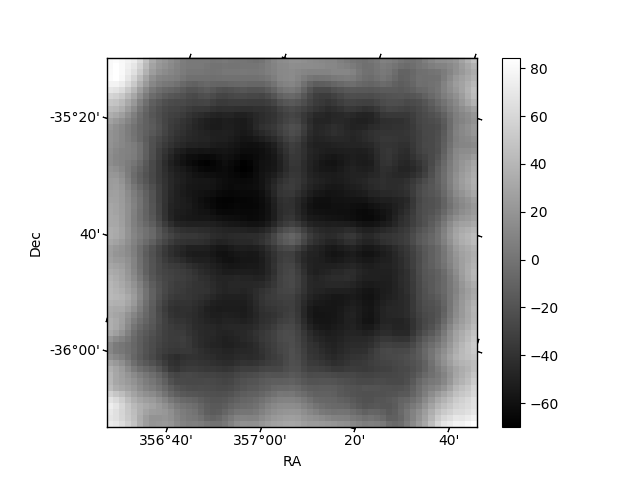
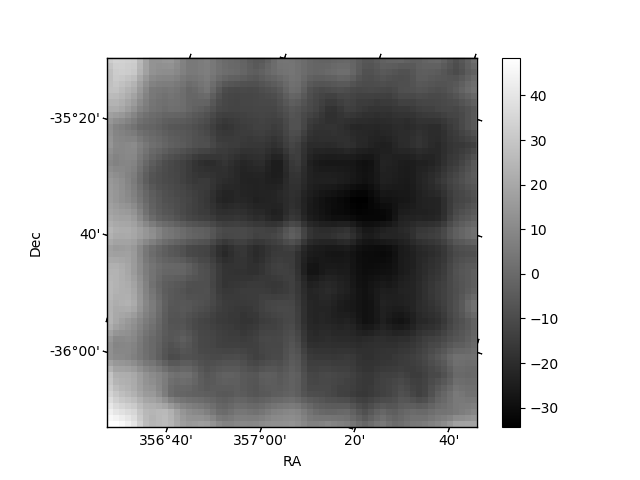
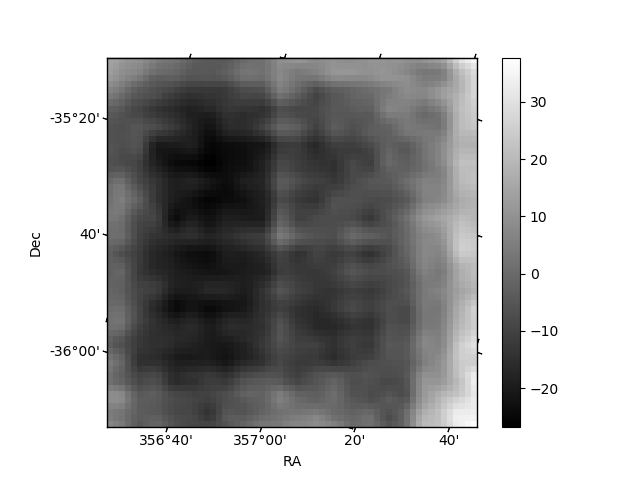
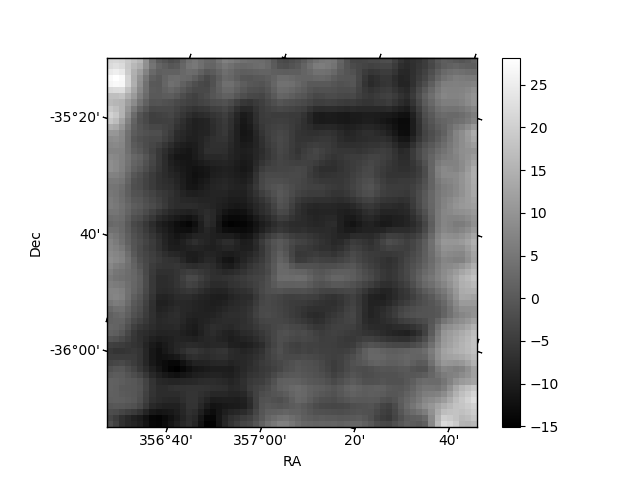
Histogram calculated using DETX and DETY for each event in the final _common_clean file
| Quadrant A | 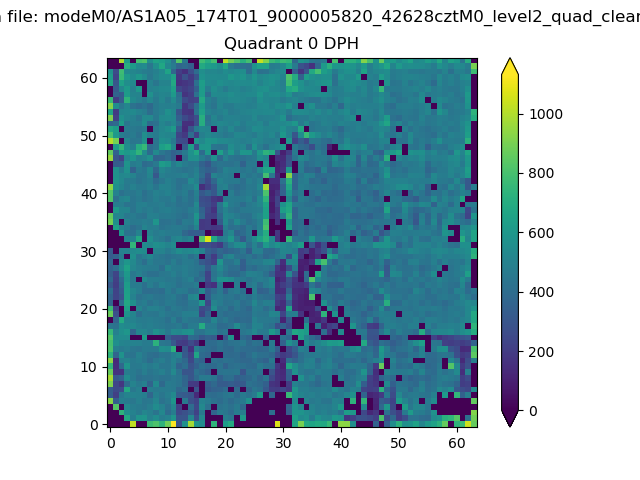 |
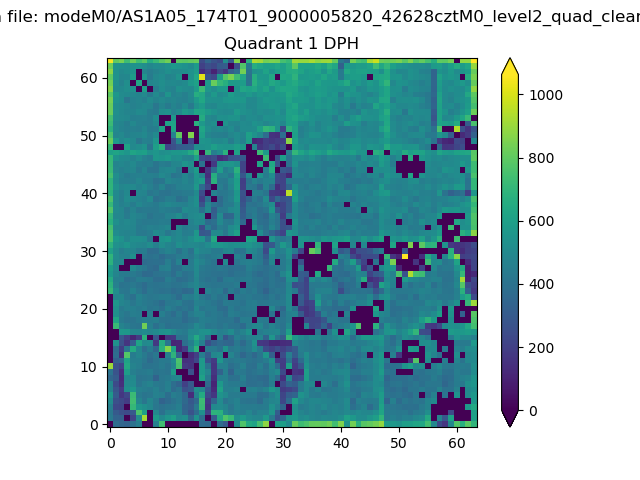 |
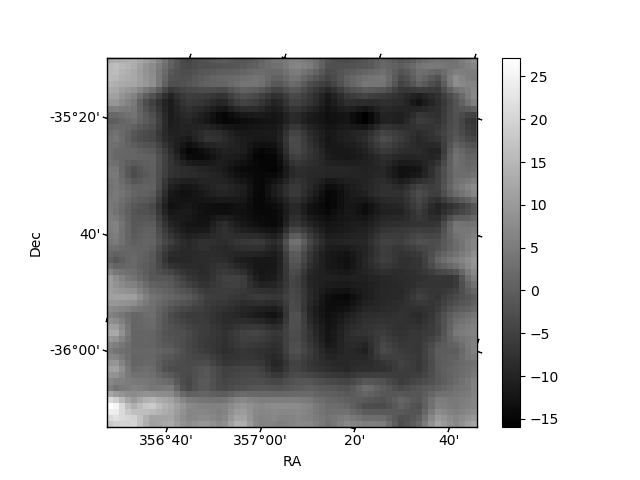
Quadrant B |
|---|---|---|---|
| Quadrant D | 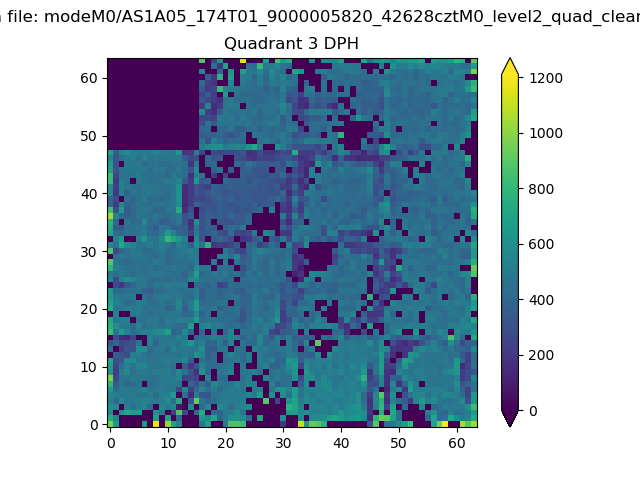 |
 |
Quadrant C |
| Plot type | Count rate plots | Images |
|---|---|---|
| Comparison with Poisson distribution Blue bars denote a histogram of data divided into 1 sec bins. Red curve is a Poisson curve with rate = median count rate of data. |
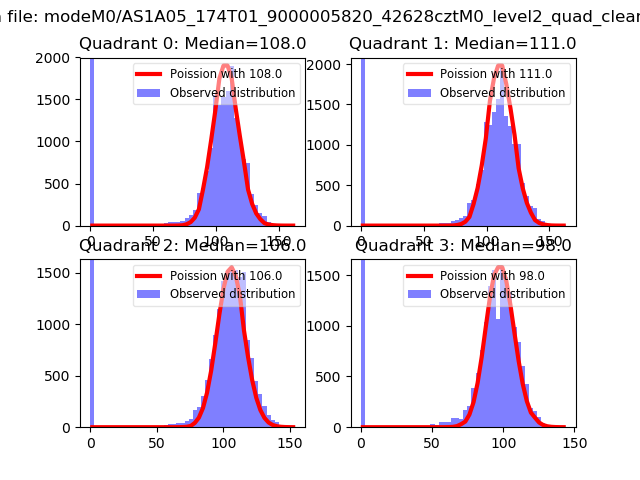 |
 |
| Quadrant-wise count rates Data is divided into 100 sec bins |
 |
|
| Module-wise count rates for Quadrant A Data is divided into 100 sec bins |
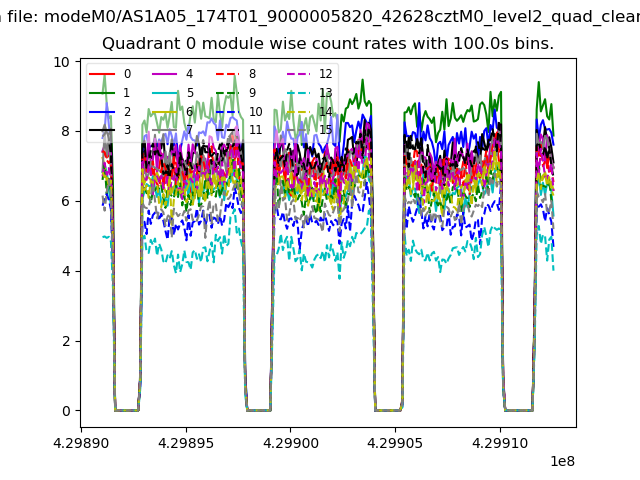 |
 |
| Module-wise count rates for Quadrant B Data is divided into 100 sec bins |
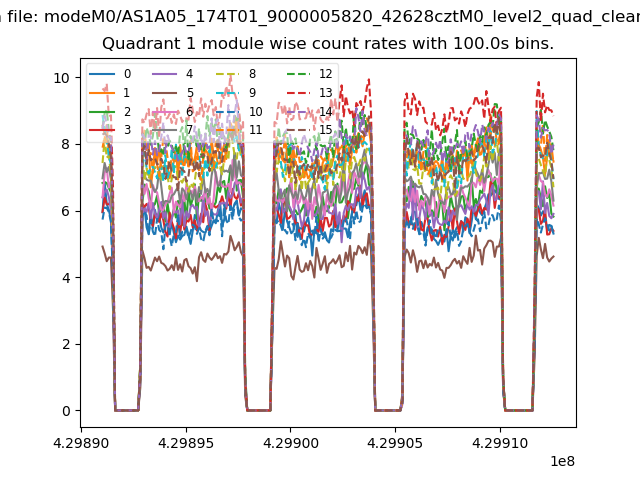 |
 |
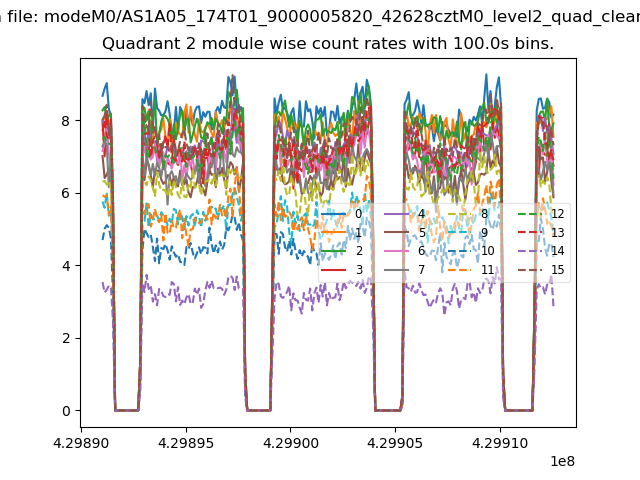
| Module-wise count rates for Quadrant C Data is divided into 100 sec bins |
 |
 |
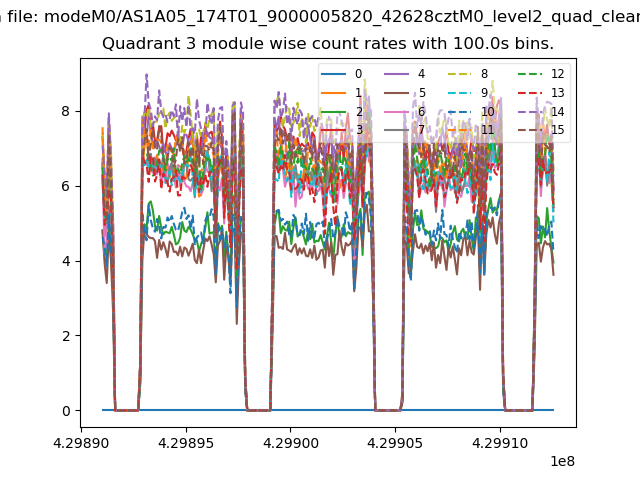
| Module-wise count rates for Quadrant D Data is divided into 100 sec bins |
 |
 |
| Parameter | Plot |
|---|---|
| CZT HV Monitor | 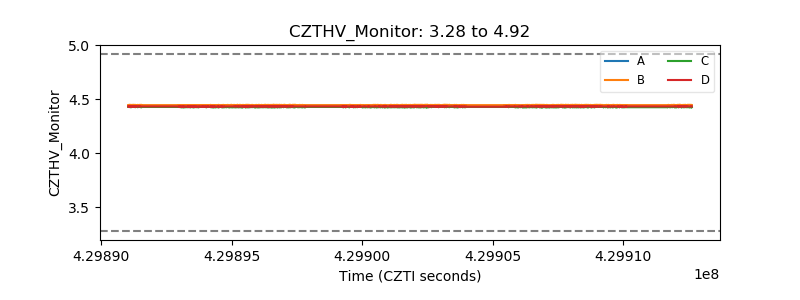 |
| D_VDD | 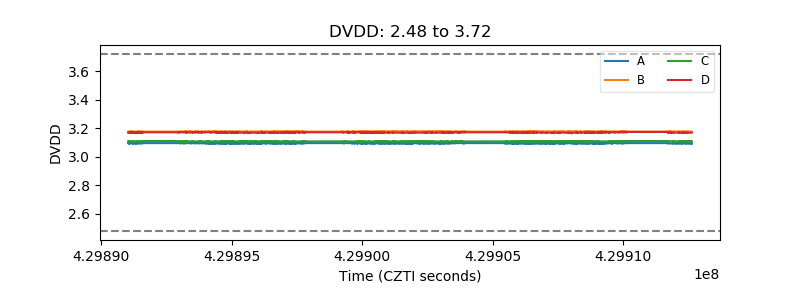 |
| Temperature 1 | 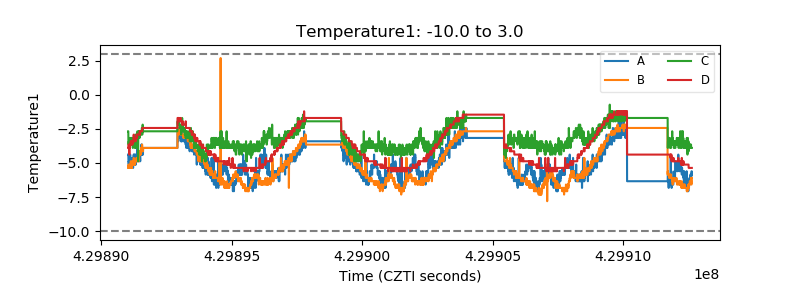 |
| Veto HV Monitor | 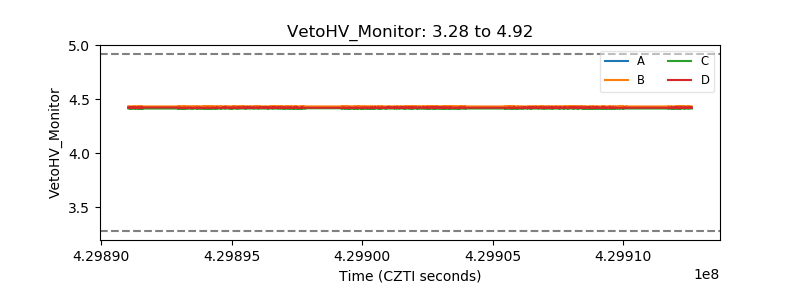 |
| Veto LLD | 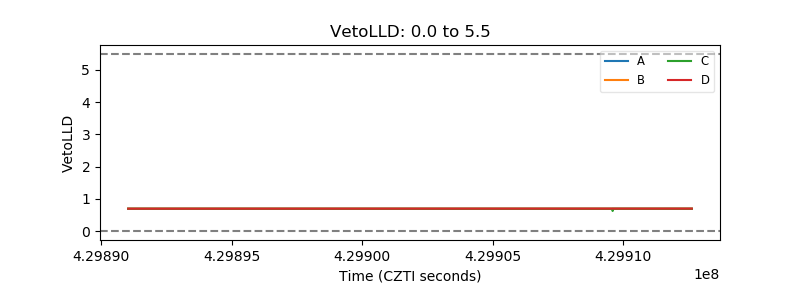 |
| Alpha Counter | 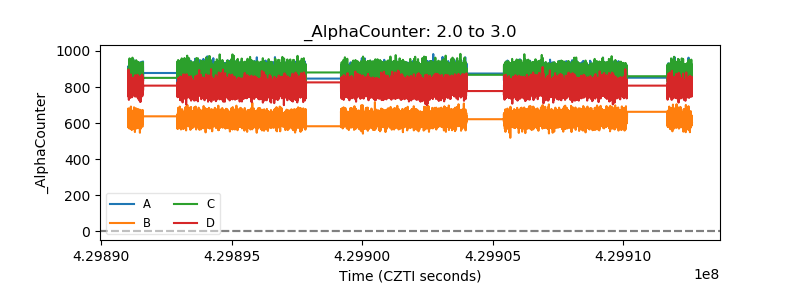 |
| _CPM_Rate | 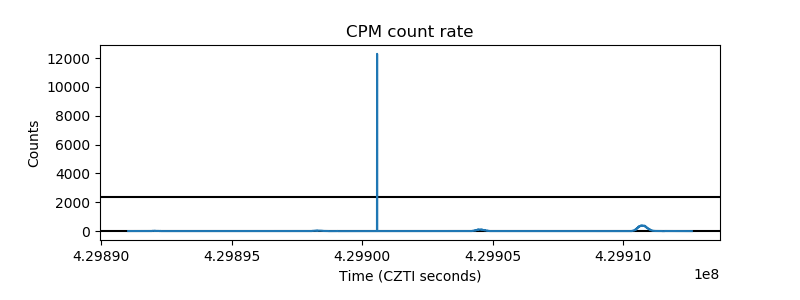 |
| CZT Counter | 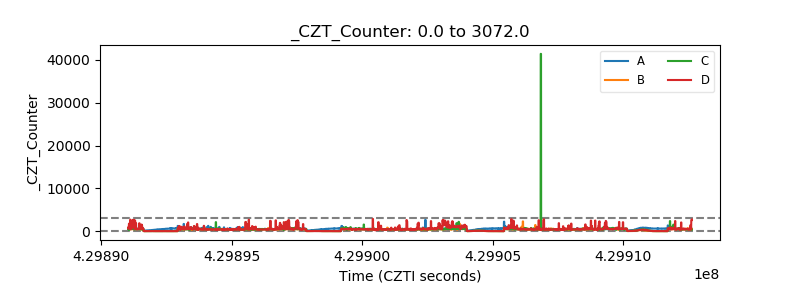 |
| +2.5 Volts monitor | 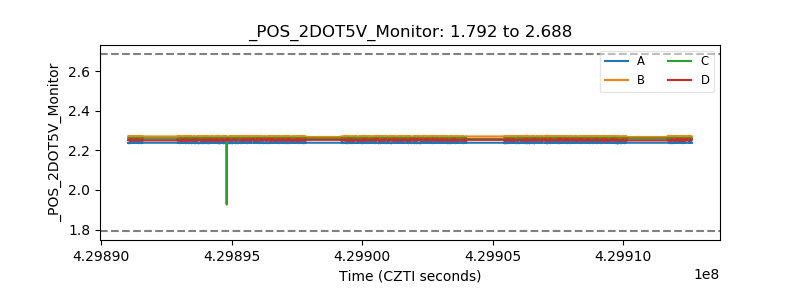 |
| +5 Volts monitor | 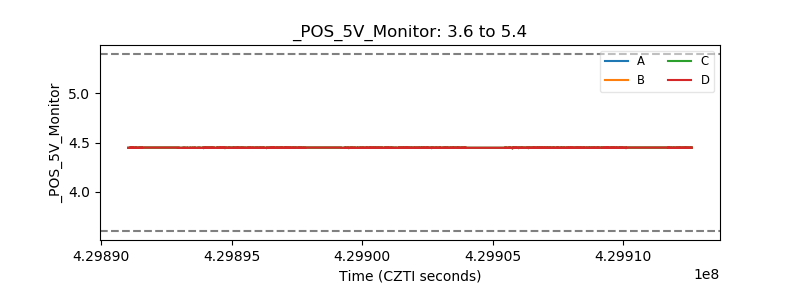 |
| _ROLL_ROT | 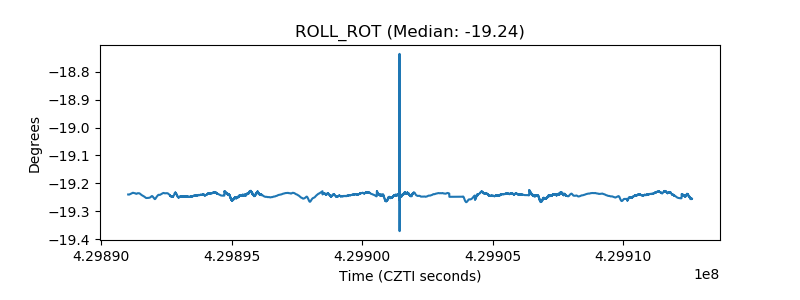 |
| _Roll_DEC | 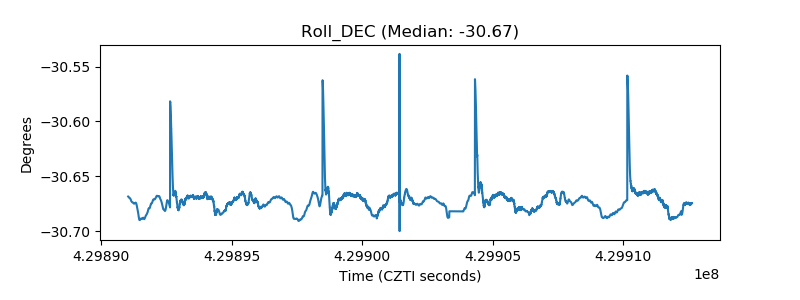 |
| _Roll_RA | 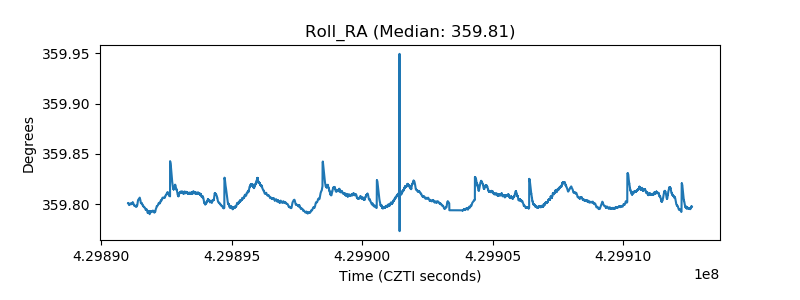 |
| Veto Counter | 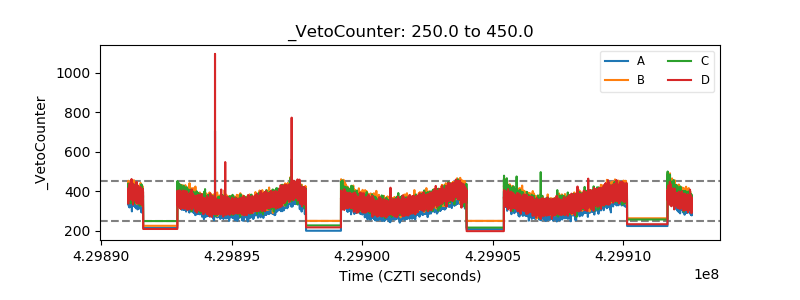 |