| Param | Original file | Final file |
|---|---|---|
| Filename | modeM0/AS1A05_174T01_9000005820_42629cztM0_level2.fits | modeM0/AS1A05_174T01_9000005820_42629cztM0_level2_quad_clean.evt |
| Size (bytes) | 376,603,200 | 105,292,800 |
| Size | 359.2 MB | 100.4 MB |
| Events in quadrant A | 3,408,902 | 700,860 |
| Events in quadrant B | 3,095,734 | 722,258 |
| Events in quadrant C | 3,144,610 | 692,068 |
| Events in quadrant D | 3,795,214 | 628,212 |
| Mode M9 | |||
|---|---|---|---|
| Quadrant | BADHDUFLAG | Total packets | Discarded packets |
| A | 0 | 32 | 0 |
| B | 0 | 32 | 0 |
| C | 0 | 32 | 0 |
| D | 0 | 32 | 0 |
| Mode SS | |||
|---|---|---|---|
| Quadrant | BADHDUFLAG | Total packets | Discarded packets |
| A | 0 | 132 | 0 |
| B | 0 | 132 | 0 |
| C | 0 | 132 | 0 |
| D | 0 | 132 | 0 |
| Mode M0 | |||
|---|---|---|---|
| Quadrant | BADHDUFLAG | Total packets | Discarded packets |
| A | 0 | 14003 | 2 |
| B | 0 | 13380 | 2 |
| C | 0 | 13210 | 2 |
| D | 0 | 15736 | 3 |
| Quadrant | Total seconds | Saturated seconds | Saturation percentage |
|---|---|---|---|
| A | 6374 | 16 | 0.251020% |
| B | 6375 | 34 | 0.533333% |
| C | 6375 | 15 | 0.235294% |
| D | 6374 | 175 | 2.745529% |
Noise dominated data is calculated using 1-second bins in cleaned event files. If a bin has >2000 counts, and if more than 50% of those come from <1% of pixels, then it is considered to be noise-dominated and hence unusable.
| Quadrant | # 1 sec bins | Bins with >0 counts | Bins with >2000 counts | High rate bins dominated by noise | Noise dominated (total time) | Noise dominated (detector-on time) | Marked lightcurve |
|---|---|---|---|---|---|---|---|
| A | 9599 | 6376 | 2 | 2 | 0.02% | 0.03% | 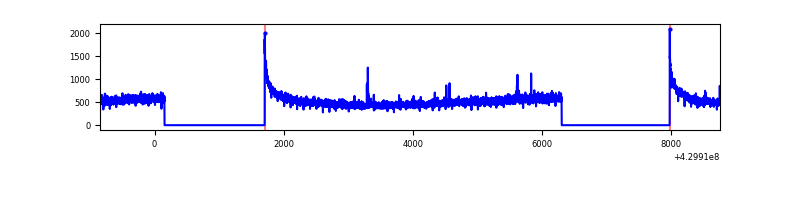 |
| B | 9600 | 6377 | 10 | 10 | 0.10% | 0.16% | 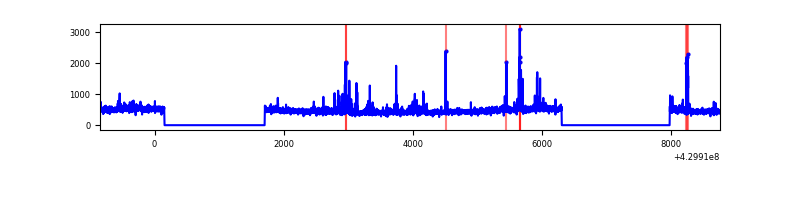 |
| C | 9600 | 6377 | 9 | 9 | 0.09% | 0.14% | 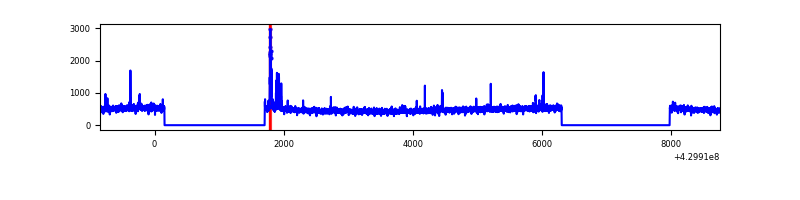 |
| D | 9599 | 6376 | 153 | 153 | 1.59% | 2.40% | 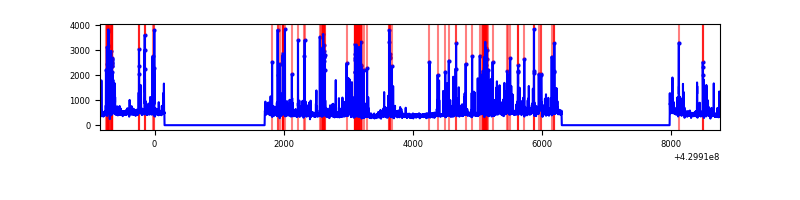 |
Top three noisy pixels from each quadrant. If the there are fewer than three noisy pixels in the level2.evt file, extra rows are filled as -1
| Pixel properties | Quadrant properties | ||||||
|---|---|---|---|---|---|---|---|
| Quadrant | DetID | PixID | Counts | Sigma | Mean | Median | Sigma |
| A | 10 | 83 | 612933 | 4173.47 | 715 | 700 | 146.7 |
| A | 2 | 79 | 12875 | 82.99 | 715 | 700 | 146.7 |
| A | 13 | 248 | 9988 | 63.31 | 715 | 700 | 146.7 |
| B | 0 | 245 | 247603 | 1788.95 | 711 | 692 | 138.0 |
| B | 7 | 202 | 21870 | 153.44 | 711 | 692 | 138.0 |
| B | 5 | 255 | 19749 | 138.07 | 711 | 692 | 138.0 |
| C | 15 | 214 | 262712 | 1581.1 | 706 | 710 | 165.7 |
| C | 14 | 254 | 111766 | 670.19 | 706 | 710 | 165.7 |
| C | 15 | 111 | 9421 | 52.57 | 706 | 710 | 165.7 |
| D | 13 | 249 | 375312 | 2191.5 | 697 | 675 | 170.9 |
| D | 1 | 52 | 345087 | 2014.7 | 697 | 675 | 170.9 |
| D | 12 | 6 | 150678 | 877.47 | 697 | 675 | 170.9 |
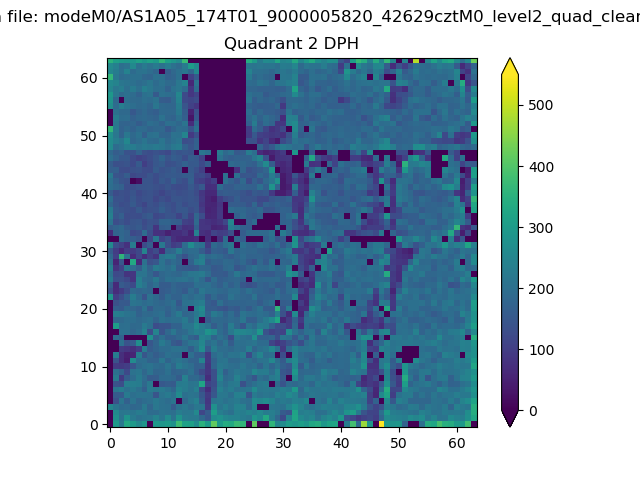
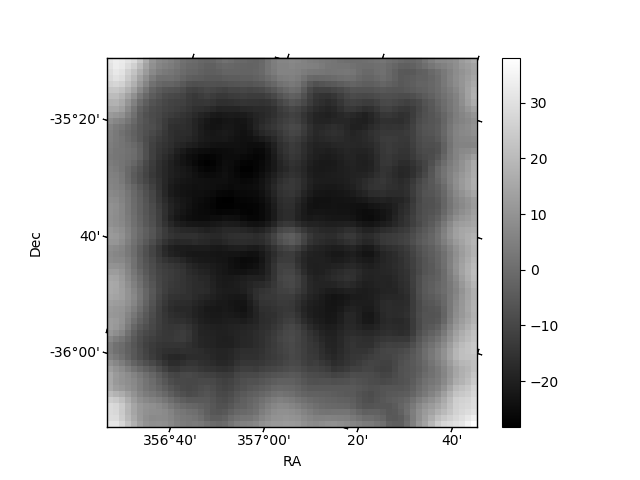
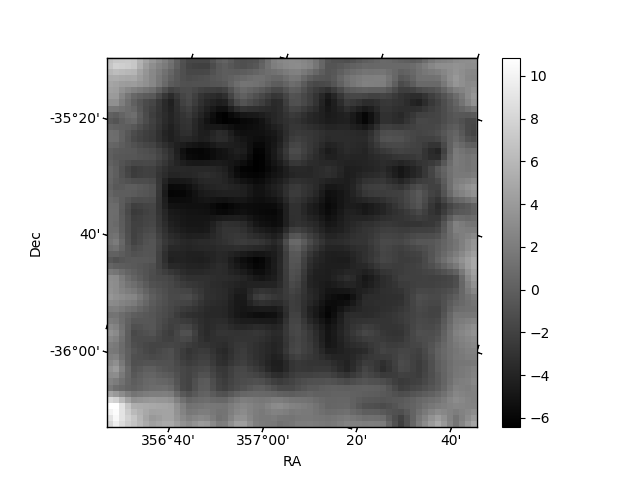
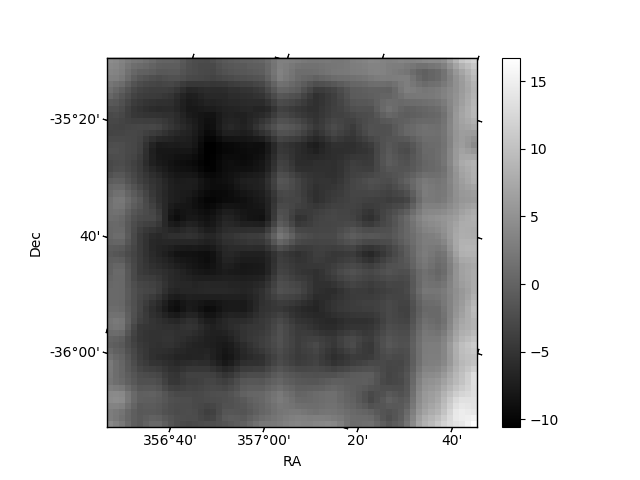
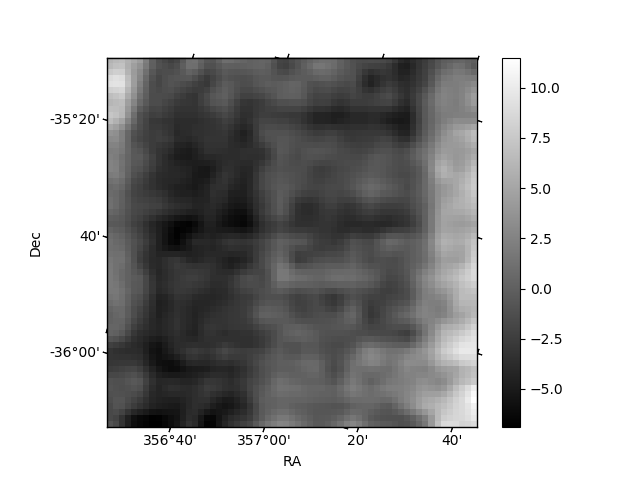
Histogram calculated using DETX and DETY for each event in the final _common_clean file
| Quadrant A | 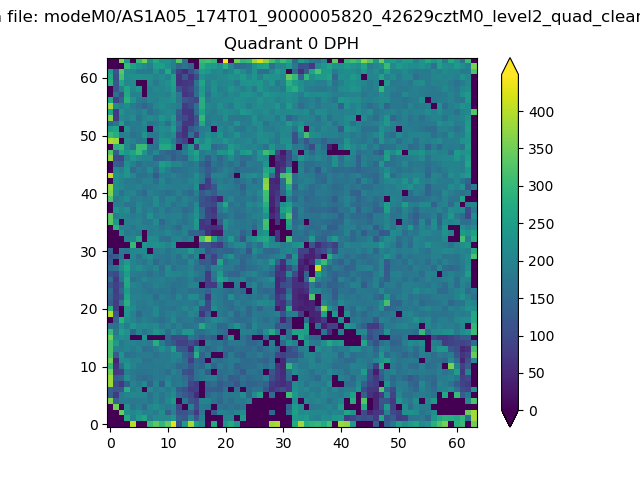 |
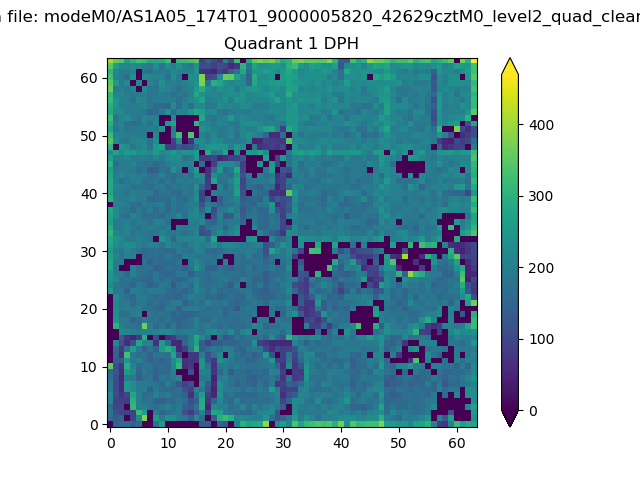 |
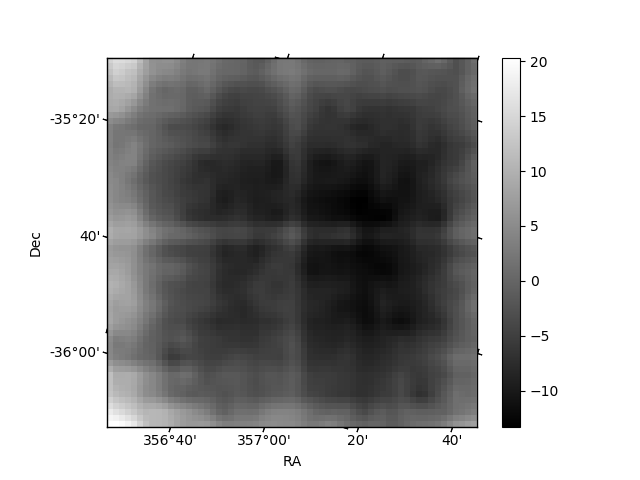
Quadrant B |
|---|---|---|---|
| Quadrant D | 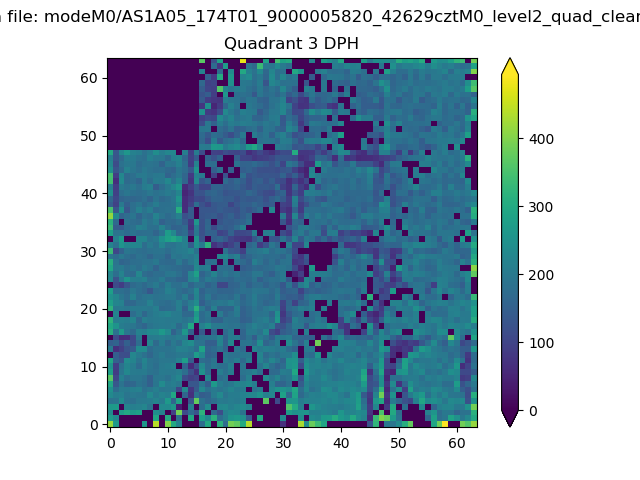 |
 |
Quadrant C |
| Plot type | Count rate plots | Images |
|---|---|---|
| Comparison with Poisson distribution Blue bars denote a histogram of data divided into 1 sec bins. Red curve is a Poisson curve with rate = median count rate of data. |
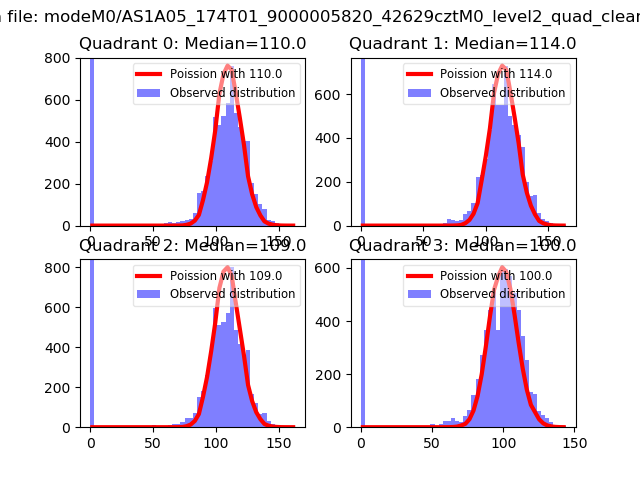 |
 |
| Quadrant-wise count rates Data is divided into 100 sec bins |
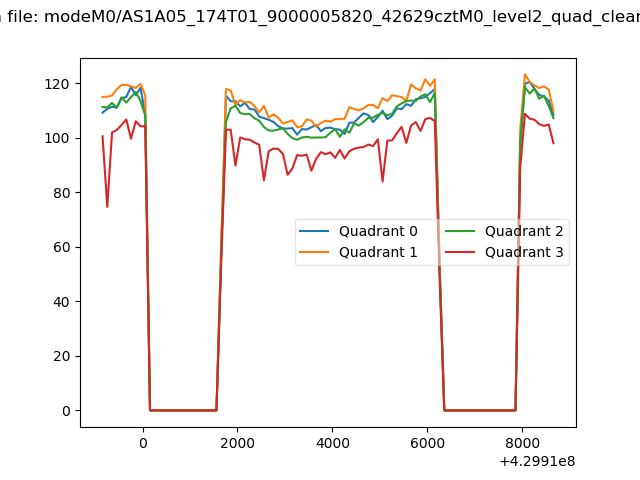 |
|
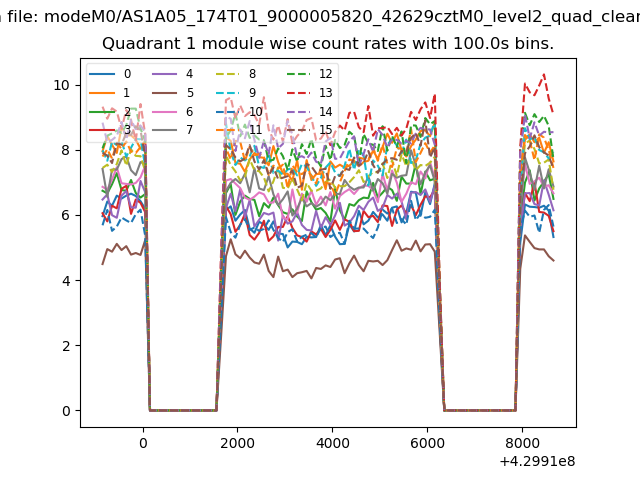
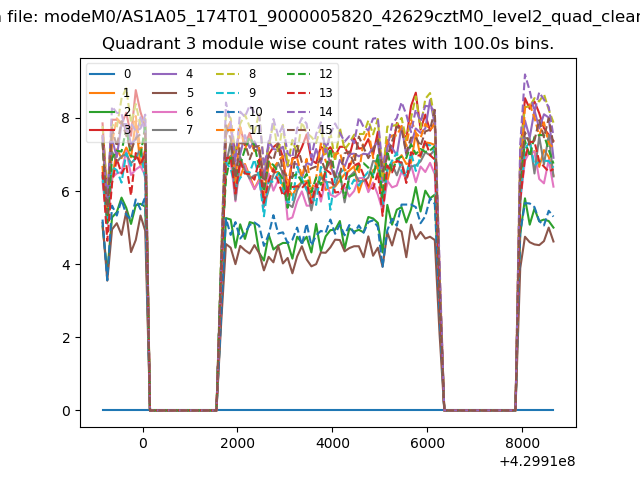
| Module-wise count rates for Quadrant A Data is divided into 100 sec bins |
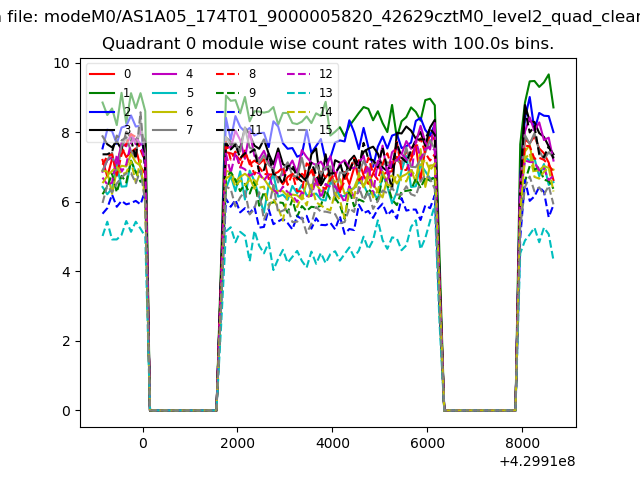 |
 |
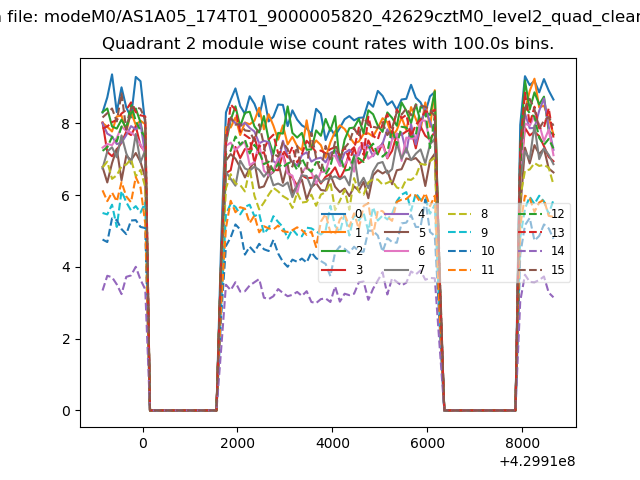
| Module-wise count rates for Quadrant B Data is divided into 100 sec bins |
 |
 |
| Module-wise count rates for Quadrant C Data is divided into 100 sec bins |
 |
 |
| Module-wise count rates for Quadrant D Data is divided into 100 sec bins |
 |
 |
| Parameter | Plot |
|---|---|
| CZT HV Monitor | 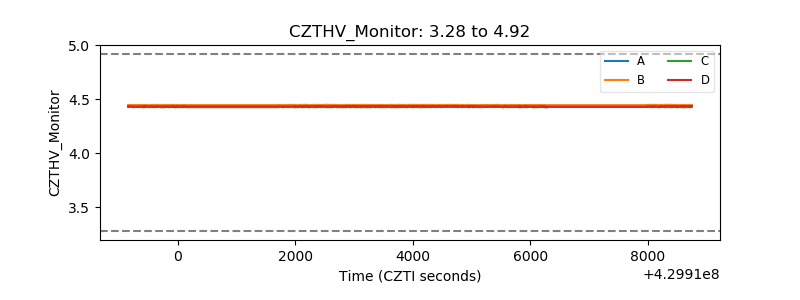 |
| D_VDD | 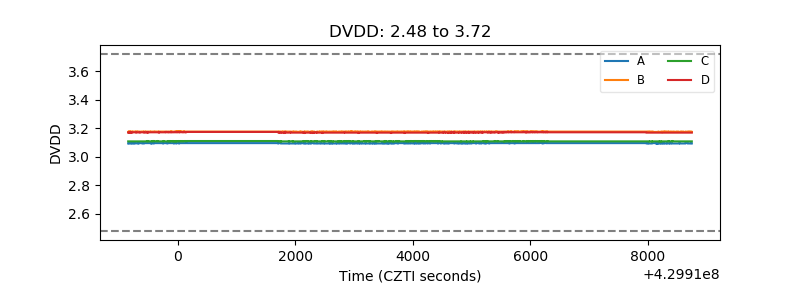 |
| Temperature 1 | 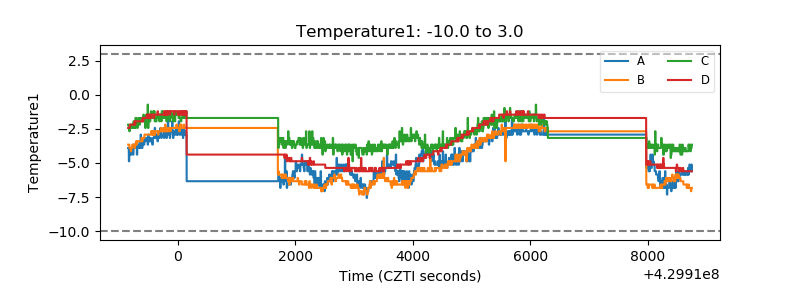 |
| Veto HV Monitor | 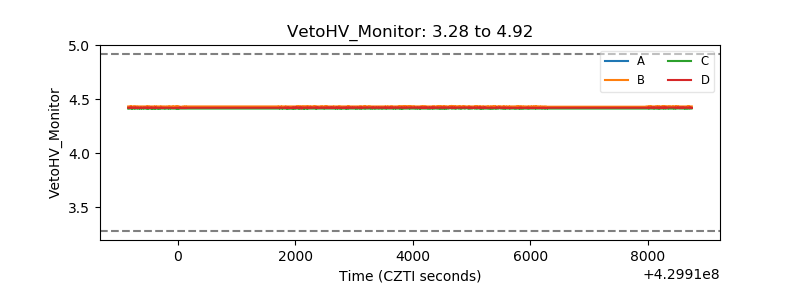 |
| Veto LLD | 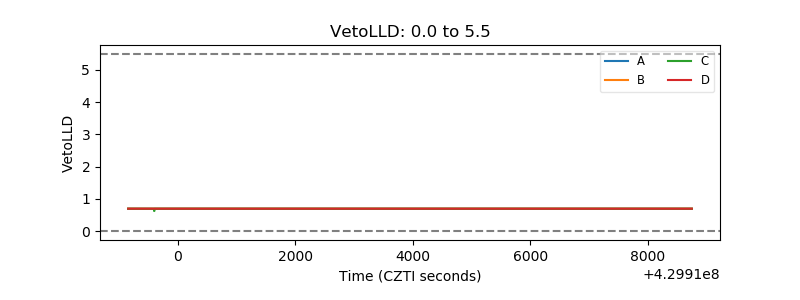 |
| Alpha Counter | 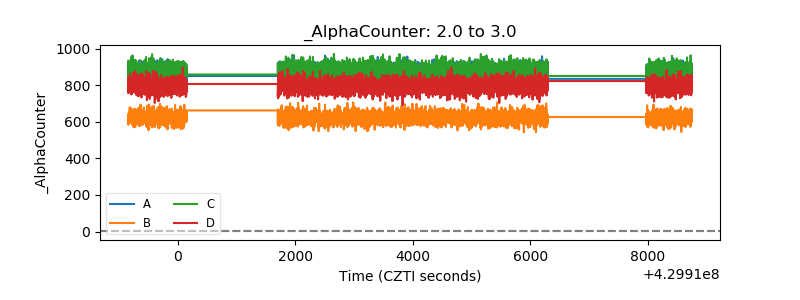 |
| _CPM_Rate | 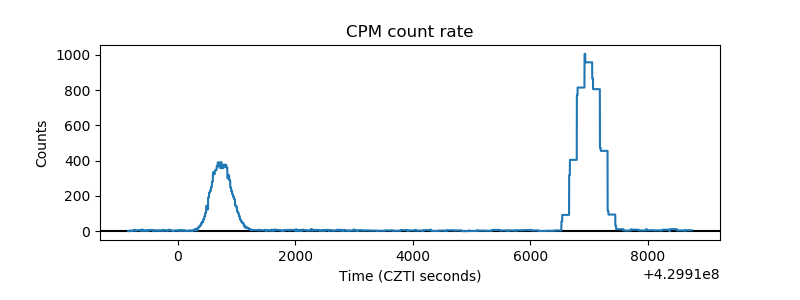 |
| CZT Counter |  |
| +2.5 Volts monitor | 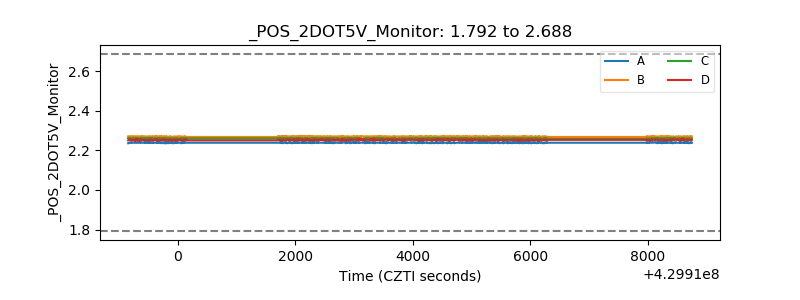 |
| +5 Volts monitor | 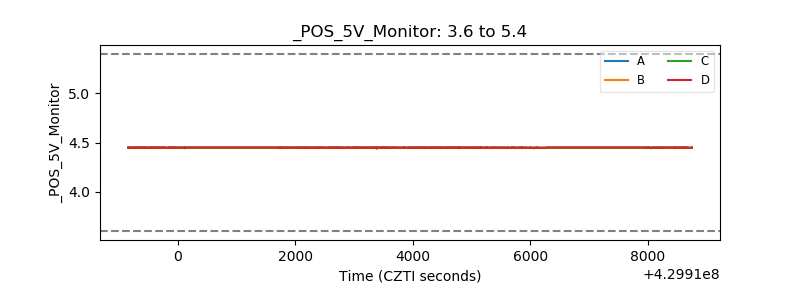 |
| _ROLL_ROT | 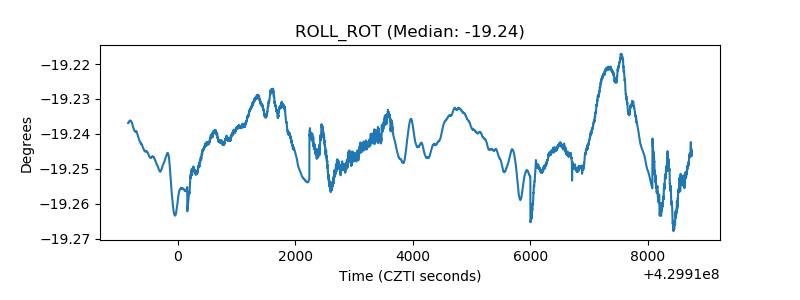 |
| _Roll_DEC | 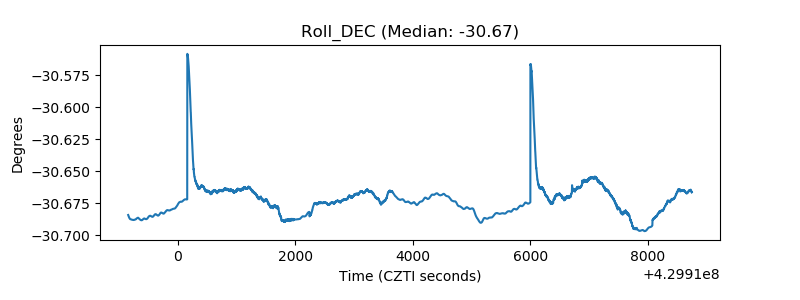 |
| _Roll_RA | 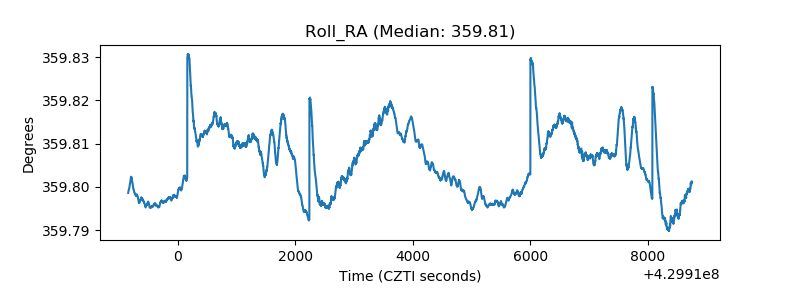 |
| Veto Counter | 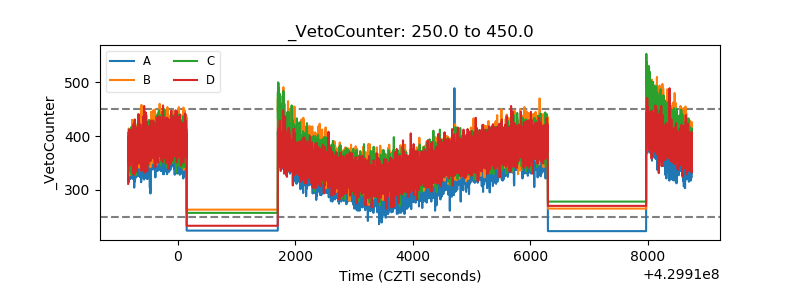 |