| Param | Original file | Final file |
|---|---|---|
| Filename | modeM0/AS1A05_174T01_9000005820_42631cztM0_level2.fits | modeM0/AS1A05_174T01_9000005820_42631cztM0_level2_quad_clean.evt |
| Size (bytes) | 348,477,120 | 93,608,640 |
| Size | 332.3 MB | 89.3 MB |
| Events in quadrant A | 2,950,376 | 629,900 |
| Events in quadrant B | 2,838,847 | 646,914 |
| Events in quadrant C | 2,824,946 | 622,640 |
| Events in quadrant D | 3,852,077 | 545,755 |
| Mode M9 | |||
|---|---|---|---|
| Quadrant | BADHDUFLAG | Total packets | Discarded packets |
| A | 0 | 28 | 0 |
| B | 0 | 29 | 0 |
| C | 0 | 29 | 0 |
| D | 0 | 29 | 0 |
| Mode SS | |||
|---|---|---|---|
| Quadrant | BADHDUFLAG | Total packets | Discarded packets |
| A | 0 | 114 | 0 |
| B | 0 | 114 | 0 |
| C | 0 | 114 | 0 |
| D | 0 | 114 | 0 |
| Mode M0 | |||
|---|---|---|---|
| Quadrant | BADHDUFLAG | Total packets | Discarded packets |
| A | 0 | 12110 | 2 |
| B | 0 | 12157 | 2 |
| C | 0 | 11758 | 2 |
| D | 0 | 15287 | 2 |
| Quadrant | Total seconds | Saturated seconds | Saturation percentage |
|---|---|---|---|
| A | 5562 | 12 | 0.215750% |
| B | 5562 | 76 | 1.366415% |
| C | 5562 | 26 | 0.467458% |
| D | 5562 | 374 | 6.724200% |
Noise dominated data is calculated using 1-second bins in cleaned event files. If a bin has >2000 counts, and if more than 50% of those come from <1% of pixels, then it is considered to be noise-dominated and hence unusable.
| Quadrant | # 1 sec bins | Bins with >0 counts | Bins with >2000 counts | High rate bins dominated by noise | Noise dominated (total time) | Noise dominated (detector-on time) | Marked lightcurve |
|---|---|---|---|---|---|---|---|
| A | 7386 | 5563 | 2 | 2 | 0.03% | 0.04% | 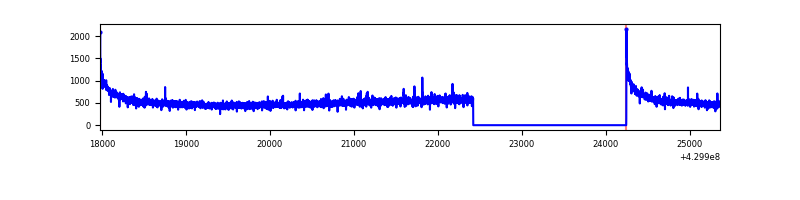 |
| B | 7386 | 5563 | 64 | 64 | 0.87% | 1.15% | 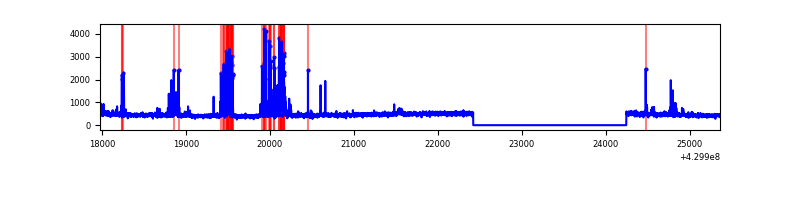 |
| C | 7386 | 5563 | 23 | 23 | 0.31% | 0.41% | 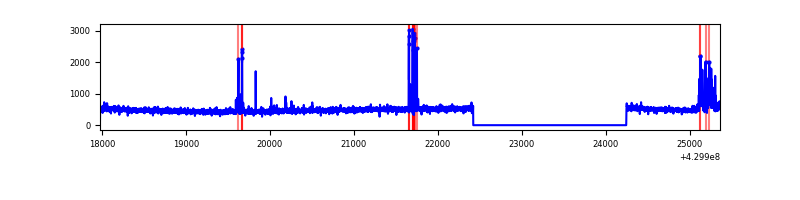 |
| D | 7386 | 5563 | 314 | 314 | 4.25% | 5.64% | 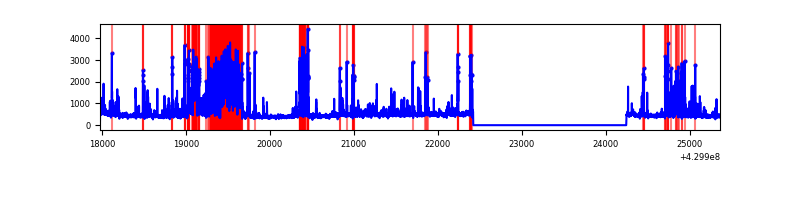 |
Top three noisy pixels from each quadrant. If the there are fewer than three noisy pixels in the level2.evt file, extra rows are filled as -1
| Pixel properties | Quadrant properties | ||||||
|---|---|---|---|---|---|---|---|
| Quadrant | DetID | PixID | Counts | Sigma | Mean | Median | Sigma |
| A | 10 | 83 | 555266 | 4341.67 | 617 | 604 | 127.8 |
| A | 13 | 254 | 7156 | 51.29 | 617 | 604 | 127.8 |
| A | 3 | 137 | 6657 | 47.38 | 617 | 604 | 127.8 |
| B | 5 | 255 | 345023 | 2899.29 | 613 | 595 | 118.8 |
| B | 0 | 245 | 60690 | 505.86 | 613 | 595 | 118.8 |
| B | 7 | 202 | 15572 | 126.07 | 613 | 595 | 118.8 |
| C | 15 | 214 | 232481 | 1620.9 | 612 | 617 | 143.0 |
| C | 14 | 254 | 194322 | 1354.14 | 612 | 617 | 143.0 |
| C | 13 | 61 | 4091 | 24.29 | 612 | 617 | 143.0 |
| D | 12 | 6 | 1204220 | 8303.56 | 594 | 579 | 145.0 |
| D | 13 | 249 | 206649 | 1421.62 | 594 | 579 | 145.0 |
| D | 1 | 47 | 57511 | 392.76 | 594 | 579 | 145.0 |
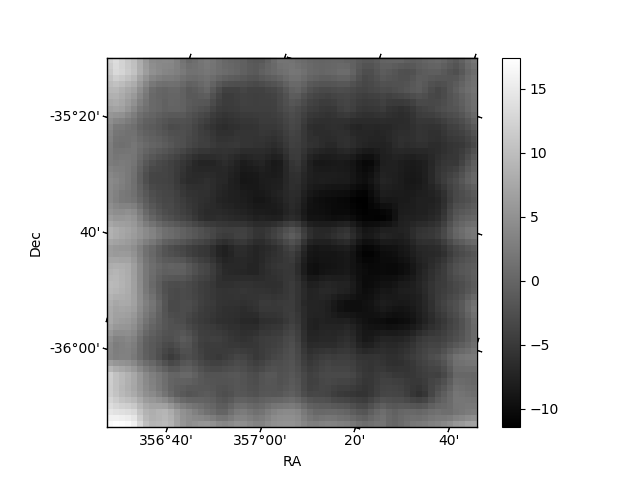
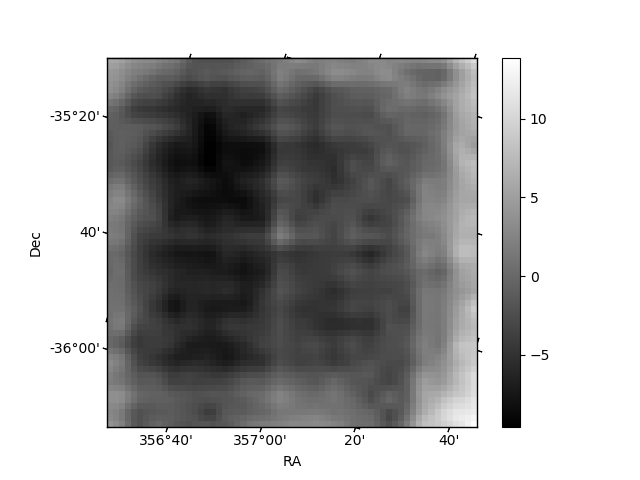
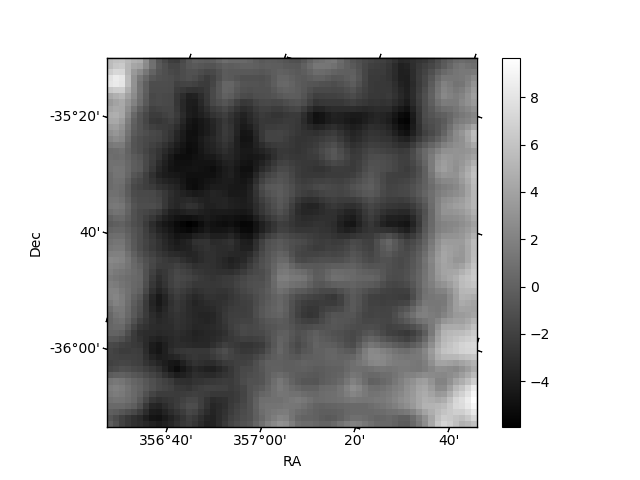
Histogram calculated using DETX and DETY for each event in the final _common_clean file
| Quadrant A | 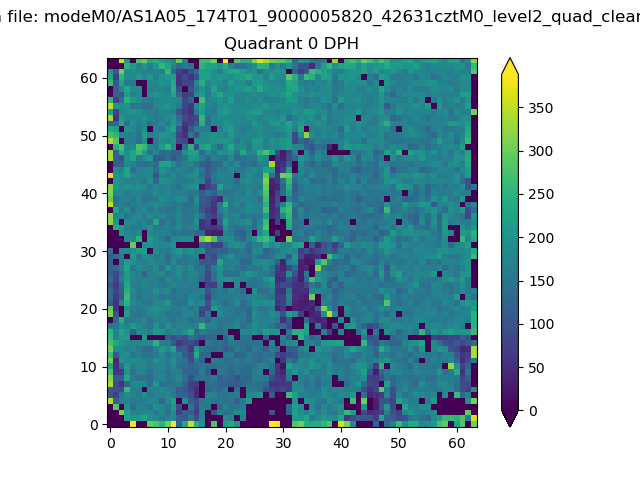 |
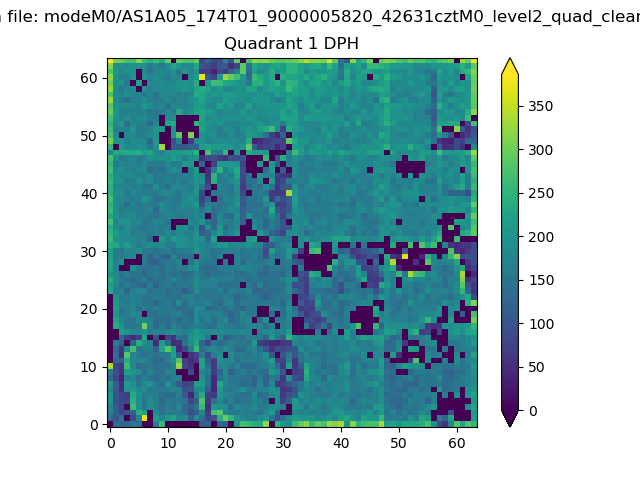 |
Quadrant B |
|---|---|---|---|
| Quadrant D | 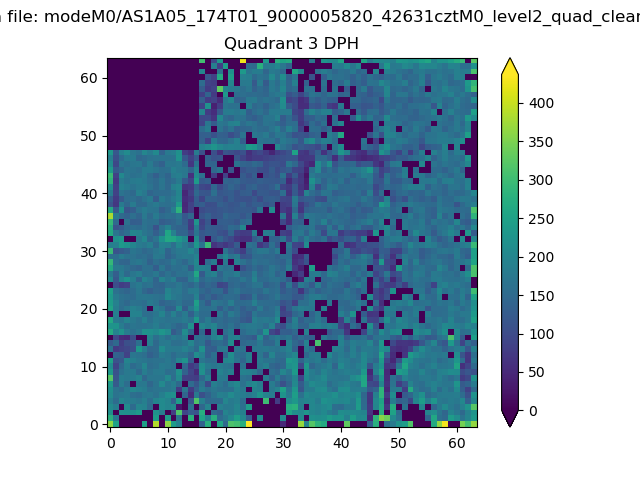 |
 |
Quadrant C |
| Plot type | Count rate plots | Images |
|---|---|---|
| Comparison with Poisson distribution Blue bars denote a histogram of data divided into 1 sec bins. Red curve is a Poisson curve with rate = median count rate of data. |
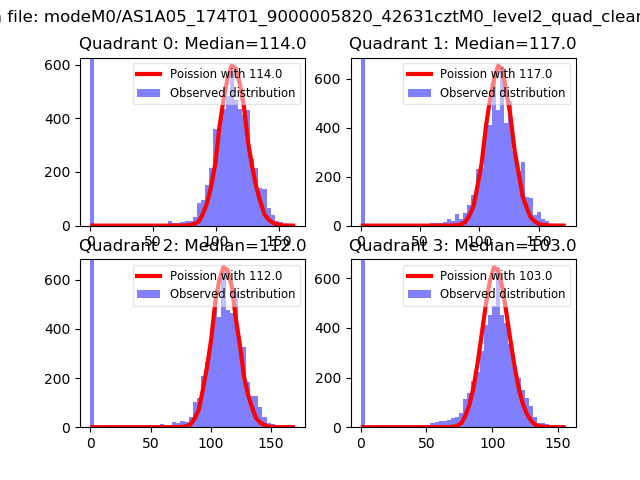 |
 |
| Quadrant-wise count rates Data is divided into 100 sec bins |
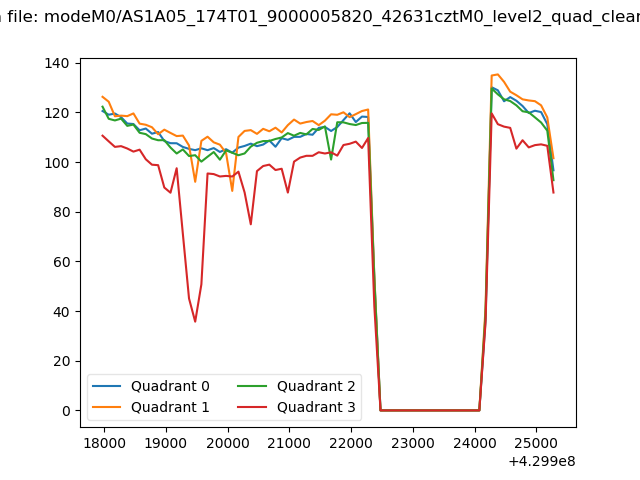 |
|
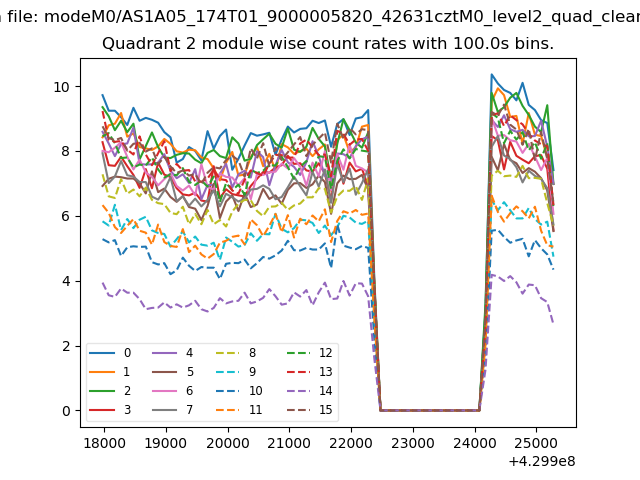
| Module-wise count rates for Quadrant A Data is divided into 100 sec bins |
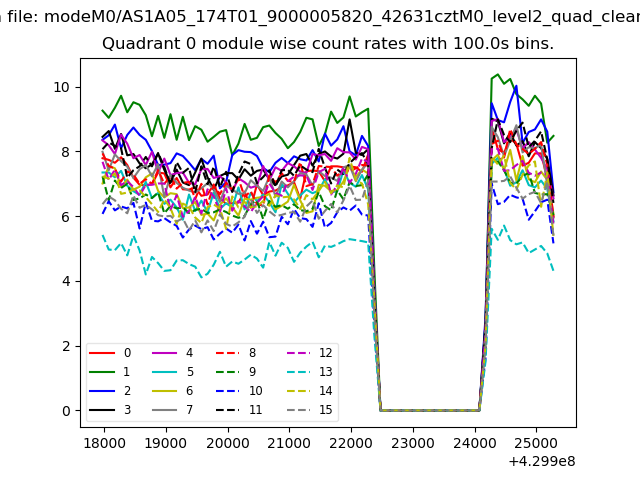 |
 |
| Module-wise count rates for Quadrant B Data is divided into 100 sec bins |
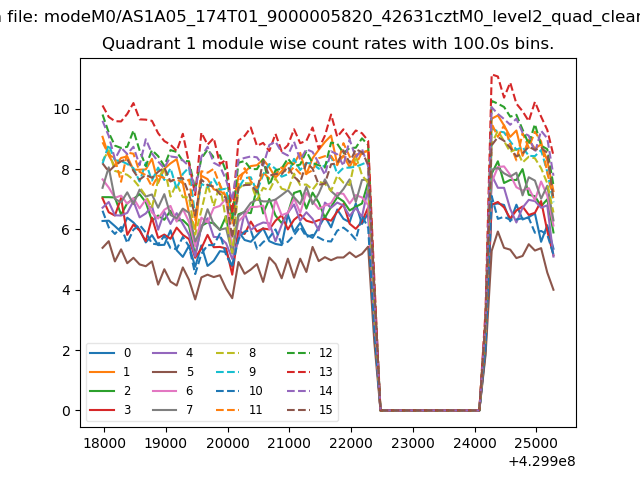 |
 |
| Module-wise count rates for Quadrant C Data is divided into 100 sec bins |
 |
 |
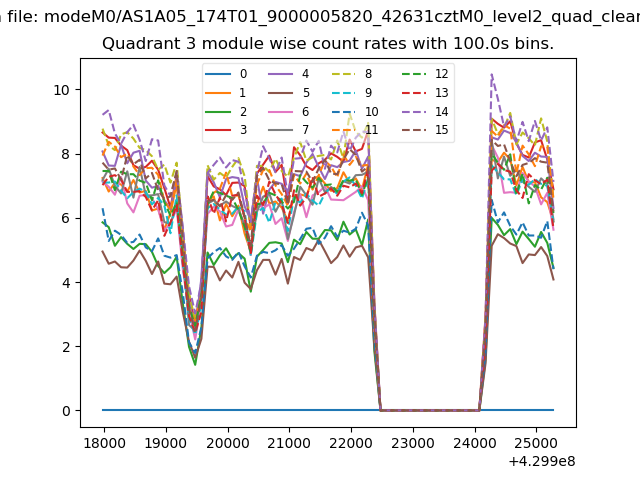
| Module-wise count rates for Quadrant D Data is divided into 100 sec bins |
 |
 |
| Parameter | Plot |
|---|---|
| CZT HV Monitor | 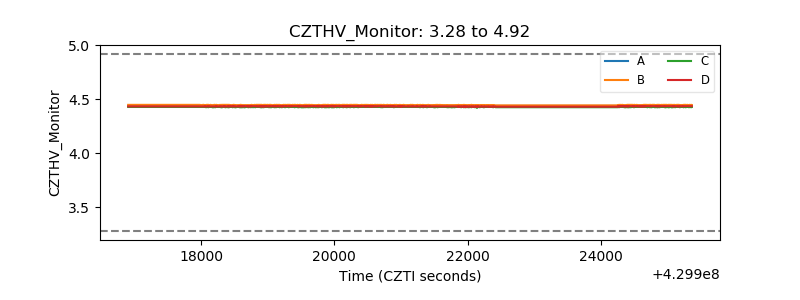 |
| D_VDD | 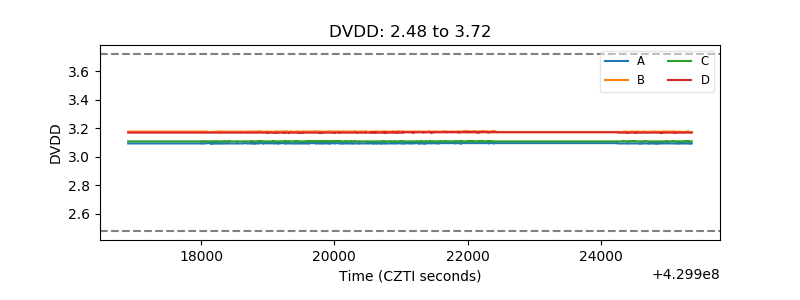 |
| Temperature 1 | 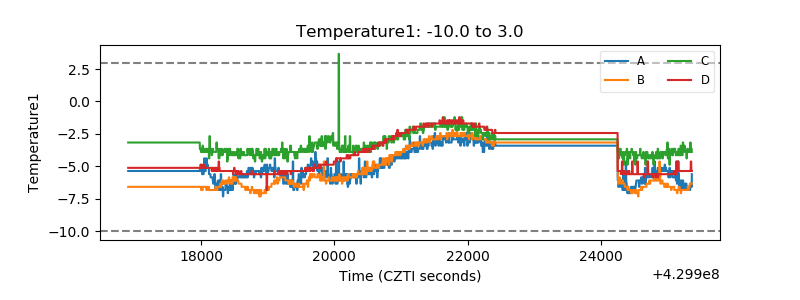 |
| Veto HV Monitor | 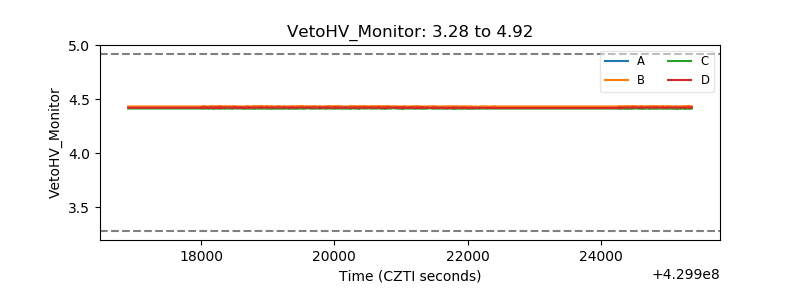 |
| Veto LLD | 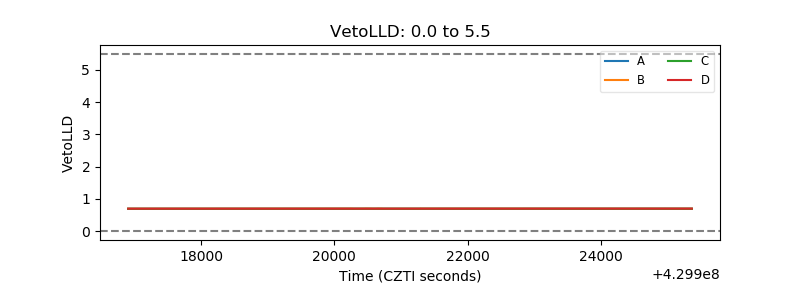 |
| Alpha Counter | 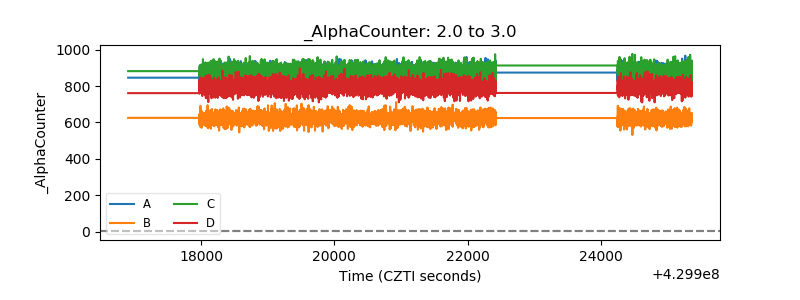 |
| _CPM_Rate | 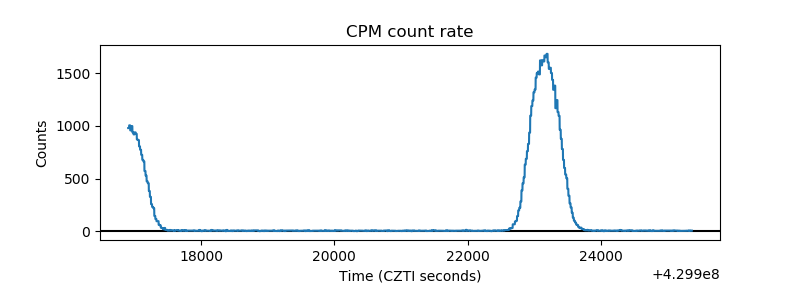 |
| CZT Counter | 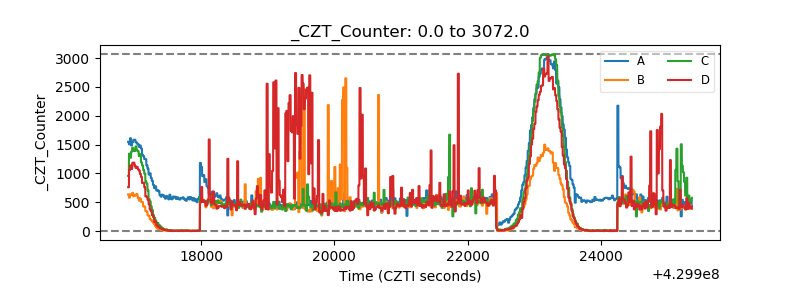 |
| +2.5 Volts monitor |  |
| +5 Volts monitor | 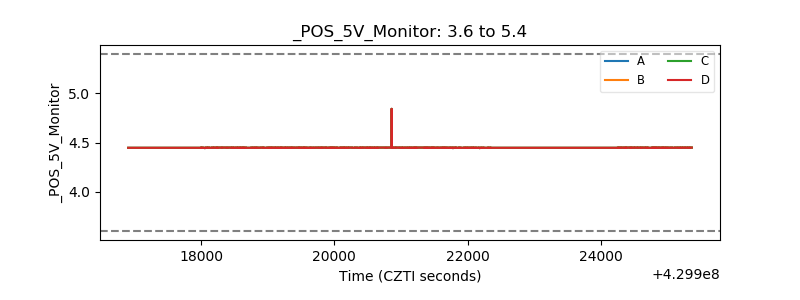 |
| _ROLL_ROT | 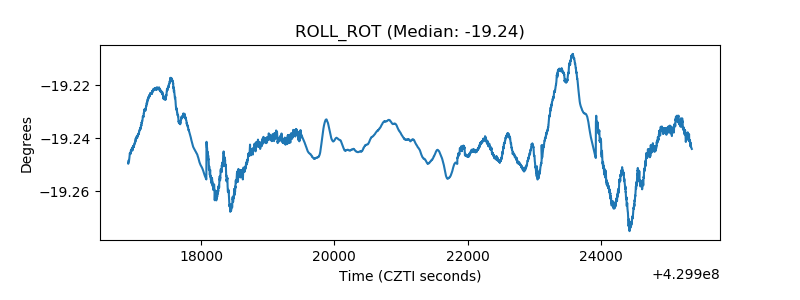 |
| _Roll_DEC | 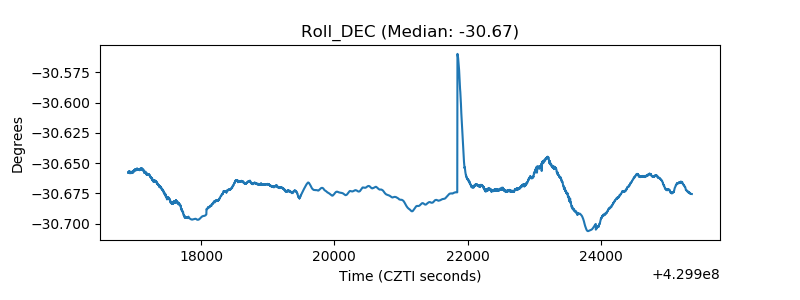 |
| _Roll_RA | 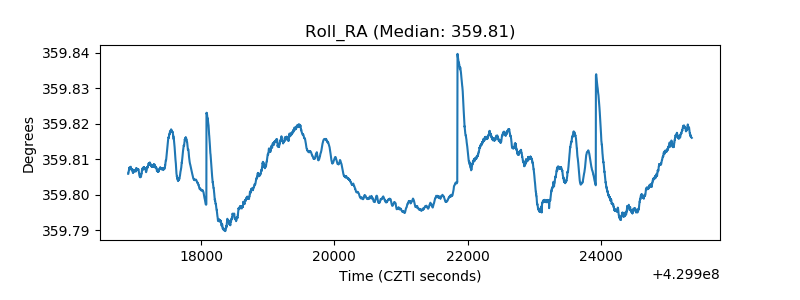 |
| Veto Counter | 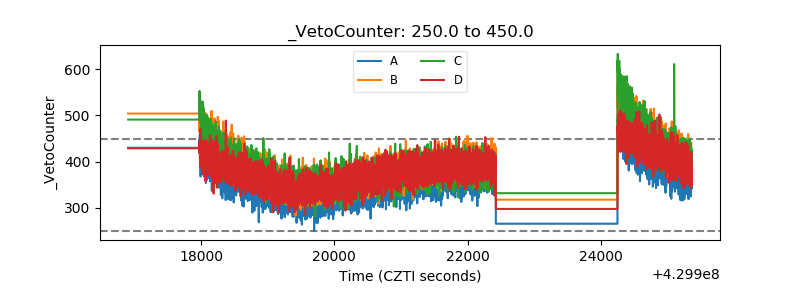 |