| Param | Original file | Final file |
|---|---|---|
| Filename | modeM0/AS1A05_174T01_9000005820_42632cztM0_level2.fits | modeM0/AS1A05_174T01_9000005820_42632cztM0_level2_quad_clean.evt |
| Size (bytes) | 316,604,160 | 95,944,320 |
| Size | 301.9 MB | 91.5 MB |
| Events in quadrant A | 2,960,450 | 640,591 |
| Events in quadrant B | 2,524,716 | 665,132 |
| Events in quadrant C | 2,829,661 | 641,092 |
| Events in quadrant D | 2,981,888 | 578,940 |
| Mode M9 | |||
|---|---|---|---|
| Quadrant | BADHDUFLAG | Total packets | Discarded packets |
| A | 0 | 25 | 0 |
| B | 0 | 26 | 0 |
| C | 0 | 26 | 0 |
| D | 0 | 26 | 0 |
| Mode SS | |||
|---|---|---|---|
| Quadrant | BADHDUFLAG | Total packets | Discarded packets |
| A | 0 | 110 | 0 |
| B | 0 | 110 | 0 |
| C | 0 | 110 | 0 |
| D | 0 | 110 | 0 |
| Mode M0 | |||
|---|---|---|---|
| Quadrant | BADHDUFLAG | Total packets | Discarded packets |
| A | 0 | 11954 | 2 |
| B | 0 | 11034 | 2 |
| C | 0 | 11474 | 2 |
| D | 0 | 12609 | 2 |
| Quadrant | Total seconds | Saturated seconds | Saturation percentage |
|---|---|---|---|
| A | 5426 | 11 | 0.202728% |
| B | 5426 | 6 | 0.110579% |
| C | 5426 | 7 | 0.129008% |
| D | 5426 | 92 | 1.695540% |
Noise dominated data is calculated using 1-second bins in cleaned event files. If a bin has >2000 counts, and if more than 50% of those come from <1% of pixels, then it is considered to be noise-dominated and hence unusable.
| Quadrant | # 1 sec bins | Bins with >0 counts | Bins with >2000 counts | High rate bins dominated by noise | Noise dominated (total time) | Noise dominated (detector-on time) | Marked lightcurve |
|---|---|---|---|---|---|---|---|
| A | 7369 | 5427 | 1 | 1 | 0.01% | 0.02% | 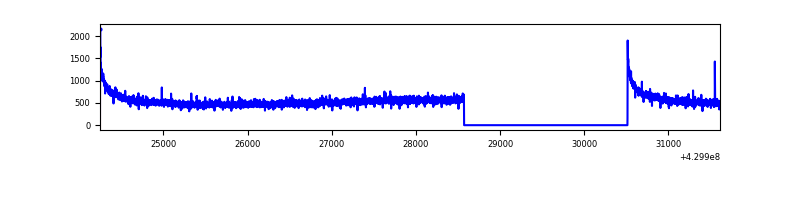 |
| B | 7369 | 5427 | 1 | 1 | 0.01% | 0.02% | 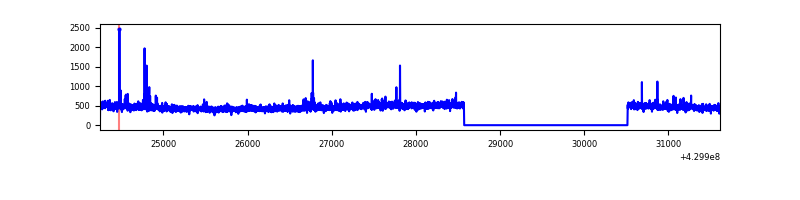 |
| C | 7369 | 5427 | 4 | 4 | 0.05% | 0.07% | 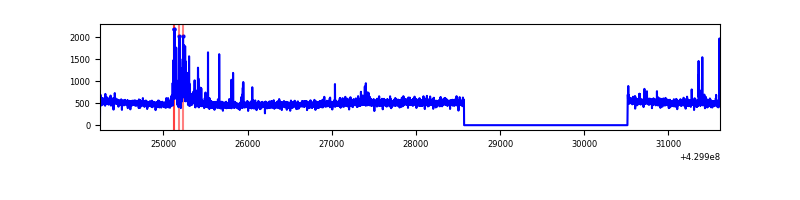 |
| D | 7369 | 5427 | 88 | 88 | 1.19% | 1.62% | 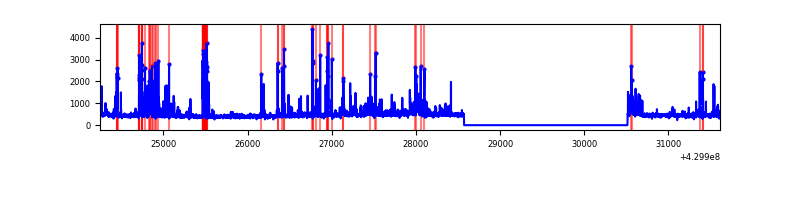 |
Top three noisy pixels from each quadrant. If the there are fewer than three noisy pixels in the level2.evt file, extra rows are filled as -1
| Pixel properties | Quadrant properties | ||||||
|---|---|---|---|---|---|---|---|
| Quadrant | DetID | PixID | Counts | Sigma | Mean | Median | Sigma |
| A | 10 | 83 | 550775 | 4309.71 | 620 | 606 | 127.7 |
| A | 13 | 254 | 6820 | 48.68 | 620 | 606 | 127.7 |
| A | 3 | 137 | 6621 | 47.12 | 620 | 606 | 127.7 |
| B | 0 | 245 | 74364 | 616.53 | 618 | 600 | 119.6 |
| B | 7 | 202 | 16149 | 129.96 | 618 | 600 | 119.6 |
| B | 12 | 111 | 14970 | 120.11 | 618 | 600 | 119.6 |
| C | 15 | 214 | 227593 | 1570.42 | 619 | 623 | 144.5 |
| C | 14 | 254 | 172300 | 1187.84 | 619 | 623 | 144.5 |
| C | 3 | 233 | 15106 | 100.21 | 619 | 623 | 144.5 |
| D | 12 | 6 | 375188 | 2507.98 | 612 | 597 | 149.4 |
| D | 13 | 249 | 135800 | 905.22 | 612 | 597 | 149.4 |
| D | 1 | 47 | 57984 | 384.22 | 612 | 597 | 149.4 |
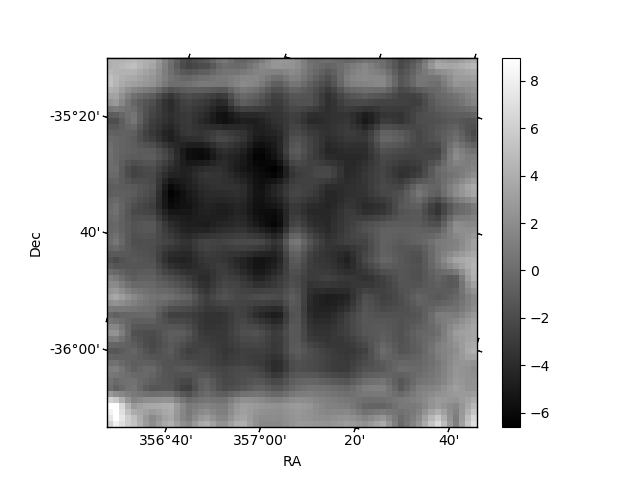
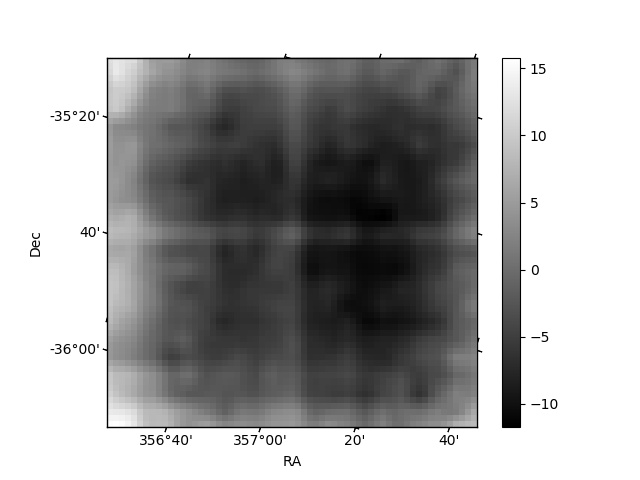
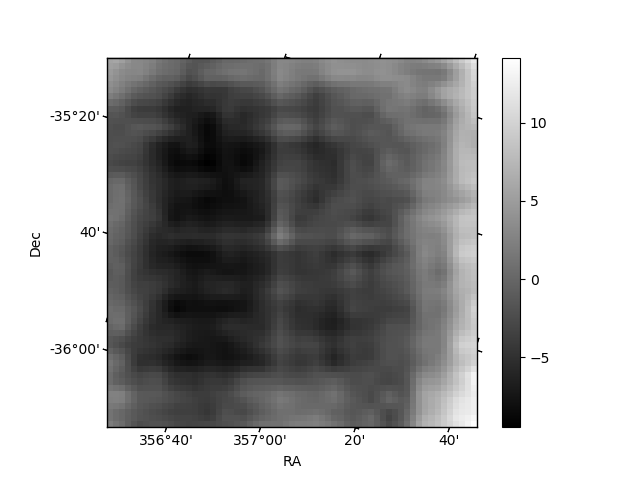
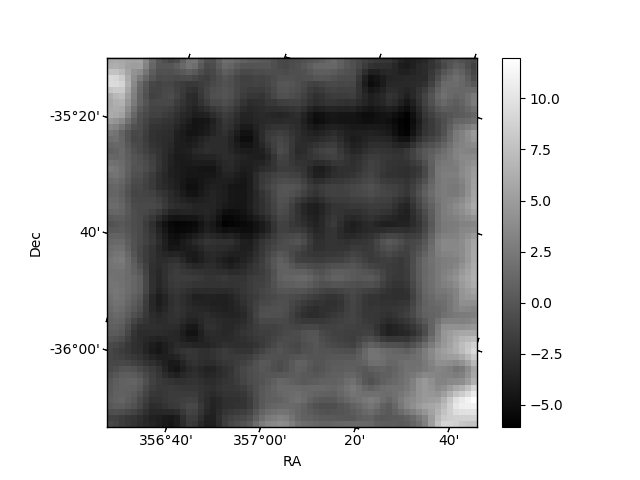
Histogram calculated using DETX and DETY for each event in the final _common_clean file
| Quadrant A | 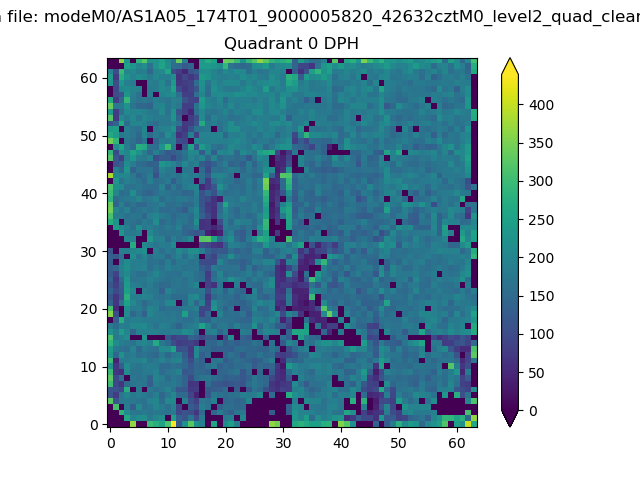 |
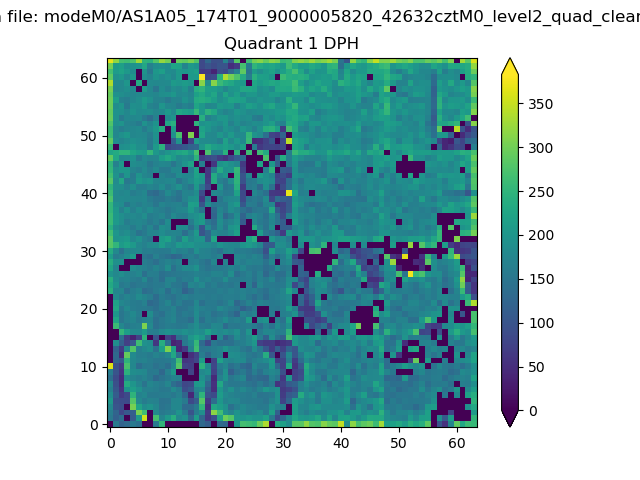 |
Quadrant B |
|---|---|---|---|
| Quadrant D | 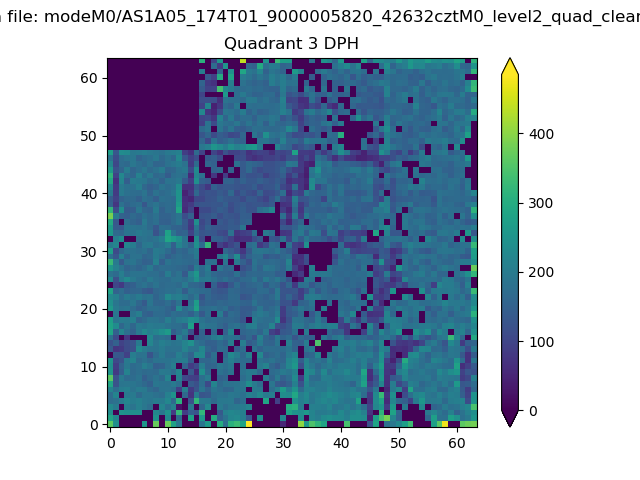 |
 |
Quadrant C |
| Plot type | Count rate plots | Images |
|---|---|---|
| Comparison with Poisson distribution Blue bars denote a histogram of data divided into 1 sec bins. Red curve is a Poisson curve with rate = median count rate of data. |
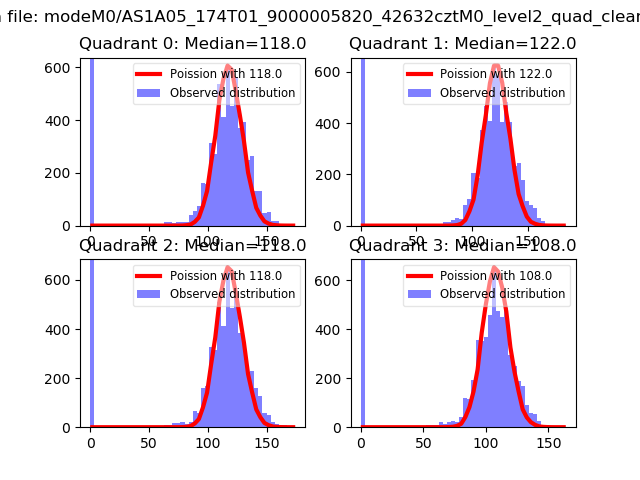 |
 |
| Quadrant-wise count rates Data is divided into 100 sec bins |
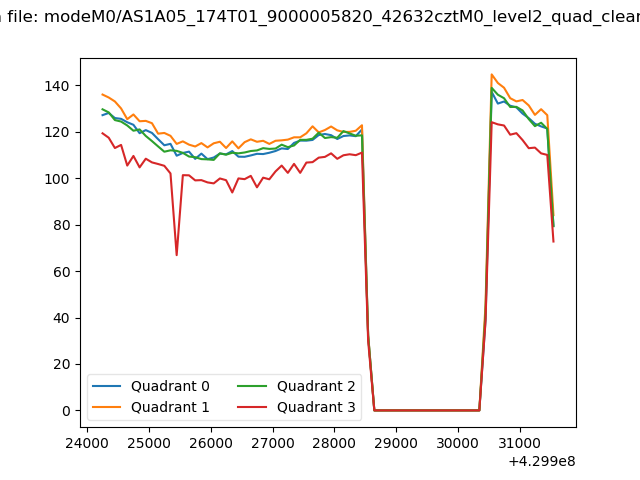 |
|
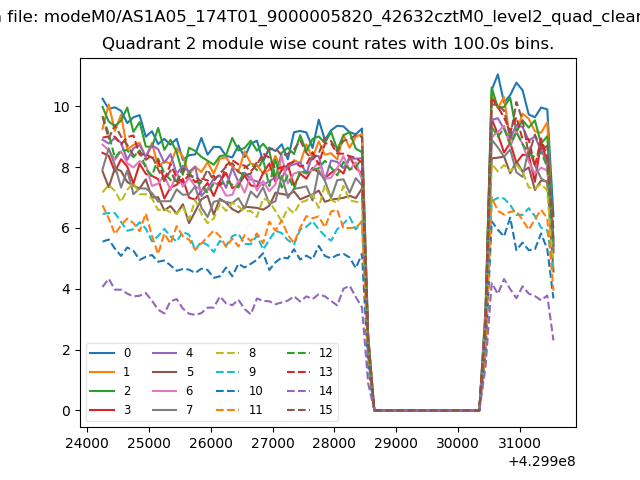
| Module-wise count rates for Quadrant A Data is divided into 100 sec bins |
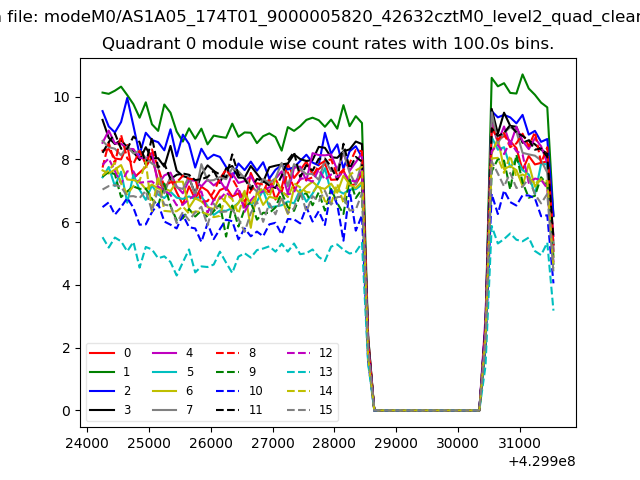 |
 |
| Module-wise count rates for Quadrant B Data is divided into 100 sec bins |
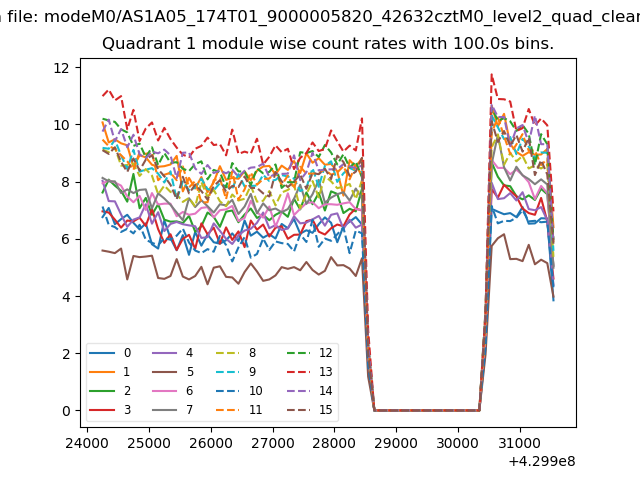 |
 |
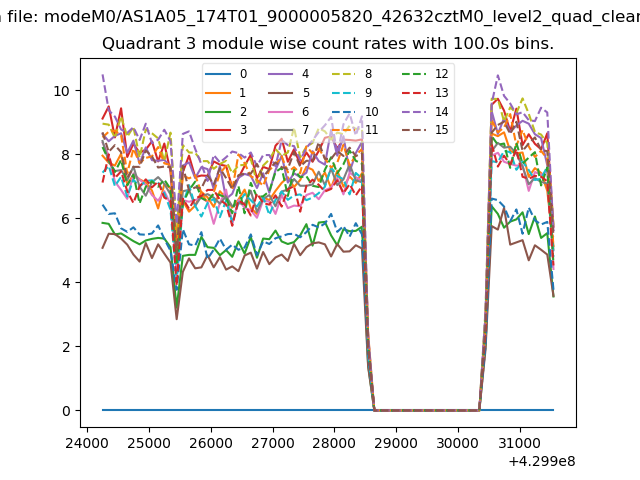
| Module-wise count rates for Quadrant C Data is divided into 100 sec bins |
 |
 |
| Module-wise count rates for Quadrant D Data is divided into 100 sec bins |
 |
 |
| Parameter | Plot |
|---|---|
| CZT HV Monitor | 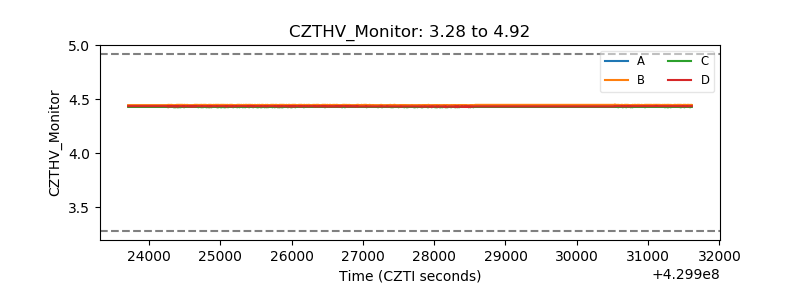 |
| D_VDD | 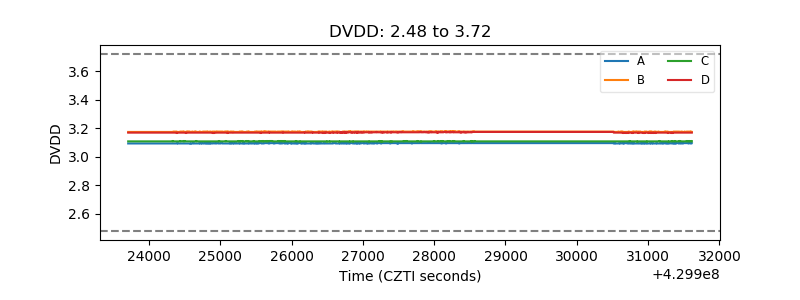 |
| Temperature 1 | 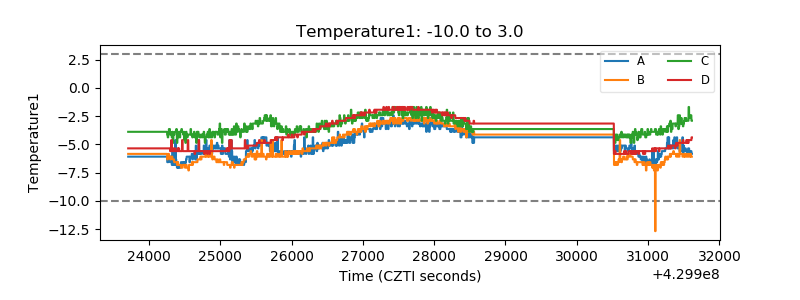 |
| Veto HV Monitor | 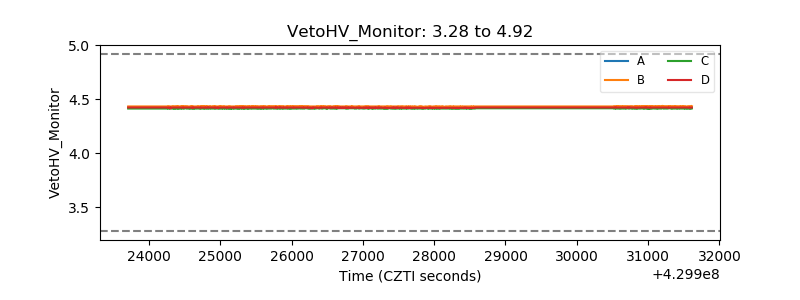 |
| Veto LLD | 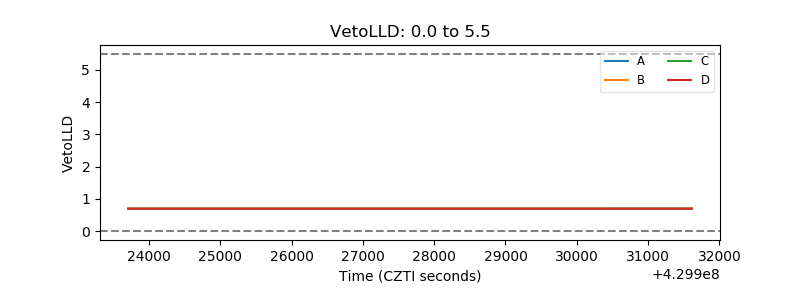 |
| Alpha Counter | 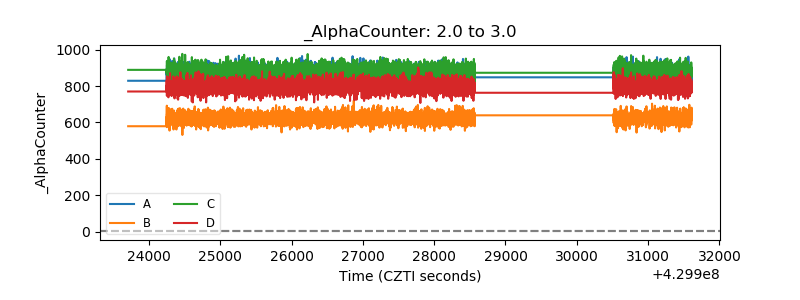 |
| _CPM_Rate | 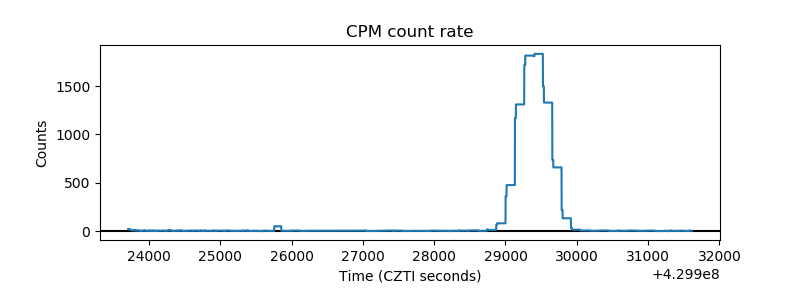 |
| CZT Counter | 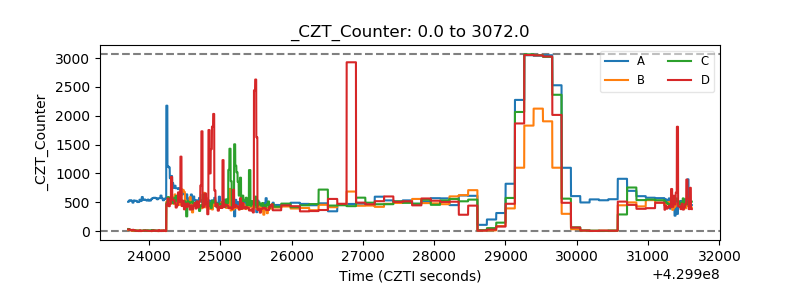 |
| +2.5 Volts monitor |  |
| +5 Volts monitor | 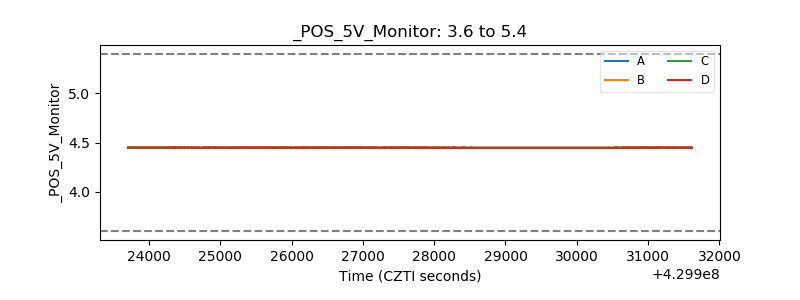 |
| _ROLL_ROT | 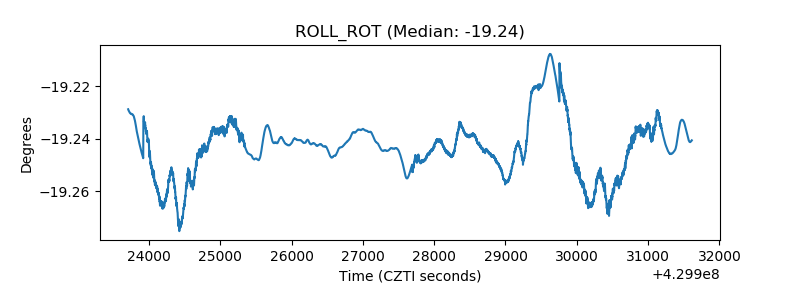 |
| _Roll_DEC | 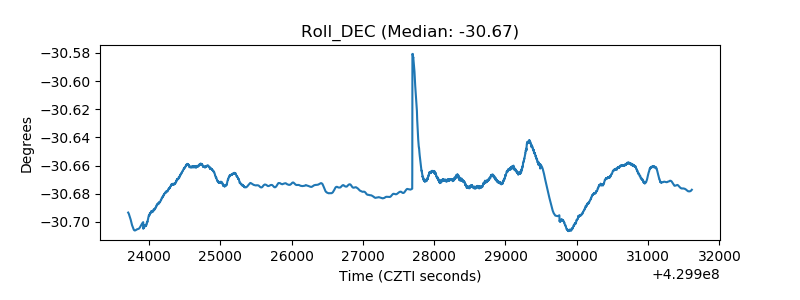 |
| _Roll_RA | 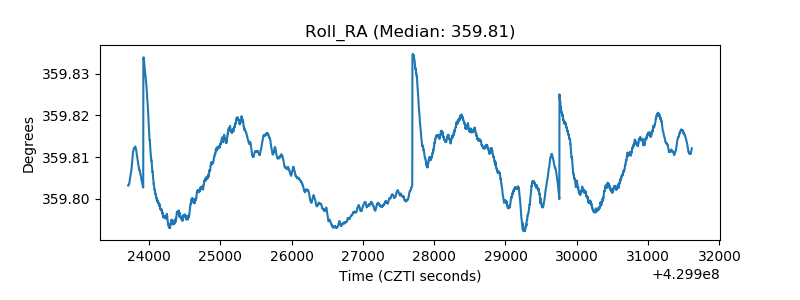 |
| Veto Counter | 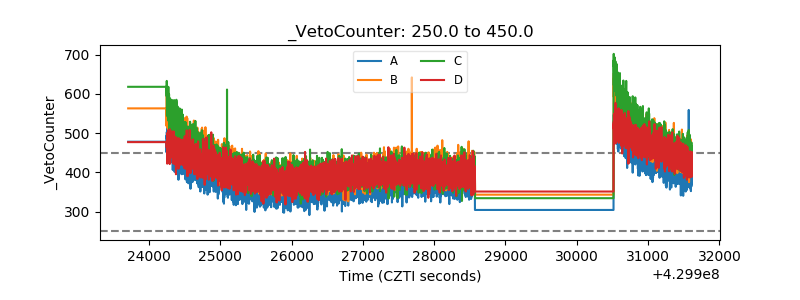 |