| Param | Original file | Final file |
|---|---|---|
| Filename | modeM0/AS1A05_174T01_9000005820_42633cztM0_level2.fits | modeM0/AS1A05_174T01_9000005820_42633cztM0_level2_quad_clean.evt |
| Size (bytes) | 313,309,440 | 90,887,040 |
| Size | 298.8 MB | 86.7 MB |
| Events in quadrant A | 2,833,971 | 612,318 |
| Events in quadrant B | 2,464,291 | 634,518 |
| Events in quadrant C | 2,793,629 | 612,202 |
| Events in quadrant D | 3,115,140 | 542,018 |
| Mode M9 | |||
|---|---|---|---|
| Quadrant | BADHDUFLAG | Total packets | Discarded packets |
| A | 0 | 33 | 0 |
| B | 0 | 34 | 0 |
| C | 0 | 34 | 0 |
| D | 0 | 34 | 0 |
| Mode SS | |||
|---|---|---|---|
| Quadrant | BADHDUFLAG | Total packets | Discarded packets |
| A | 0 | 102 | 0 |
| B | 0 | 102 | 0 |
| C | 0 | 102 | 0 |
| D | 0 | 102 | 0 |
| Mode M0 | |||
|---|---|---|---|
| Quadrant | BADHDUFLAG | Total packets | Discarded packets |
| A | 0 | 11347 | 2 |
| B | 0 | 10444 | 2 |
| C | 0 | 11199 | 2 |
| D | 0 | 12622 | 2 |
| Quadrant | Total seconds | Saturated seconds | Saturation percentage |
|---|---|---|---|
| A | 5012 | 12 | 0.239425% |
| B | 5012 | 22 | 0.438947% |
| C | 5012 | 10 | 0.199521% |
| D | 5012 | 206 | 4.110136% |
Noise dominated data is calculated using 1-second bins in cleaned event files. If a bin has >2000 counts, and if more than 50% of those come from <1% of pixels, then it is considered to be noise-dominated and hence unusable.
| Quadrant | # 1 sec bins | Bins with >0 counts | Bins with >2000 counts | High rate bins dominated by noise | Noise dominated (total time) | Noise dominated (detector-on time) | Marked lightcurve |
|---|---|---|---|---|---|---|---|
| A | 7045 | 5013 | 1 | 1 | 0.01% | 0.02% | 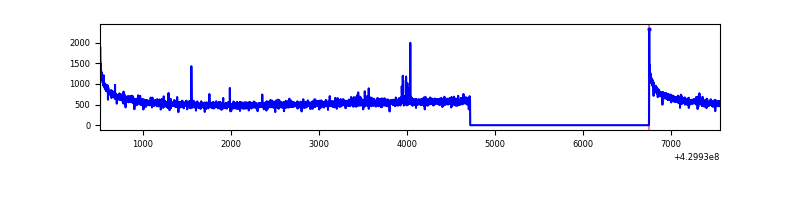 |
| B | 7045 | 5013 | 13 | 13 | 0.18% | 0.26% | 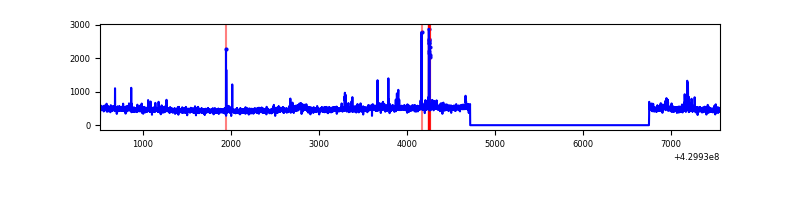 |
| C | 7045 | 5013 | 8 | 8 | 0.11% | 0.16% | 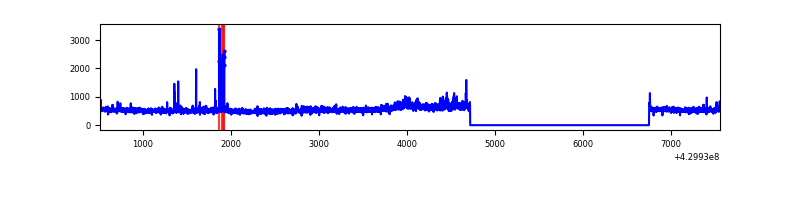 |
| D | 7045 | 5013 | 180 | 180 | 2.56% | 3.59% | 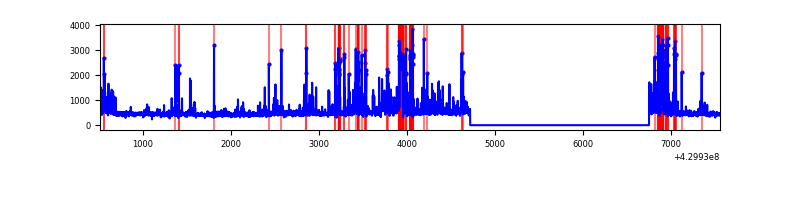 |
Top three noisy pixels from each quadrant. If the there are fewer than three noisy pixels in the level2.evt file, extra rows are filled as -1
| Pixel properties | Quadrant properties | ||||||
|---|---|---|---|---|---|---|---|
| Quadrant | DetID | PixID | Counts | Sigma | Mean | Median | Sigma |
| A | 10 | 83 | 525910 | 4360.47 | 590 | 578 | 120.5 |
| A | 2 | 79 | 14808 | 118.11 | 590 | 578 | 120.5 |
| A | 13 | 248 | 11461 | 90.33 | 590 | 578 | 120.5 |
| B | 0 | 245 | 91385 | 809.3 | 586 | 569 | 112.2 |
| B | 0 | 168 | 49620 | 437.11 | 586 | 569 | 112.2 |
| B | 7 | 202 | 24043 | 209.19 | 586 | 569 | 112.2 |
| C | 3 | 233 | 211879 | 1545.49 | 587 | 592 | 136.7 |
| C | 15 | 214 | 211403 | 1542.01 | 587 | 592 | 136.7 |
| C | 14 | 254 | 81556 | 592.22 | 587 | 592 | 136.7 |
| D | 13 | 249 | 358125 | 2596.95 | 571 | 557 | 137.7 |
| D | 12 | 6 | 267259 | 1937.0 | 571 | 557 | 137.7 |
| D | 1 | 52 | 205601 | 1489.19 | 571 | 557 | 137.7 |
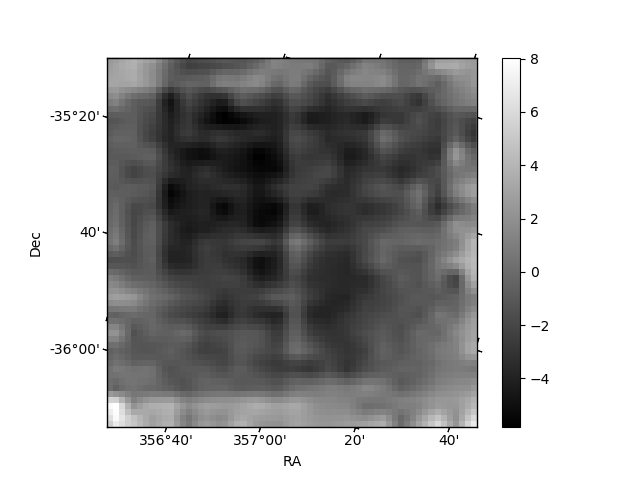
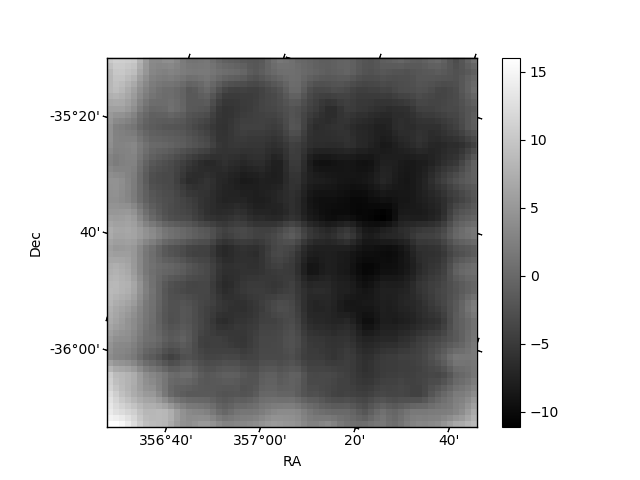
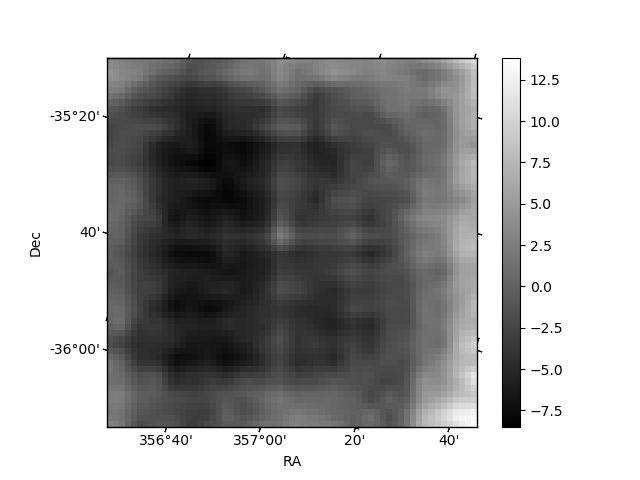
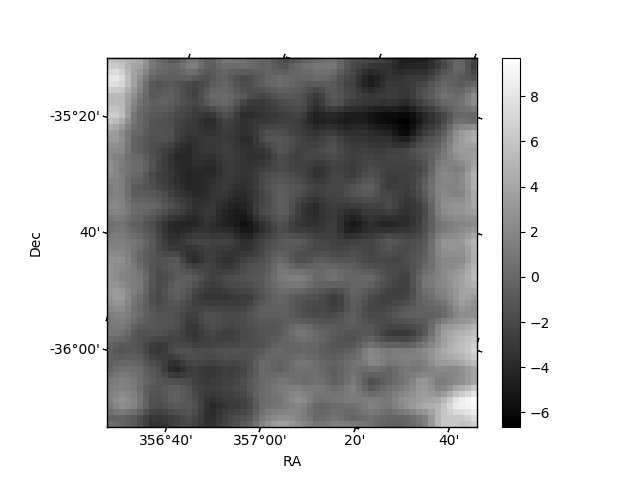
Histogram calculated using DETX and DETY for each event in the final _common_clean file
| Quadrant A | 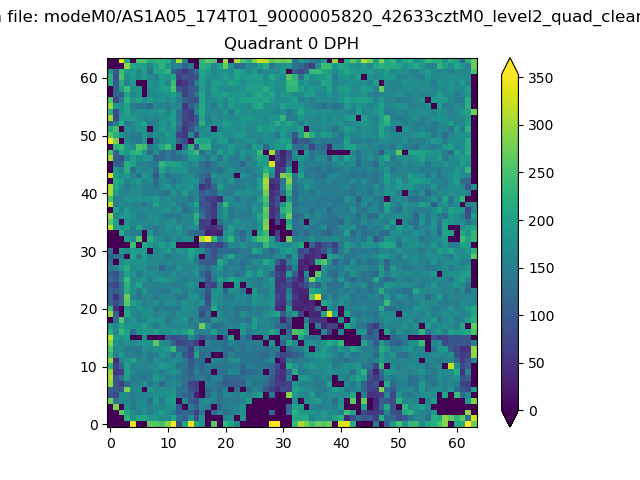 |
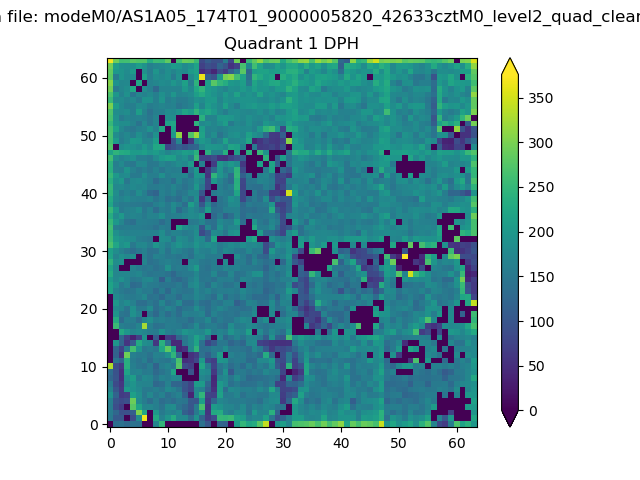 |
Quadrant B |
|---|---|---|---|
| Quadrant D | 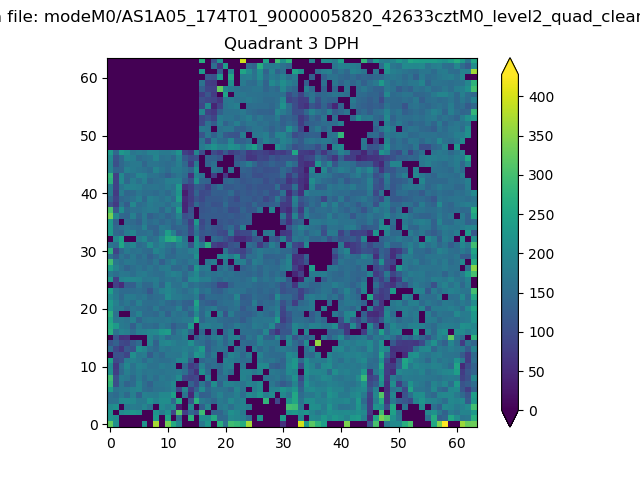 |
 |
Quadrant C |
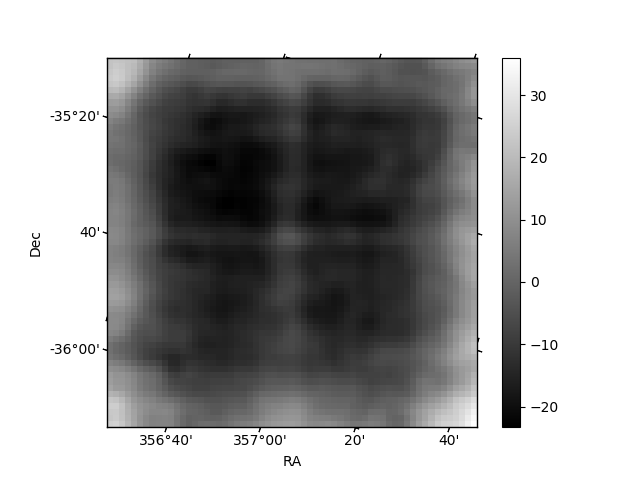
| Plot type | Count rate plots | Images |
|---|---|---|
| Comparison with Poisson distribution Blue bars denote a histogram of data divided into 1 sec bins. Red curve is a Poisson curve with rate = median count rate of data. |
 |
 |
| Quadrant-wise count rates Data is divided into 100 sec bins |
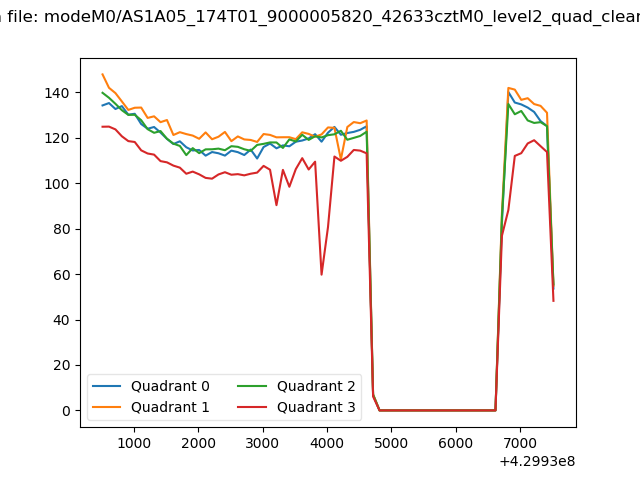 |
|
| Module-wise count rates for Quadrant A Data is divided into 100 sec bins |
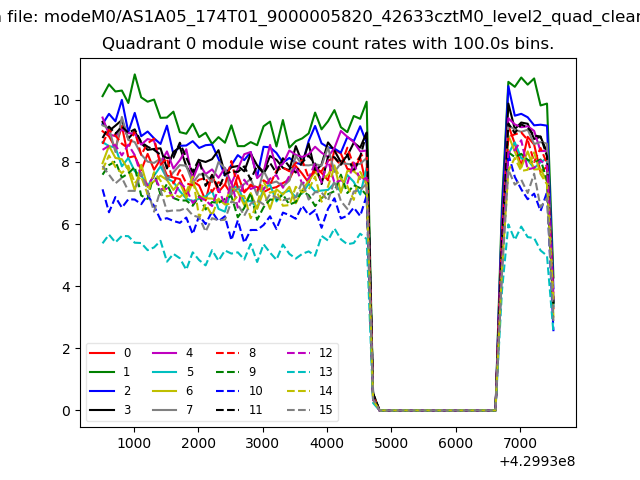 |
 |
| Module-wise count rates for Quadrant B Data is divided into 100 sec bins |
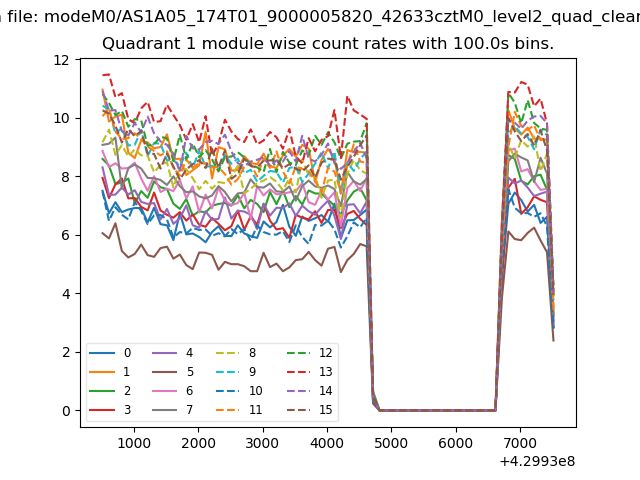 |
 |
| Module-wise count rates for Quadrant C Data is divided into 100 sec bins |
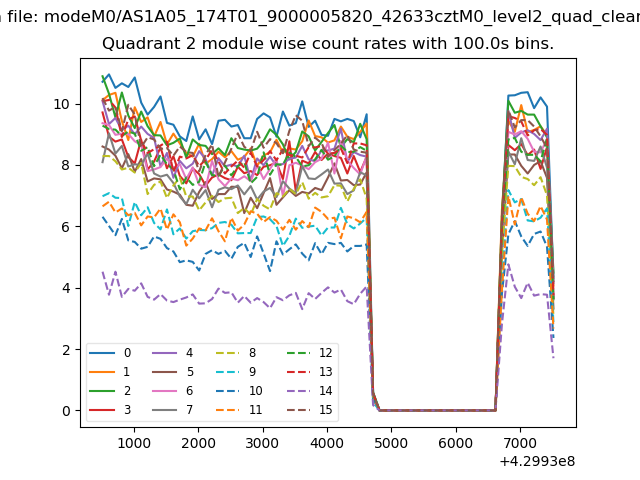 |
 |
| Module-wise count rates for Quadrant D Data is divided into 100 sec bins |
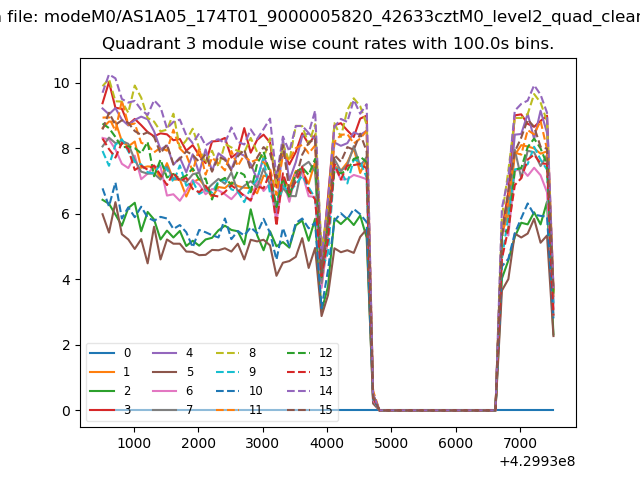 |
 |
| Parameter | Plot |
|---|---|
| CZT HV Monitor | 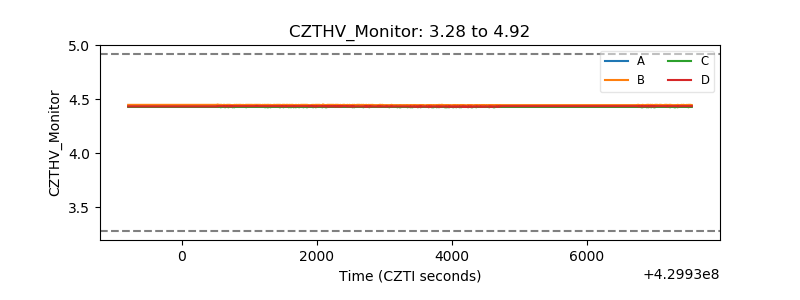 |
| D_VDD | 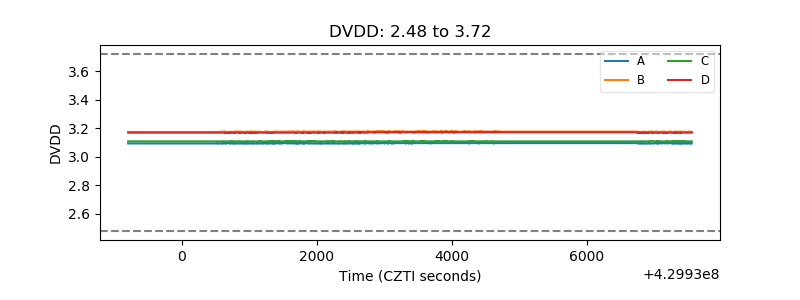 |
| Temperature 1 | 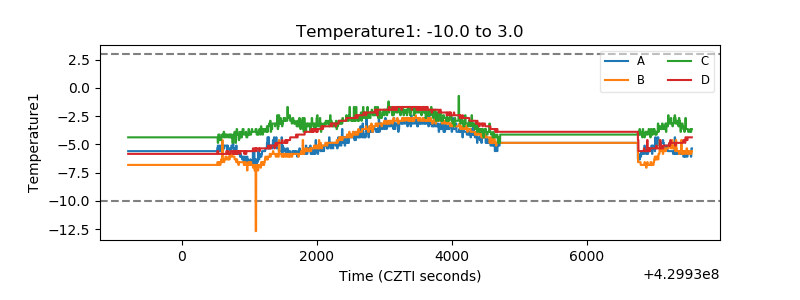 |
| Veto HV Monitor | 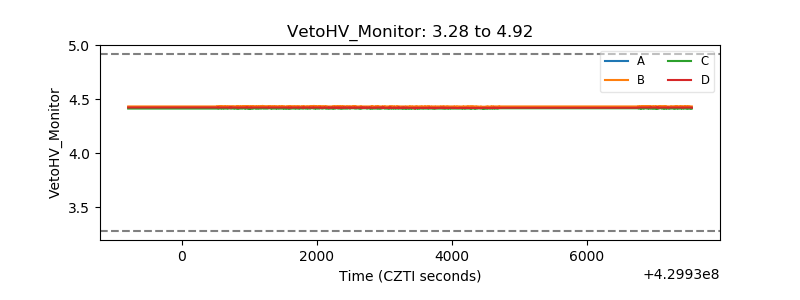 |
| Veto LLD | 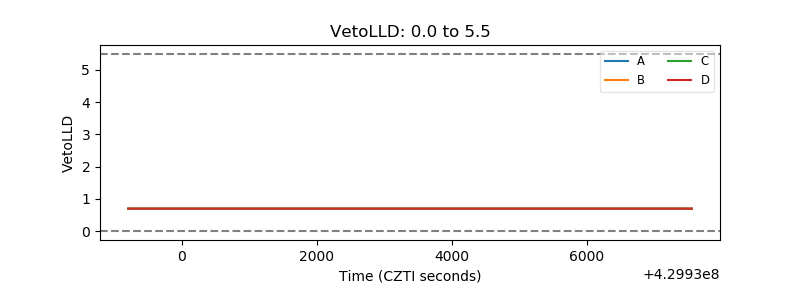 |
| Alpha Counter | 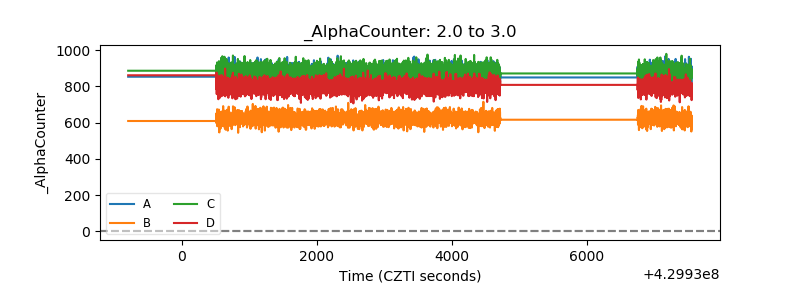 |
| _CPM_Rate | 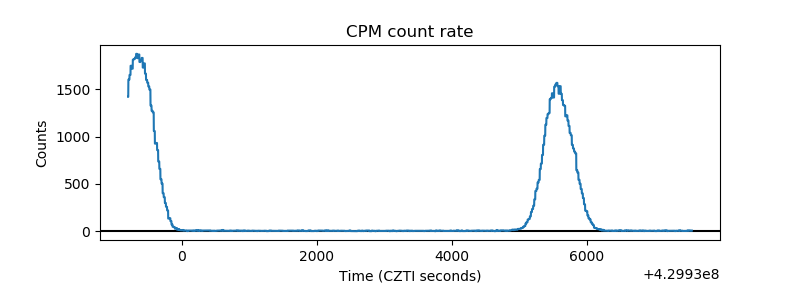 |
| CZT Counter |  |
| +2.5 Volts monitor | 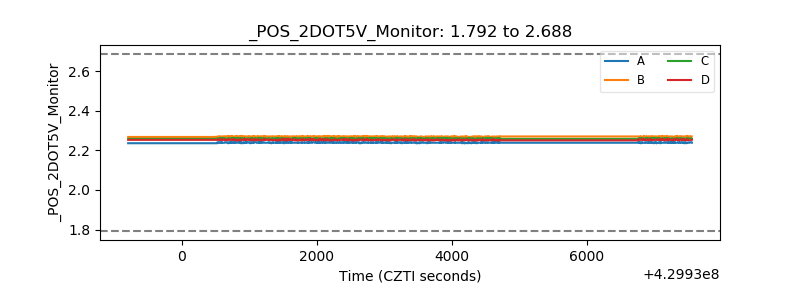 |
| +5 Volts monitor | 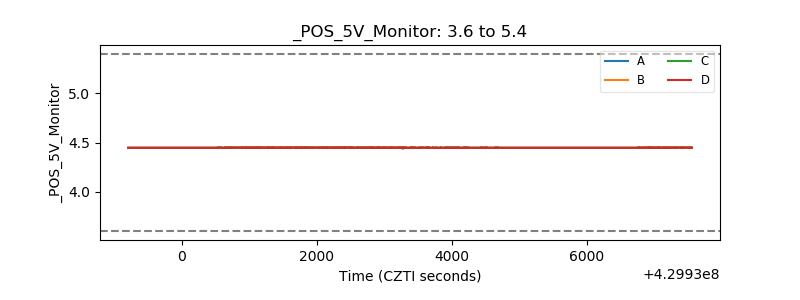 |
| _ROLL_ROT | 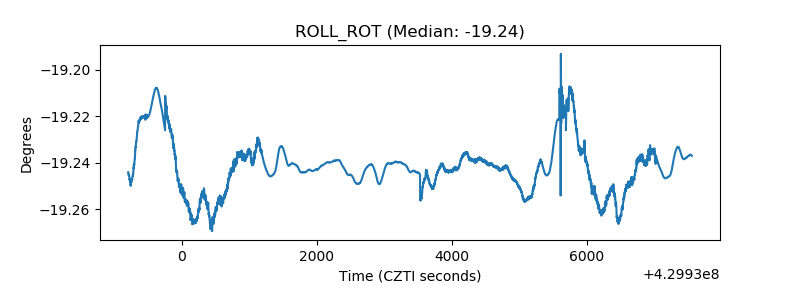 |
| _Roll_DEC | 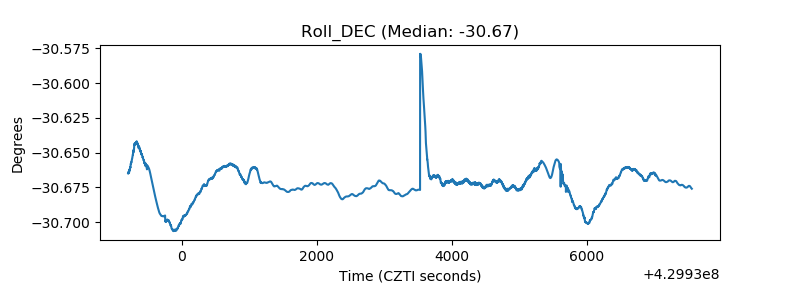 |
| _Roll_RA | 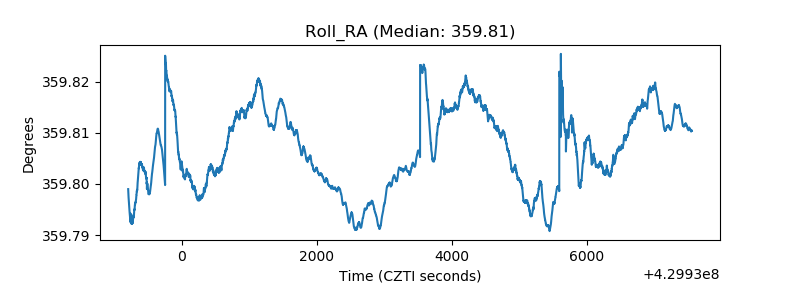 |
| Veto Counter | 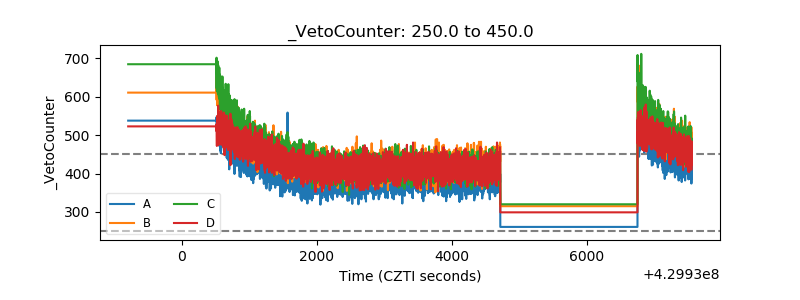 |