| Param | Original file | Final file |
|---|---|---|
| Filename | modeM0/AS1A05_174T01_9000005820_42634cztM0_level2.fits | modeM0/AS1A05_174T01_9000005820_42634cztM0_level2_quad_clean.evt |
| Size (bytes) | 321,998,400 | 87,984,000 |
| Size | 307.1 MB | 83.9 MB |
| Events in quadrant A | 2,768,841 | 597,311 |
| Events in quadrant B | 2,351,328 | 614,214 |
| Events in quadrant C | 2,557,004 | 592,131 |
| Events in quadrant D | 3,861,651 | 518,329 |
| Mode M9 | |||
|---|---|---|---|
| Quadrant | BADHDUFLAG | Total packets | Discarded packets |
| A | 0 | 30 | 0 |
| B | 0 | 31 | 0 |
| C | 0 | 31 | 0 |
| D | 0 | 31 | 0 |
| Mode SS | |||
|---|---|---|---|
| Quadrant | BADHDUFLAG | Total packets | Discarded packets |
| A | 0 | 98 | 0 |
| B | 0 | 98 | 0 |
| C | 0 | 98 | 0 |
| D | 0 | 98 | 0 |
| Mode M0 | |||
|---|---|---|---|
| Quadrant | BADHDUFLAG | Total packets | Discarded packets |
| A | 0 | 10964 | 2 |
| B | 0 | 9998 | 2 |
| C | 0 | 10170 | 2 |
| D | 0 | 14703 | 2 |
| Quadrant | Total seconds | Saturated seconds | Saturation percentage |
|---|---|---|---|
| A | 4886 | 8 | 0.163733% |
| B | 4886 | 6 | 0.122800% |
| C | 4886 | 16 | 0.327466% |
| D | 4886 | 314 | 6.426525% |
Noise dominated data is calculated using 1-second bins in cleaned event files. If a bin has >2000 counts, and if more than 50% of those come from <1% of pixels, then it is considered to be noise-dominated and hence unusable.
| Quadrant | # 1 sec bins | Bins with >0 counts | Bins with >2000 counts | High rate bins dominated by noise | Noise dominated (total time) | Noise dominated (detector-on time) | Marked lightcurve |
|---|---|---|---|---|---|---|---|
| A | 7009 | 4887 | 2 | 2 | 0.03% | 0.04% | 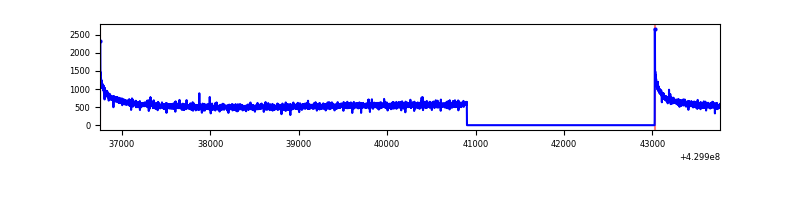 |
| B | 7009 | 4887 | 0 | 0 | 0.00% | 0.00% | 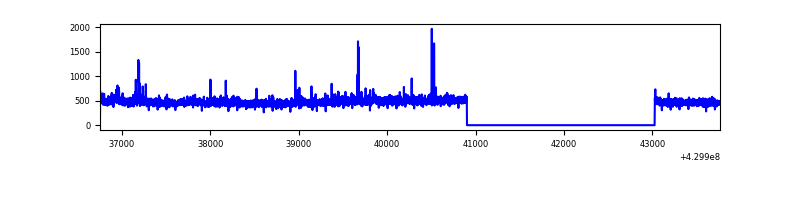 |
| C | 7009 | 4887 | 10 | 10 | 0.14% | 0.20% | 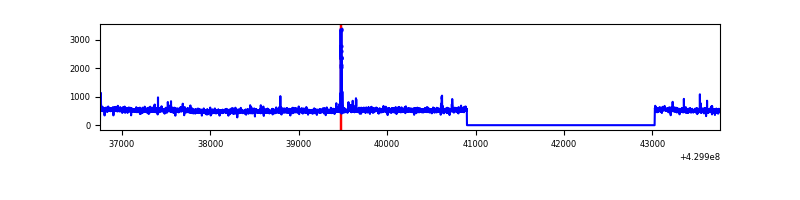 |
| D | 7009 | 4887 | 275 | 275 | 3.92% | 5.63% | 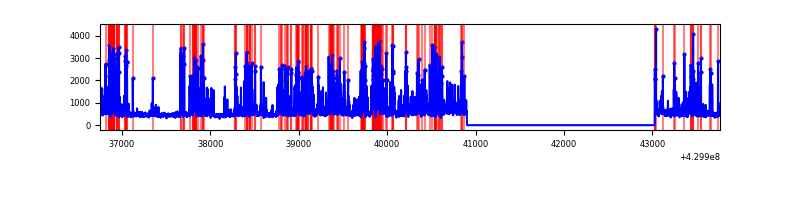 |
Top three noisy pixels from each quadrant. If the there are fewer than three noisy pixels in the level2.evt file, extra rows are filled as -1
| Pixel properties | Quadrant properties | ||||||
|---|---|---|---|---|---|---|---|
| Quadrant | DetID | PixID | Counts | Sigma | Mean | Median | Sigma |
| A | 10 | 83 | 522181 | 4392.96 | 579 | 569 | 118.7 |
| A | 2 | 79 | 6843 | 52.84 | 579 | 569 | 118.7 |
| A | 13 | 254 | 6467 | 49.67 | 579 | 569 | 118.7 |
| B | 0 | 245 | 60463 | 545.18 | 572 | 557 | 109.9 |
| B | 0 | 168 | 25575 | 227.68 | 572 | 557 | 109.9 |
| B | 12 | 111 | 13758 | 120.14 | 572 | 557 | 109.9 |
| C | 15 | 214 | 207014 | 1556.19 | 571 | 576 | 132.7 |
| C | 14 | 254 | 67003 | 500.75 | 571 | 576 | 132.7 |
| C | 3 | 233 | 49363 | 367.77 | 571 | 576 | 132.7 |
| D | 2 | 249 | 644203 | 4722.08 | 557 | 541 | 136.3 |
| D | 12 | 6 | 312102 | 2285.7 | 557 | 541 | 136.3 |
| D | 1 | 52 | 263032 | 1925.71 | 557 | 541 | 136.3 |
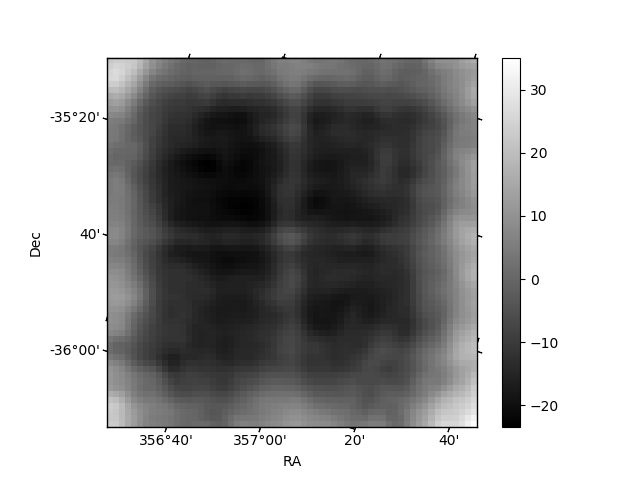
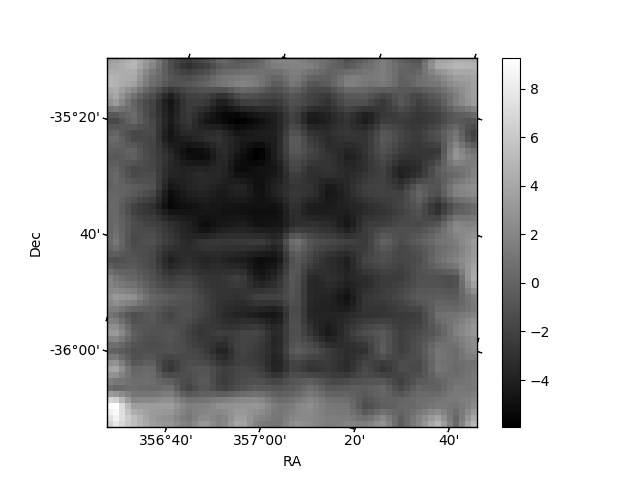
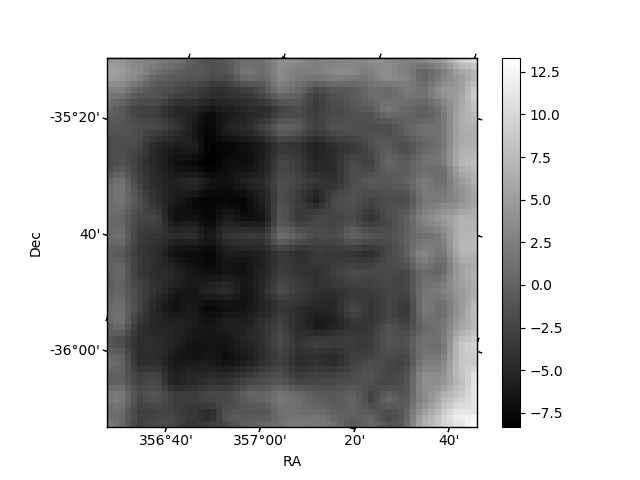
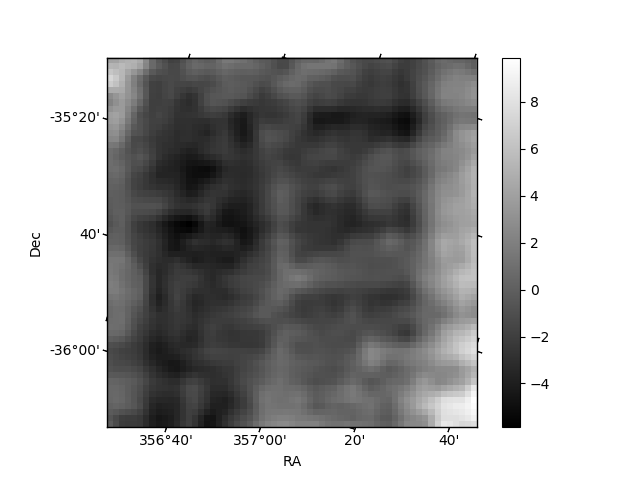
Histogram calculated using DETX and DETY for each event in the final _common_clean file
| Quadrant A | 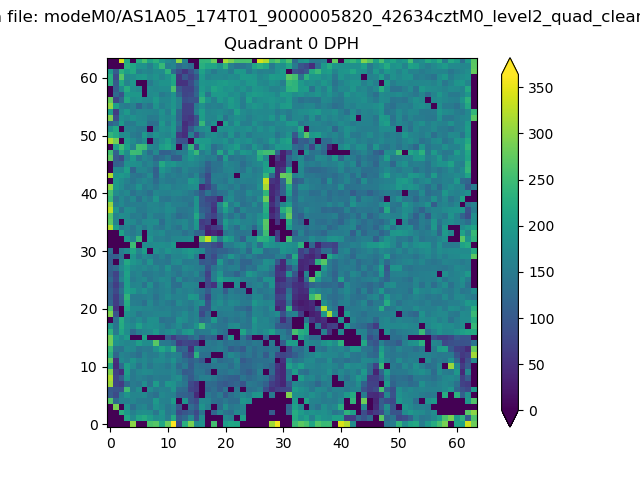 |
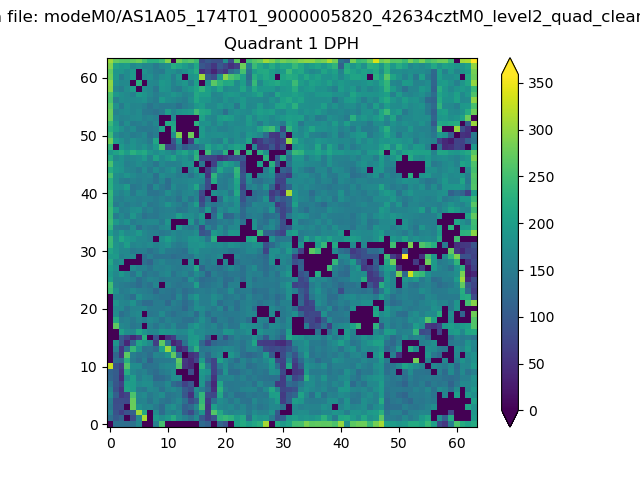 |
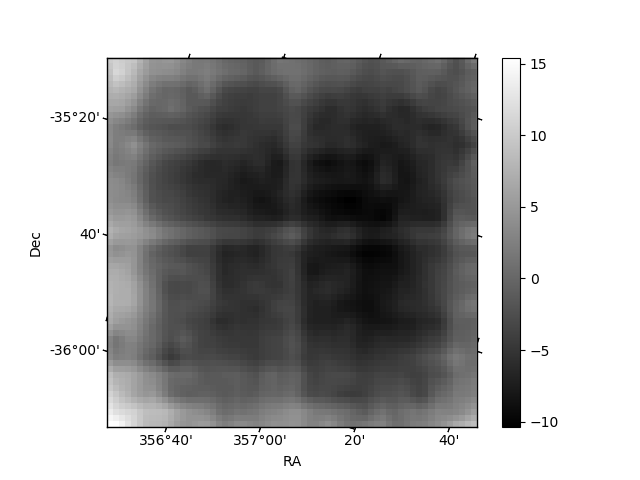
Quadrant B |
|---|---|---|---|
| Quadrant D | 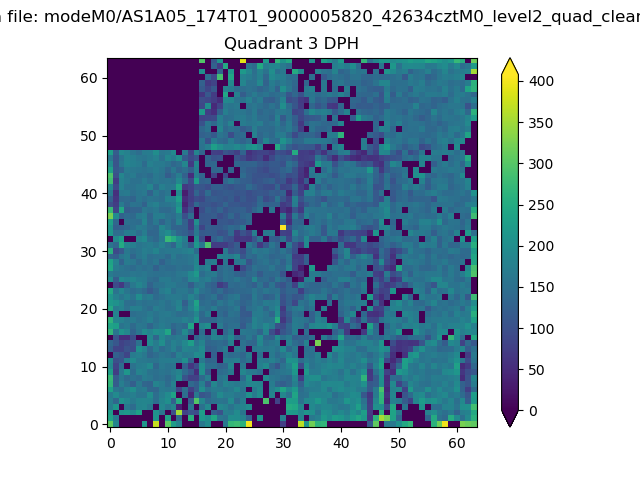 |
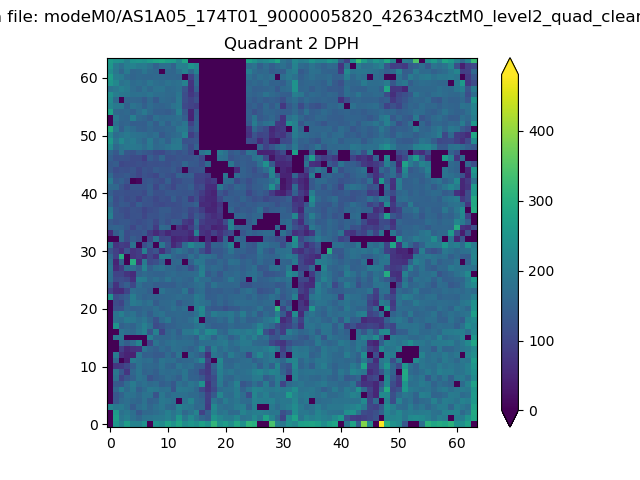 |
Quadrant C |
| Plot type | Count rate plots | Images |
|---|---|---|
| Comparison with Poisson distribution Blue bars denote a histogram of data divided into 1 sec bins. Red curve is a Poisson curve with rate = median count rate of data. |
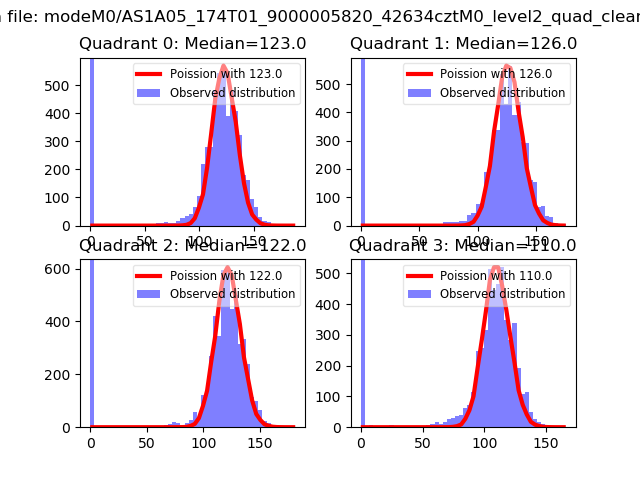 |
 |
| Quadrant-wise count rates Data is divided into 100 sec bins |
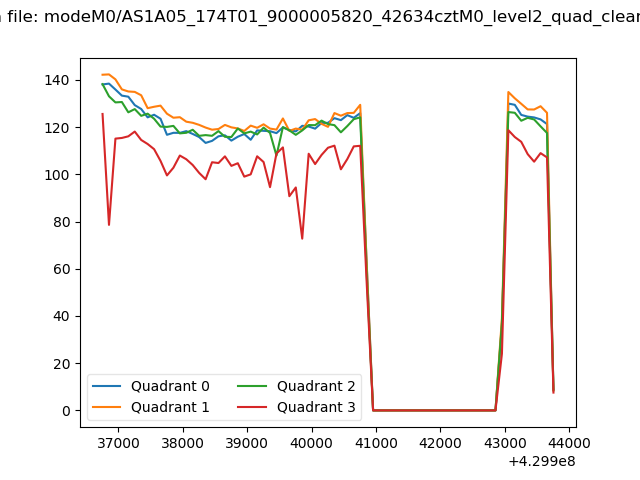 |
|
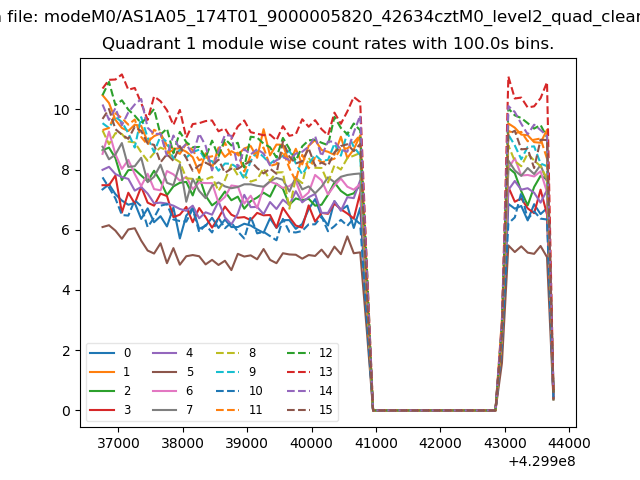
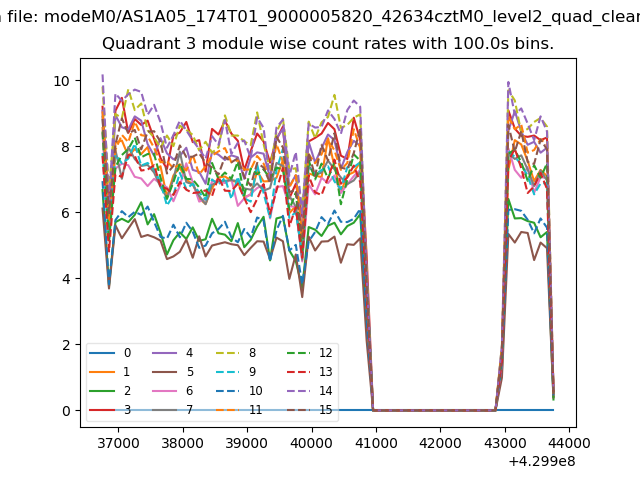
| Module-wise count rates for Quadrant A Data is divided into 100 sec bins |
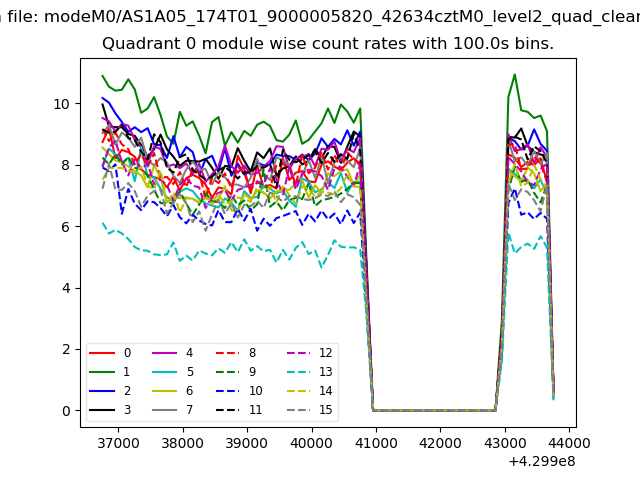 |
 |
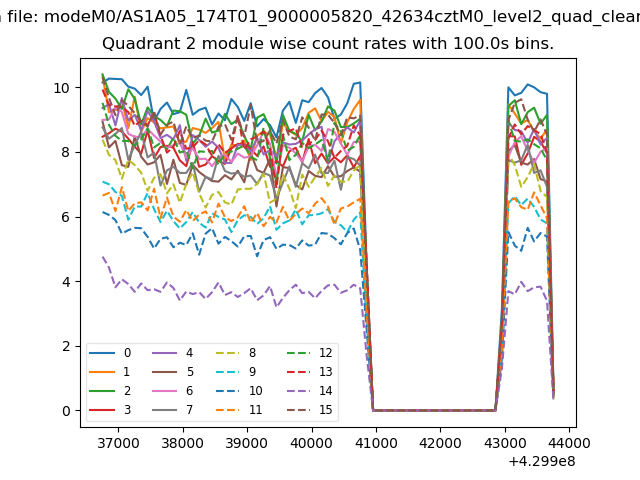
| Module-wise count rates for Quadrant B Data is divided into 100 sec bins |
 |
 |
| Module-wise count rates for Quadrant C Data is divided into 100 sec bins |
 |
 |
| Module-wise count rates for Quadrant D Data is divided into 100 sec bins |
 |
 |
| Parameter | Plot |
|---|---|
| CZT HV Monitor | 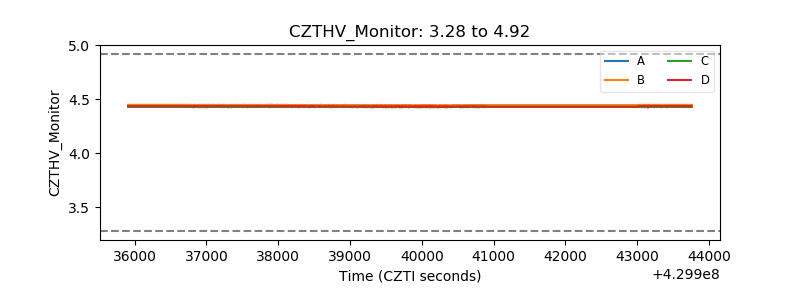 |
| D_VDD | 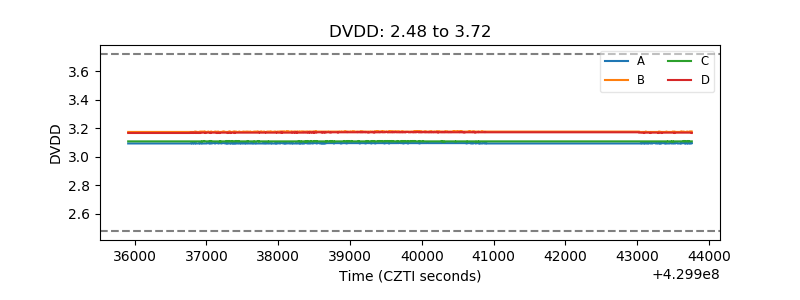 |
| Temperature 1 | 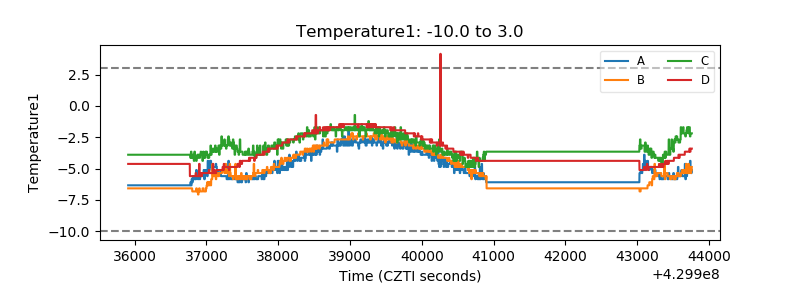 |
| Veto HV Monitor | 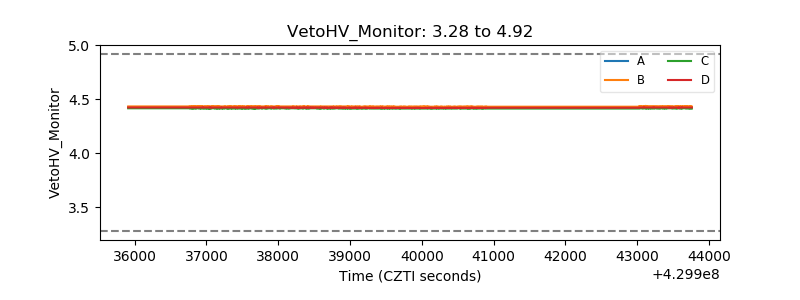 |
| Veto LLD | 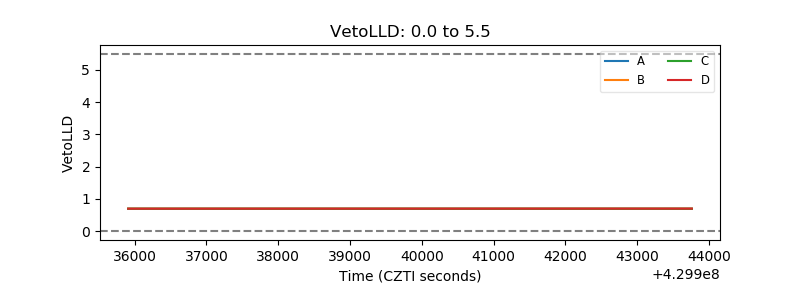 |
| Alpha Counter | 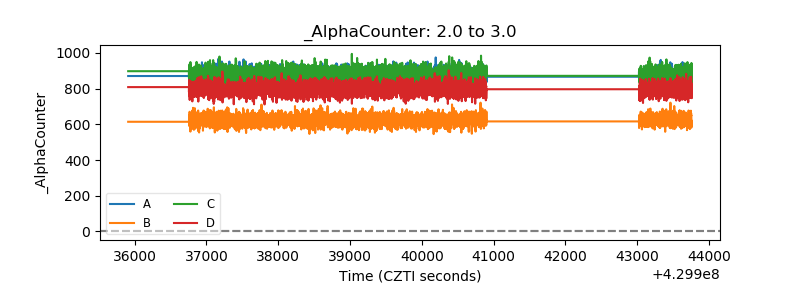 |
| _CPM_Rate | 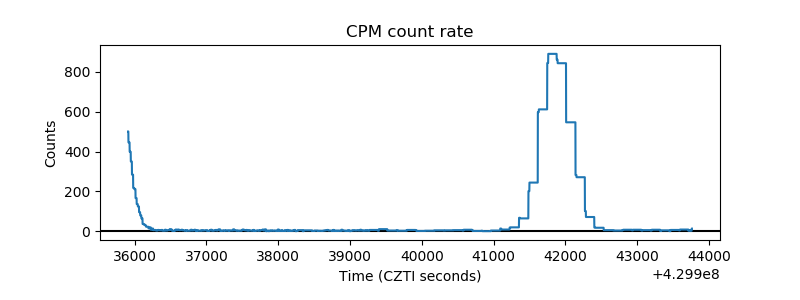 |
| CZT Counter | 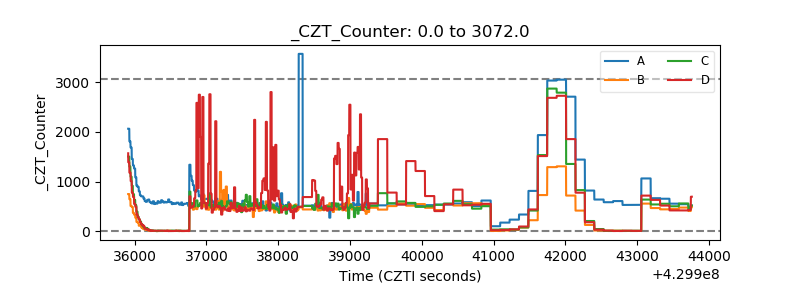 |
| +2.5 Volts monitor | 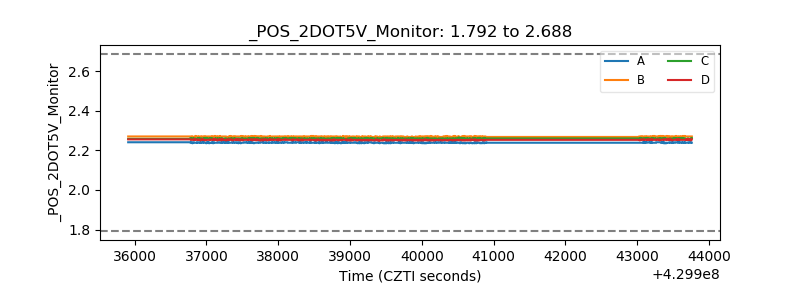 |
| +5 Volts monitor | 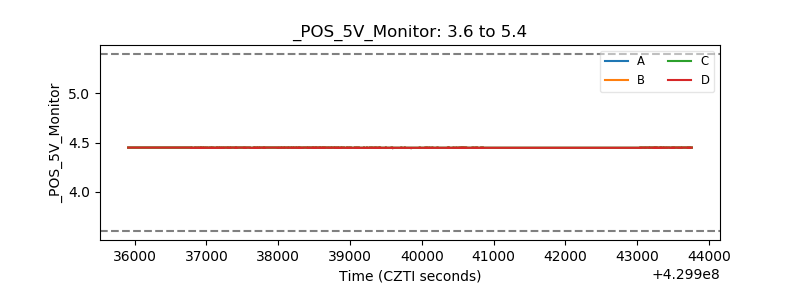 |
| _ROLL_ROT | 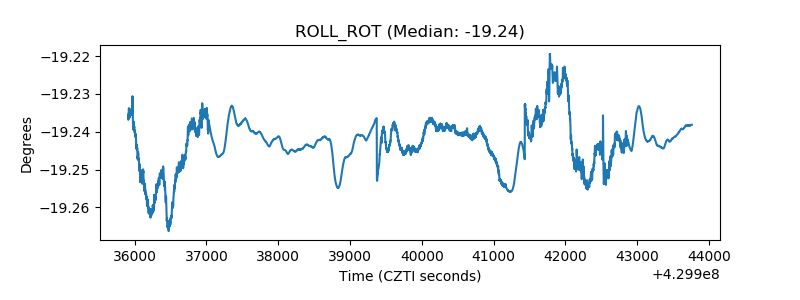 |
| _Roll_DEC | 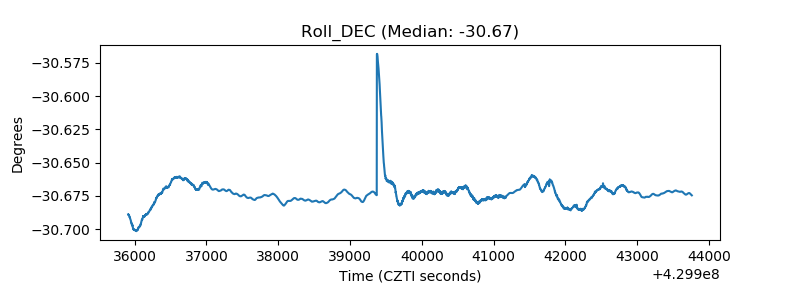 |
| _Roll_RA | 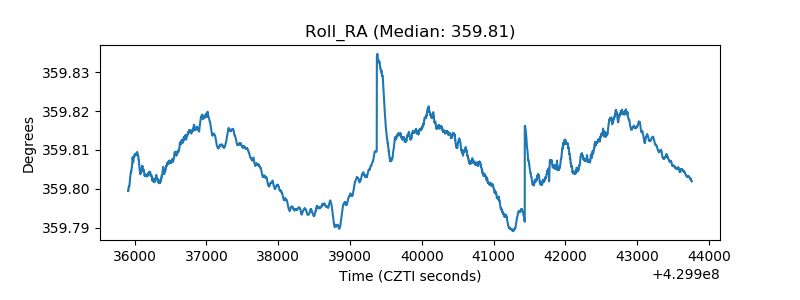 |
| Veto Counter | 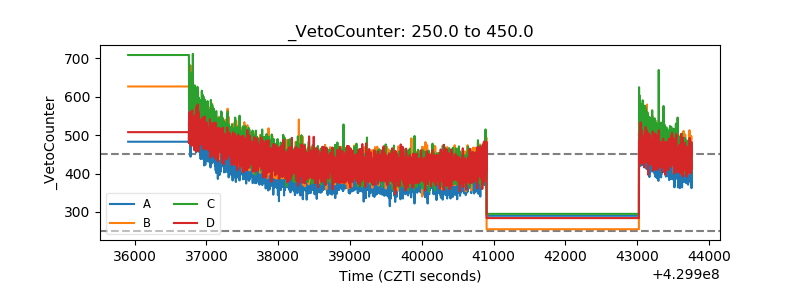 |