| Param | Original file | Final file |
|---|---|---|
| Filename | modeM0/AS1A05_174T01_9000005820_42635cztM0_level2.fits | modeM0/AS1A05_174T01_9000005820_42635cztM0_level2_quad_clean.evt |
| Size (bytes) | 322,439,040 | 83,298,240 |
| Size | 307.5 MB | 79.4 MB |
| Events in quadrant A | 2,688,909 | 563,432 |
| Events in quadrant B | 2,340,826 | 579,182 |
| Events in quadrant C | 2,777,053 | 551,670 |
| Events in quadrant D | 3,756,566 | 492,523 |
| Mode M9 | |||
|---|---|---|---|
| Quadrant | BADHDUFLAG | Total packets | Discarded packets |
| A | 0 | 38 | 0 |
| B | 0 | 39 | 0 |
| C | 0 | 39 | 0 |
| D | 0 | 39 | 0 |
| Mode SS | |||
|---|---|---|---|
| Quadrant | BADHDUFLAG | Total packets | Discarded packets |
| A | 0 | 98 | 0 |
| B | 0 | 98 | 0 |
| C | 0 | 98 | 0 |
| D | 0 | 98 | 0 |
| Mode M0 | |||
|---|---|---|---|
| Quadrant | BADHDUFLAG | Total packets | Discarded packets |
| A | 0 | 10610 | 2 |
| B | 0 | 10000 | 2 |
| C | 0 | 10926 | 2 |
| D | 0 | 14311 | 2 |
| Quadrant | Total seconds | Saturated seconds | Saturation percentage |
|---|---|---|---|
| A | 4779 | 8 | 0.167399% |
| B | 4779 | 22 | 0.460347% |
| C | 4779 | 98 | 2.050638% |
| D | 4779 | 290 | 6.068215% |
Noise dominated data is calculated using 1-second bins in cleaned event files. If a bin has >2000 counts, and if more than 50% of those come from <1% of pixels, then it is considered to be noise-dominated and hence unusable.
| Quadrant | # 1 sec bins | Bins with >0 counts | Bins with >2000 counts | High rate bins dominated by noise | Noise dominated (total time) | Noise dominated (detector-on time) | Marked lightcurve |
|---|---|---|---|---|---|---|---|
| A | 6902 | 4780 | 2 | 2 | 0.03% | 0.04% | 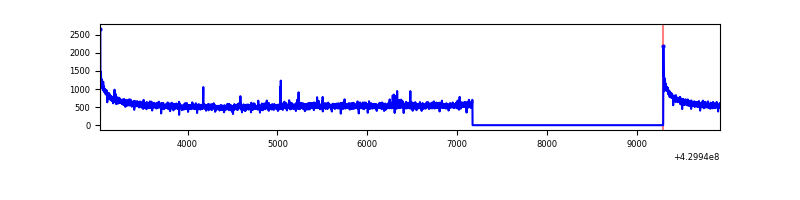 |
| B | 6902 | 4780 | 12 | 12 | 0.17% | 0.25% | 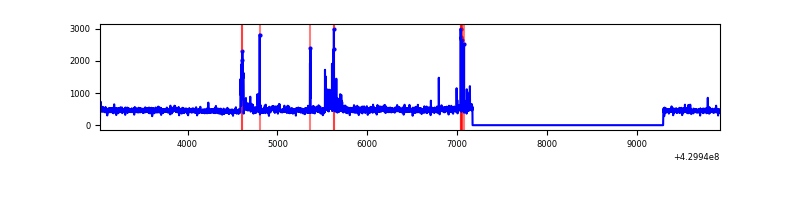 |
| C | 6902 | 4780 | 86 | 86 | 1.25% | 1.80% | 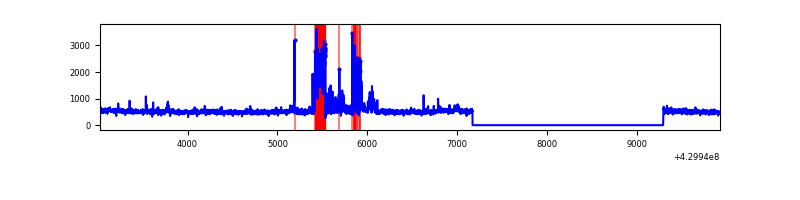 |
| D | 6902 | 4780 | 268 | 268 | 3.88% | 5.61% | 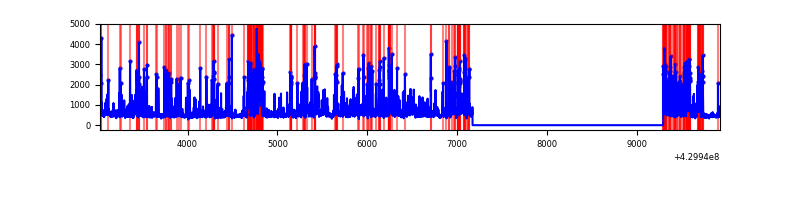 |
Top three noisy pixels from each quadrant. If the there are fewer than three noisy pixels in the level2.evt file, extra rows are filled as -1
| Pixel properties | Quadrant properties | ||||||
|---|---|---|---|---|---|---|---|
| Quadrant | DetID | PixID | Counts | Sigma | Mean | Median | Sigma |
| A | 10 | 83 | 518659 | 4478.17 | 557 | 545 | 115.7 |
| A | 2 | 79 | 7494 | 60.06 | 557 | 545 | 115.7 |
| A | 13 | 254 | 6207 | 48.94 | 557 | 545 | 115.7 |
| B | 10 | 246 | 82359 | 776.69 | 549 | 533 | 105.4 |
| B | 0 | 168 | 47149 | 442.48 | 549 | 533 | 105.4 |
| B | 0 | 245 | 29998 | 279.68 | 549 | 533 | 105.4 |
| C | 14 | 254 | 415540 | 3275.96 | 544 | 548 | 126.7 |
| C | 15 | 214 | 201876 | 1589.29 | 544 | 548 | 126.7 |
| C | 3 | 233 | 31546 | 244.7 | 544 | 548 | 126.7 |
| D | 12 | 233 | 332294 | 2518.56 | 537 | 524 | 131.7 |
| D | 2 | 249 | 302988 | 2296.09 | 537 | 524 | 131.7 |
| D | 12 | 218 | 281405 | 2132.25 | 537 | 524 | 131.7 |
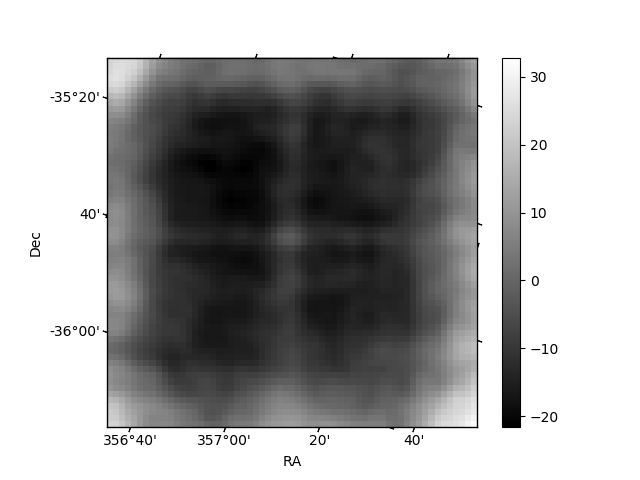
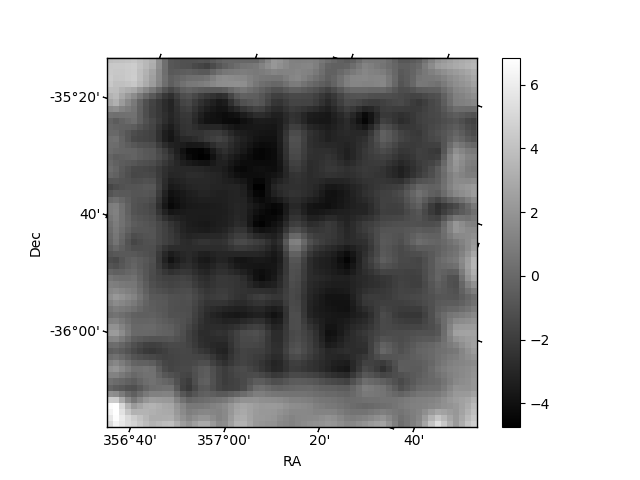
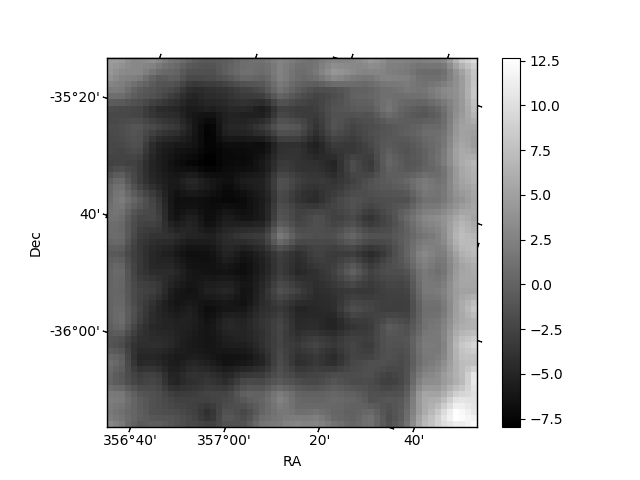
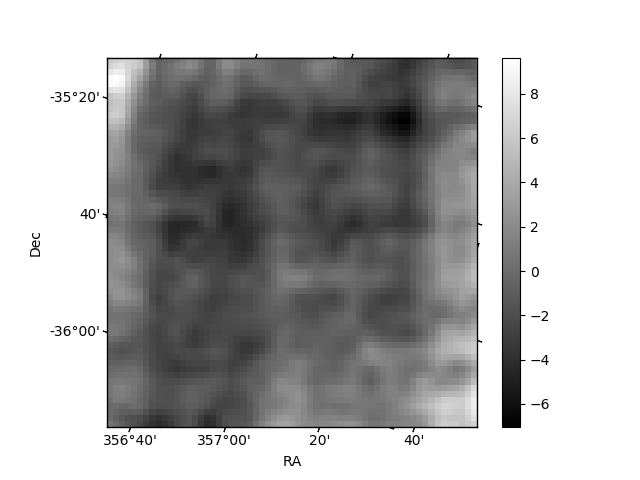
Histogram calculated using DETX and DETY for each event in the final _common_clean file
| Quadrant A | 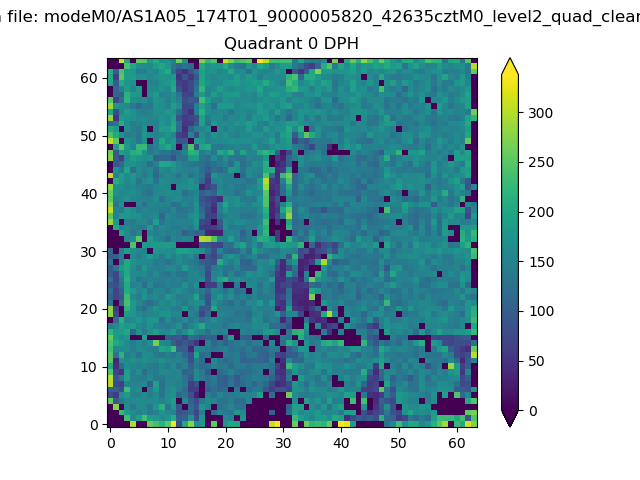 |
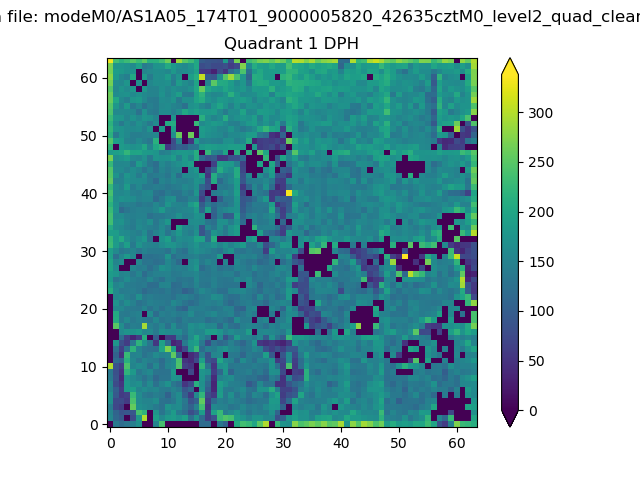 |
Quadrant B |
|---|---|---|---|
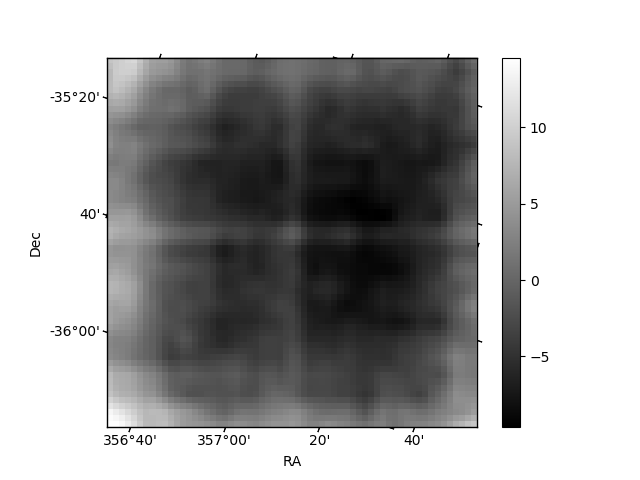
| Quadrant D | 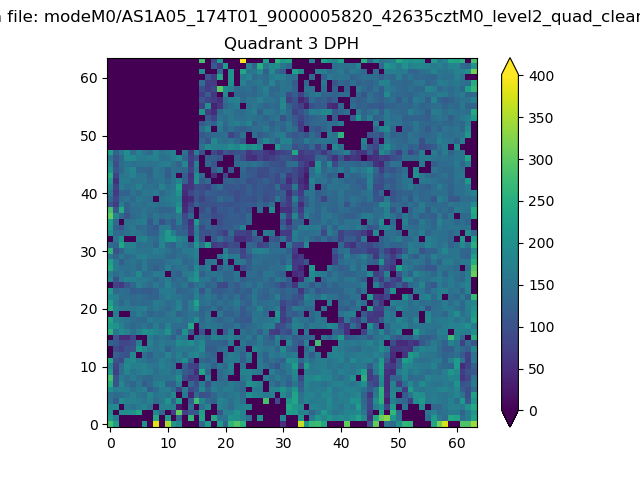 |
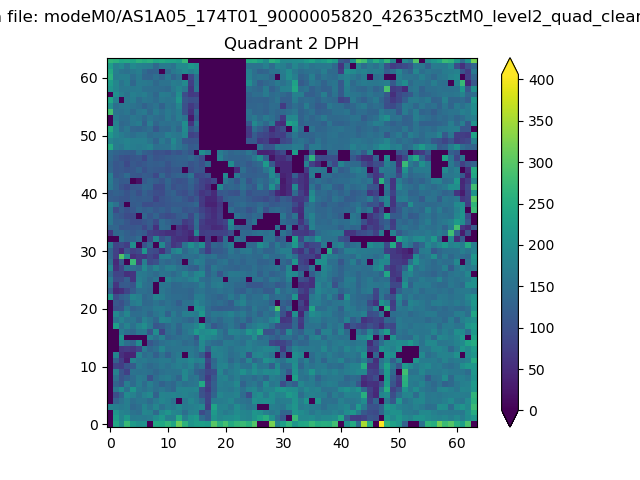 |
Quadrant C |
| Plot type | Count rate plots | Images |
|---|---|---|
| Comparison with Poisson distribution Blue bars denote a histogram of data divided into 1 sec bins. Red curve is a Poisson curve with rate = median count rate of data. |
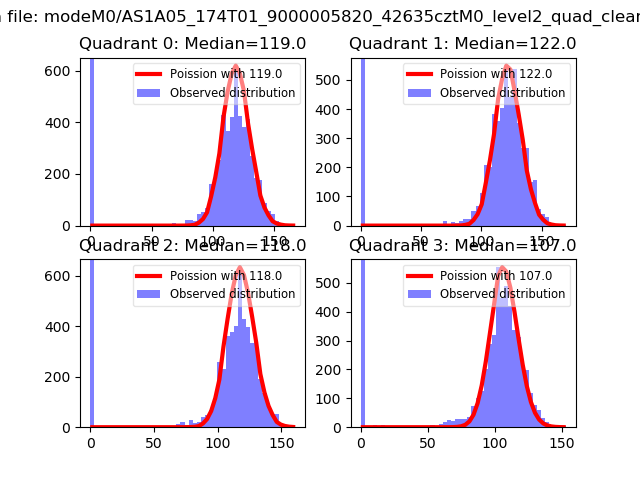 |
 |
| Quadrant-wise count rates Data is divided into 100 sec bins |
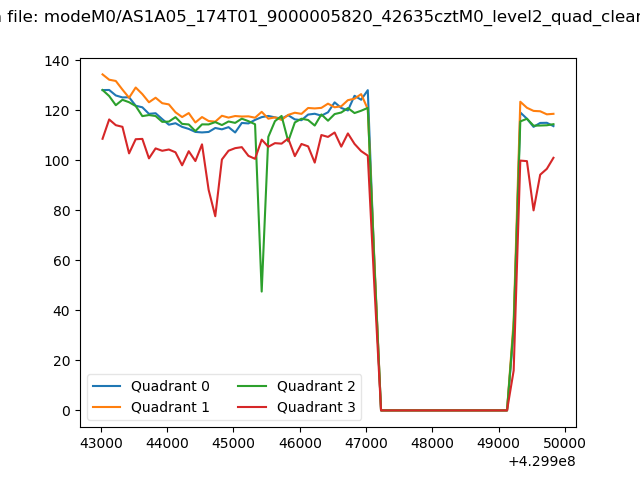 |
|
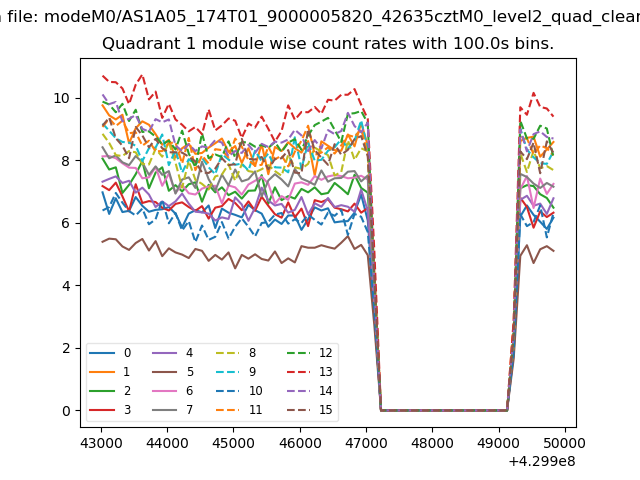
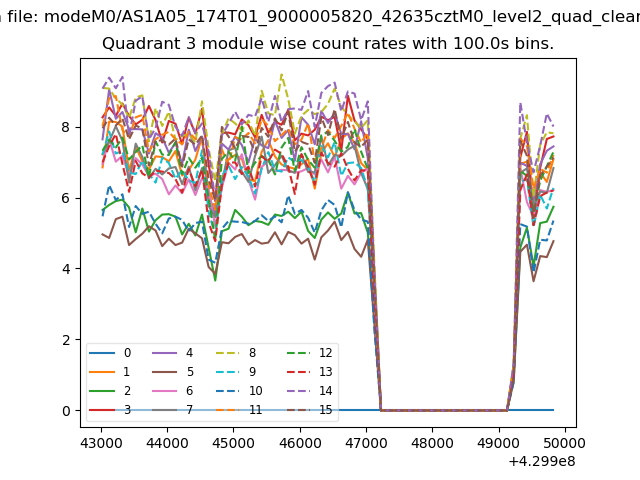
| Module-wise count rates for Quadrant A Data is divided into 100 sec bins |
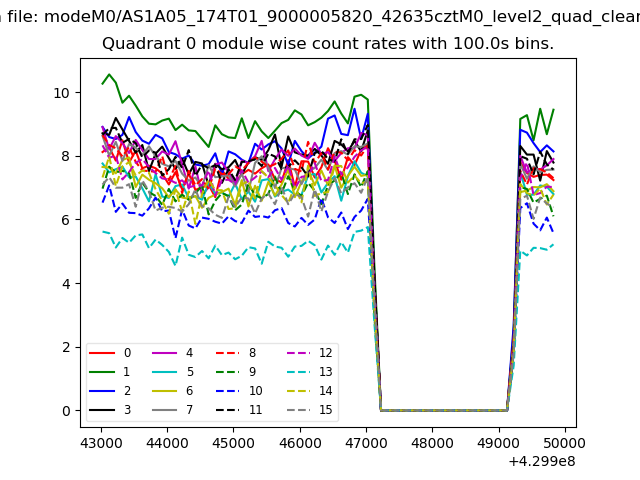 |
 |
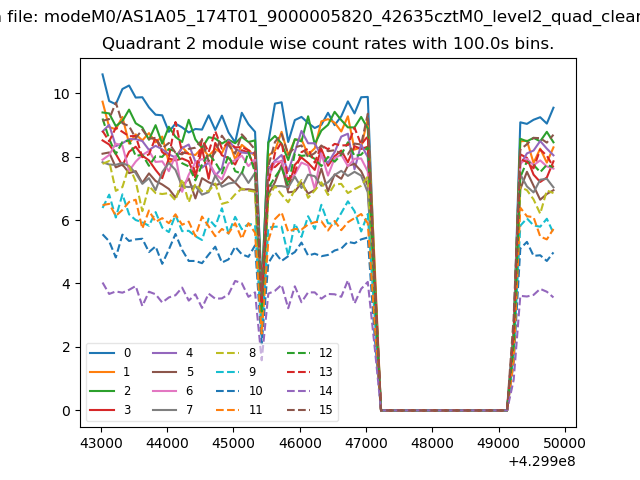
| Module-wise count rates for Quadrant B Data is divided into 100 sec bins |
 |
 |
| Module-wise count rates for Quadrant C Data is divided into 100 sec bins |
 |
 |
| Module-wise count rates for Quadrant D Data is divided into 100 sec bins |
 |
 |
| Parameter | Plot |
|---|---|
| CZT HV Monitor | 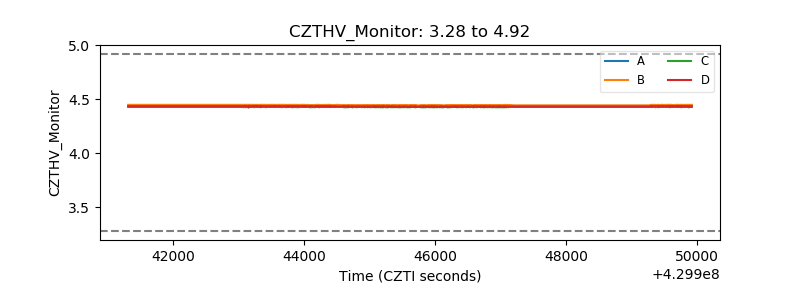 |
| D_VDD | 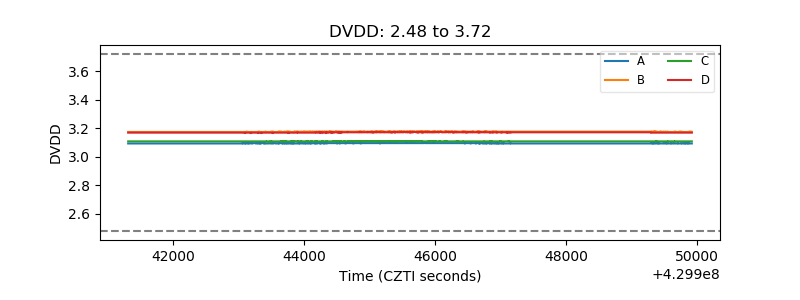 |
| Temperature 1 | 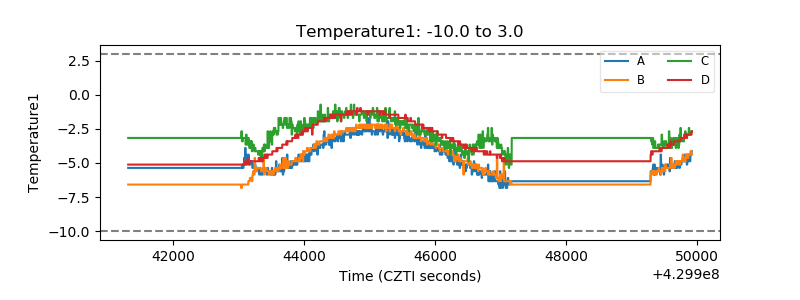 |
| Veto HV Monitor |  |
| Veto LLD | 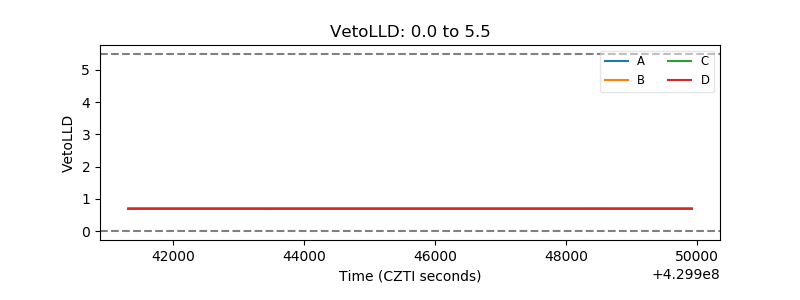 |
| Alpha Counter | 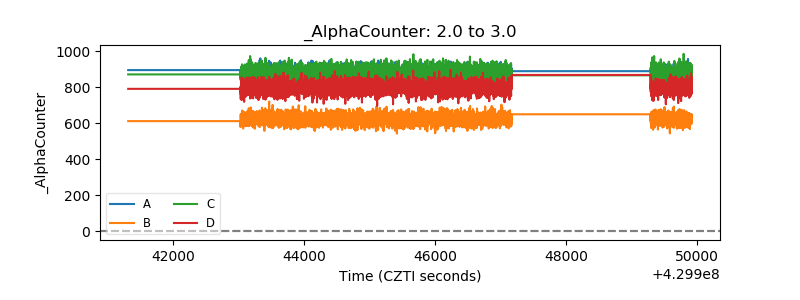 |
| _CPM_Rate | 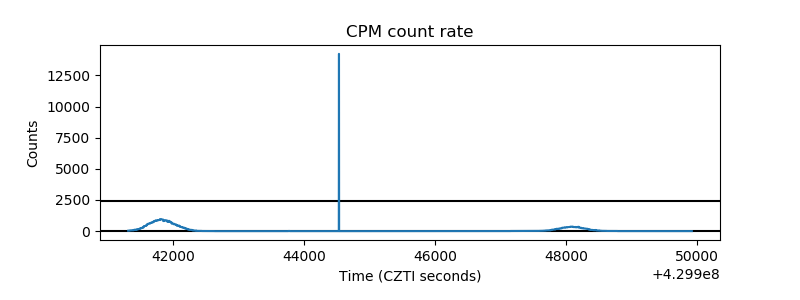 |
| CZT Counter | 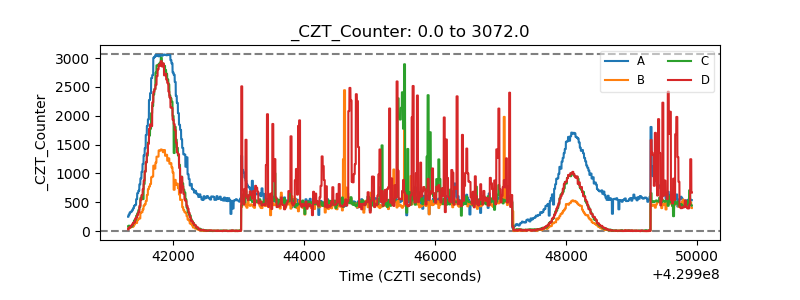 |
| +2.5 Volts monitor | 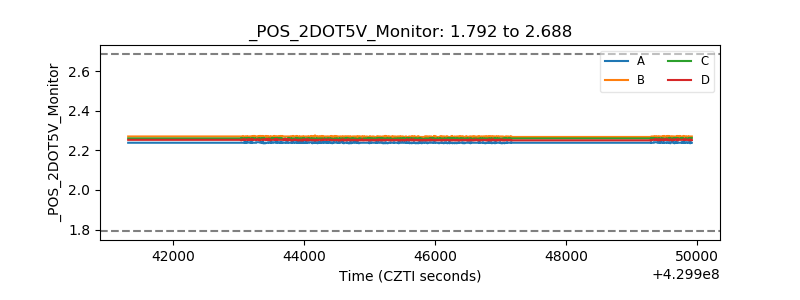 |
| +5 Volts monitor | 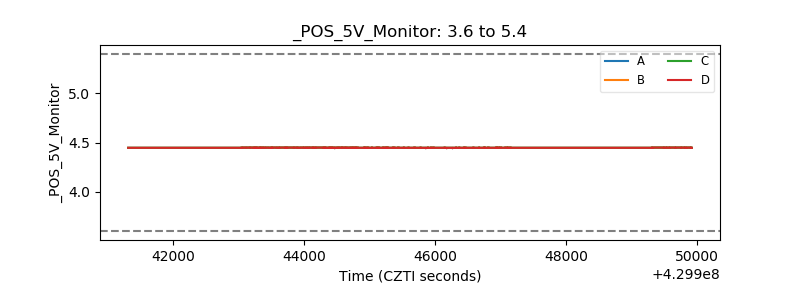 |
| _ROLL_ROT | 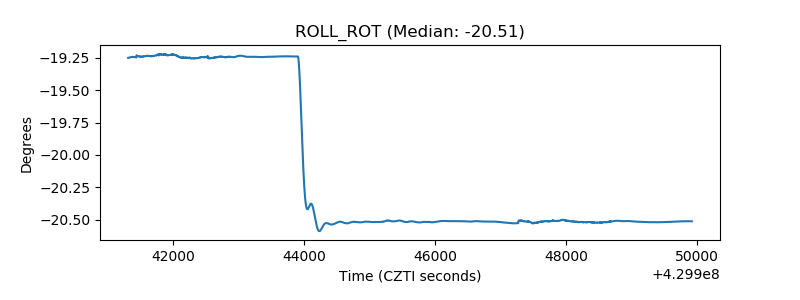 |
| _Roll_DEC | 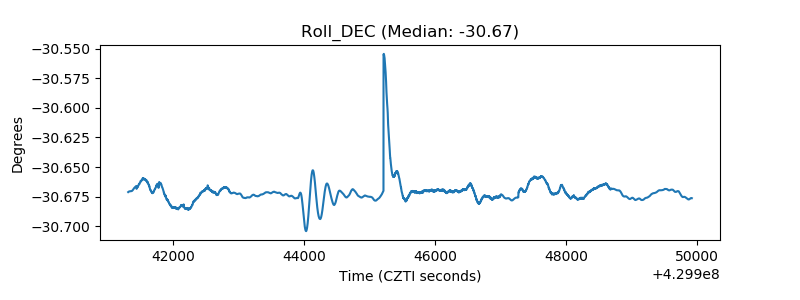 |
| _Roll_RA | 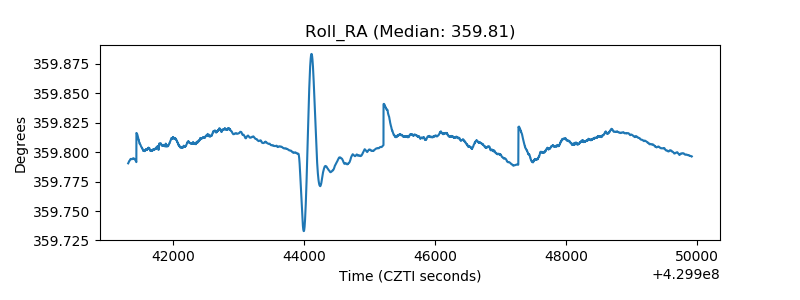 |
| Veto Counter | 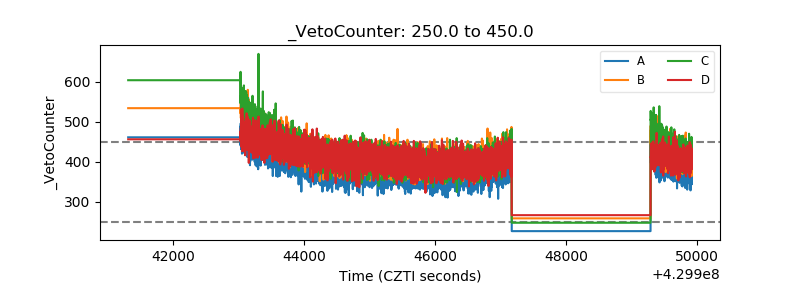 |