| Param | Original file | Final file |
|---|---|---|
| Filename | modeM0/AS1A05_174T01_9000005820_42636cztM0_level2.fits | modeM0/AS1A05_174T01_9000005820_42636cztM0_level2_quad_clean.evt |
| Size (bytes) | 330,091,200 | 82,690,560 |
| Size | 314.8 MB | 78.9 MB |
| Events in quadrant A | 2,715,780 | 555,621 |
| Events in quadrant B | 2,743,151 | 569,826 |
| Events in quadrant C | 2,415,638 | 555,736 |
| Events in quadrant D | 3,958,392 | 475,197 |
| Mode M9 | |||
|---|---|---|---|
| Quadrant | BADHDUFLAG | Total packets | Discarded packets |
| A | 0 | 28 | 0 |
| B | 0 | 29 | 0 |
| C | 0 | 29 | 0 |
| D | 0 | 29 | 0 |
| Mode SS | |||
|---|---|---|---|
| Quadrant | BADHDUFLAG | Total packets | Discarded packets |
| A | 0 | 102 | 0 |
| B | 0 | 102 | 0 |
| C | 0 | 102 | 0 |
| D | 0 | 102 | 0 |
| Mode M0 | |||
|---|---|---|---|
| Quadrant | BADHDUFLAG | Total packets | Discarded packets |
| A | 0 | 10828 | 2 |
| B | 0 | 11400 | 2 |
| C | 0 | 10033 | 2 |
| D | 0 | 15088 | 2 |
| Quadrant | Total seconds | Saturated seconds | Saturation percentage |
|---|---|---|---|
| A | 4954 | 10 | 0.201857% |
| B | 4954 | 50 | 1.009285% |
| C | 4954 | 5 | 0.100929% |
| D | 4954 | 410 | 8.276140% |
Noise dominated data is calculated using 1-second bins in cleaned event files. If a bin has >2000 counts, and if more than 50% of those come from <1% of pixels, then it is considered to be noise-dominated and hence unusable.
| Quadrant | # 1 sec bins | Bins with >0 counts | Bins with >2000 counts | High rate bins dominated by noise | Noise dominated (total time) | Noise dominated (detector-on time) | Marked lightcurve |
|---|---|---|---|---|---|---|---|
| A | 6988 | 4955 | 1 | 1 | 0.01% | 0.02% | 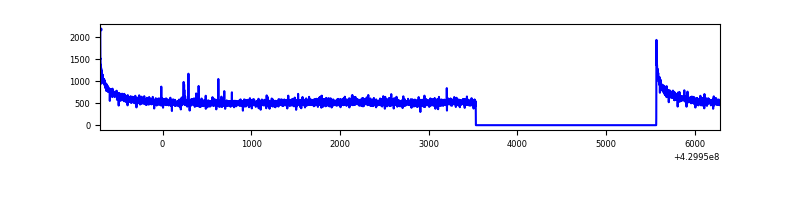 |
| B | 6988 | 4955 | 24 | 24 | 0.34% | 0.48% | 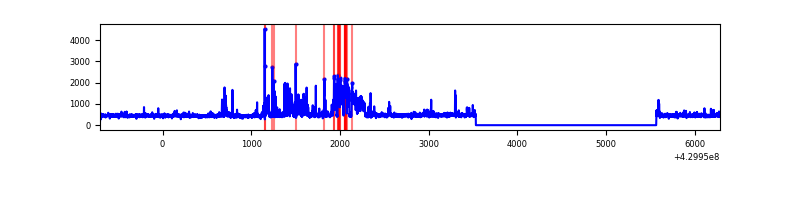 |
| C | 6988 | 4955 | 1 | 1 | 0.01% | 0.02% | 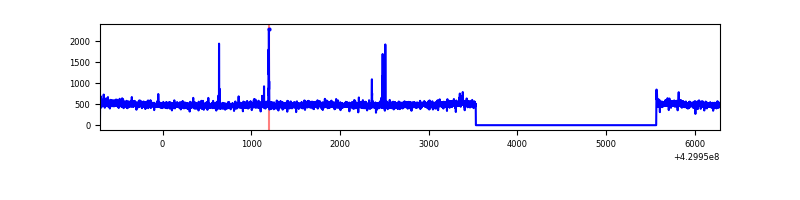 |
| D | 6988 | 4955 | 393 | 393 | 5.62% | 7.93% | 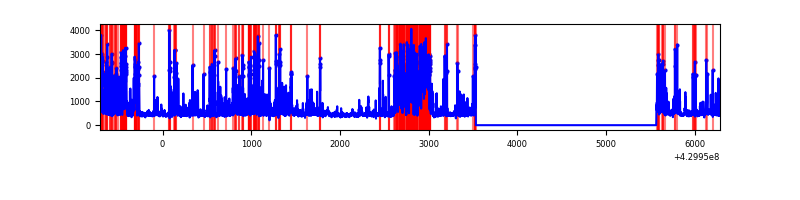 |
Top three noisy pixels from each quadrant. If the there are fewer than three noisy pixels in the level2.evt file, extra rows are filled as -1
| Pixel properties | Quadrant properties | ||||||
|---|---|---|---|---|---|---|---|
| Quadrant | DetID | PixID | Counts | Sigma | Mean | Median | Sigma |
| A | 10 | 83 | 530239 | 4531.23 | 561 | 550 | 116.9 |
| A | 2 | 79 | 8170 | 65.19 | 561 | 550 | 116.9 |
| A | 13 | 254 | 6755 | 53.08 | 561 | 550 | 116.9 |
| B | 10 | 246 | 491256 | 4550.08 | 553 | 538 | 107.8 |
| B | 0 | 245 | 53298 | 489.21 | 553 | 538 | 107.8 |
| B | 0 | 168 | 16289 | 146.05 | 553 | 538 | 107.8 |
| C | 15 | 214 | 207415 | 1600.54 | 551 | 554 | 129.2 |
| C | 3 | 233 | 27454 | 208.13 | 551 | 554 | 129.2 |
| C | 14 | 254 | 15644 | 116.75 | 551 | 554 | 129.2 |
| D | 12 | 218 | 999895 | 7466.44 | 537 | 521 | 133.8 |
| D | 12 | 233 | 234560 | 1748.53 | 537 | 521 | 133.8 |
| D | 2 | 249 | 181296 | 1350.59 | 537 | 521 | 133.8 |
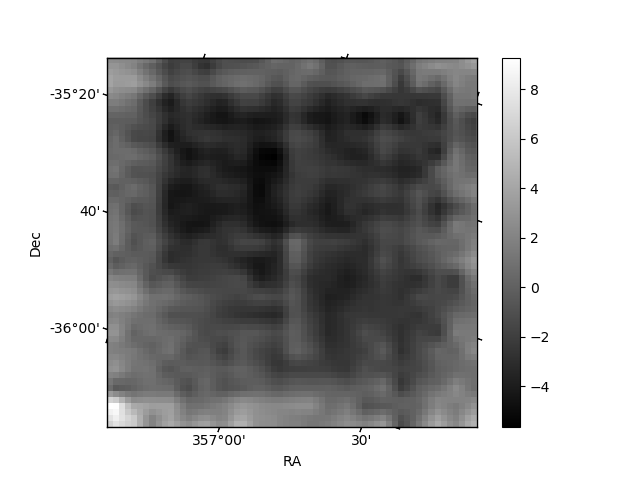
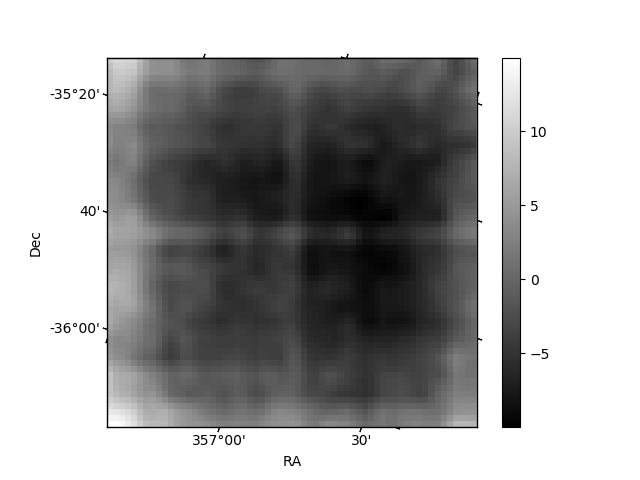
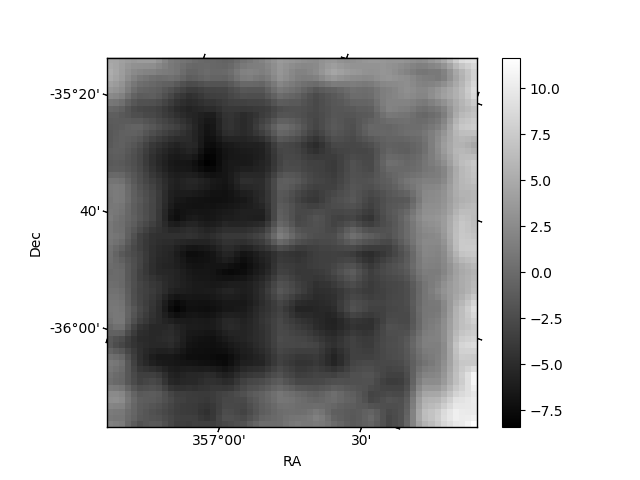
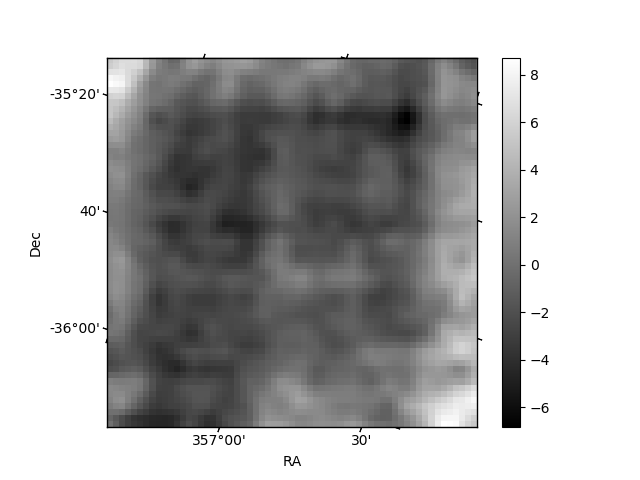
Histogram calculated using DETX and DETY for each event in the final _common_clean file
| Quadrant A | 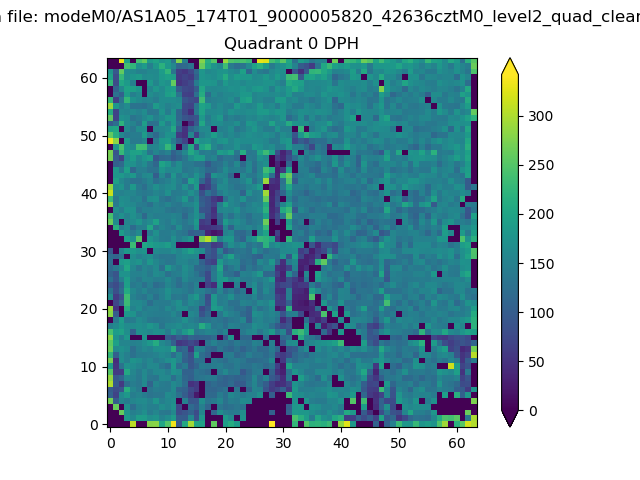 |
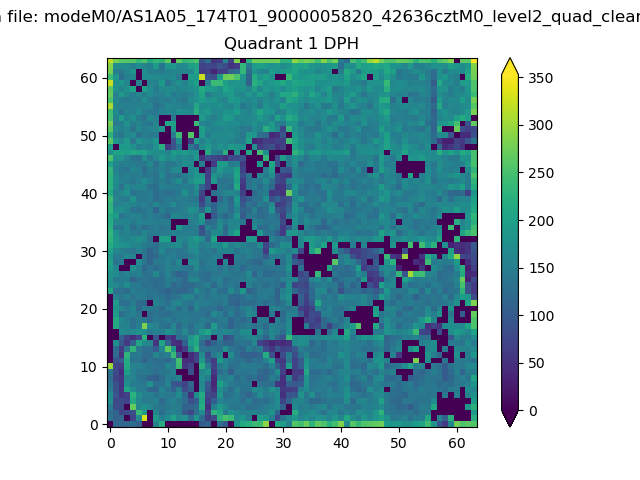 |
Quadrant B |
|---|---|---|---|
| Quadrant D | 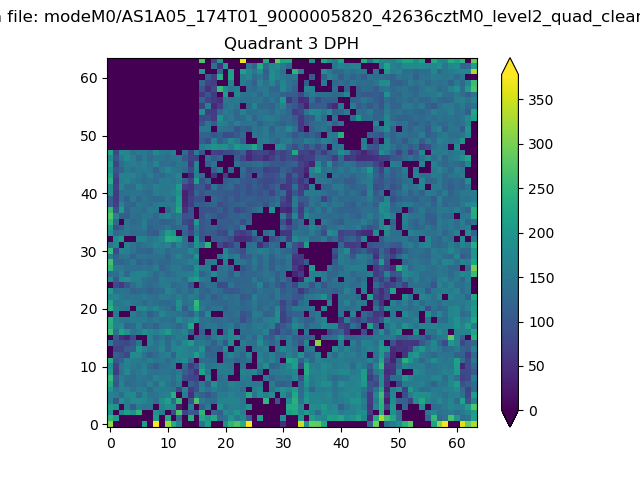 |
 |
Quadrant C |
| Plot type | Count rate plots | Images |
|---|---|---|
| Comparison with Poisson distribution Blue bars denote a histogram of data divided into 1 sec bins. Red curve is a Poisson curve with rate = median count rate of data. |
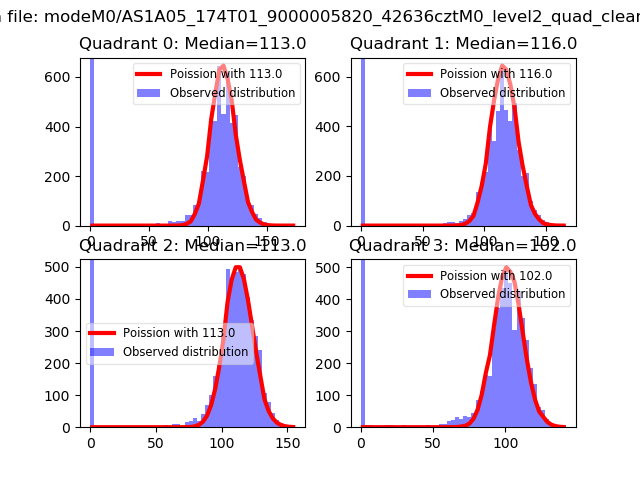 |
 |
| Quadrant-wise count rates Data is divided into 100 sec bins |
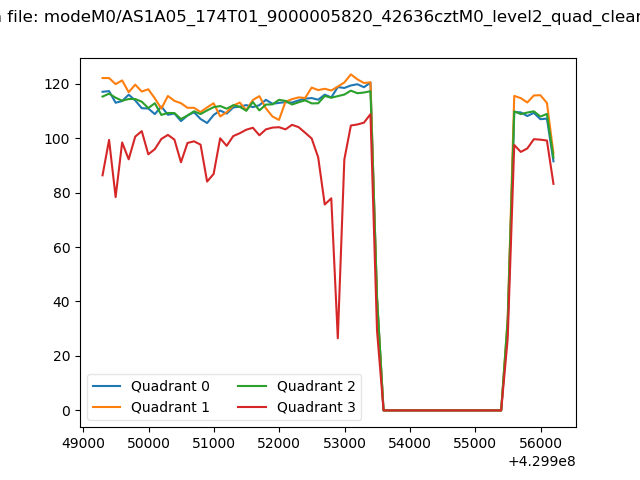 |
|
| Module-wise count rates for Quadrant A Data is divided into 100 sec bins |
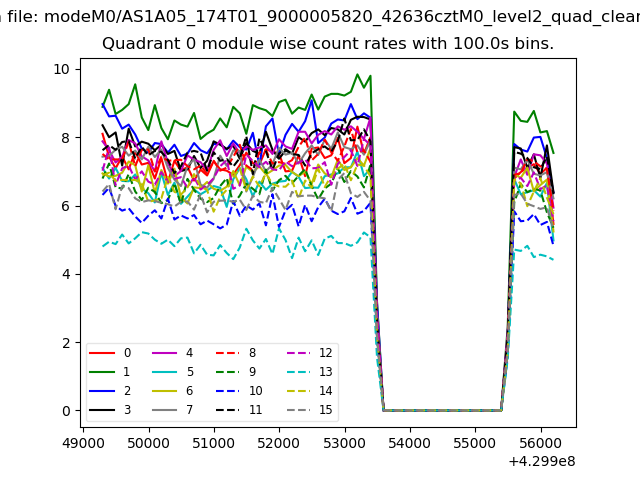 |
 |
| Module-wise count rates for Quadrant B Data is divided into 100 sec bins |
 |
 |
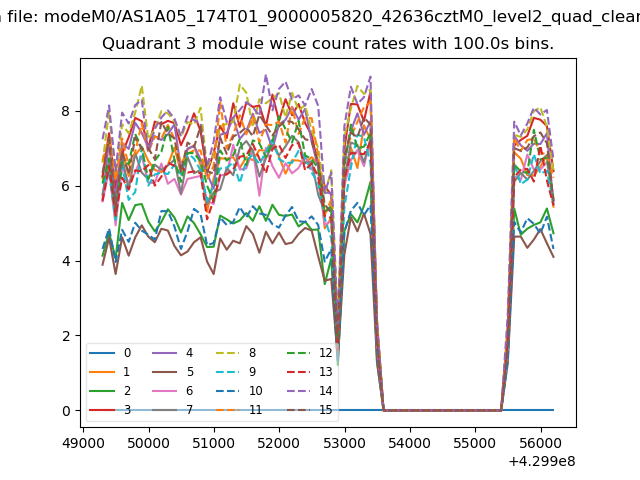
| Module-wise count rates for Quadrant C Data is divided into 100 sec bins |
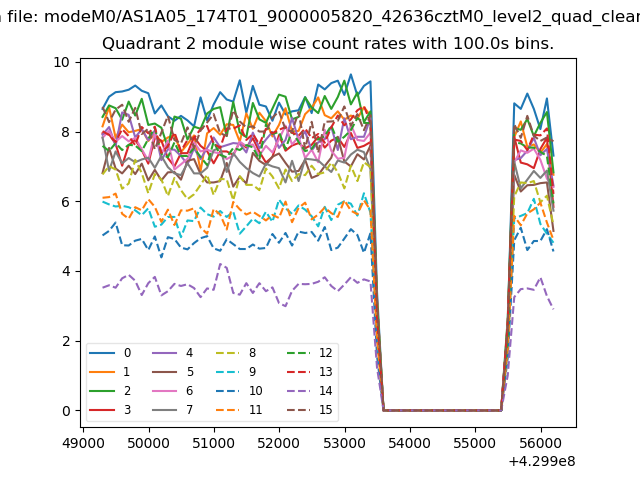 |
 |
| Module-wise count rates for Quadrant D Data is divided into 100 sec bins |
 |
 |
| Parameter | Plot |
|---|---|
| CZT HV Monitor | 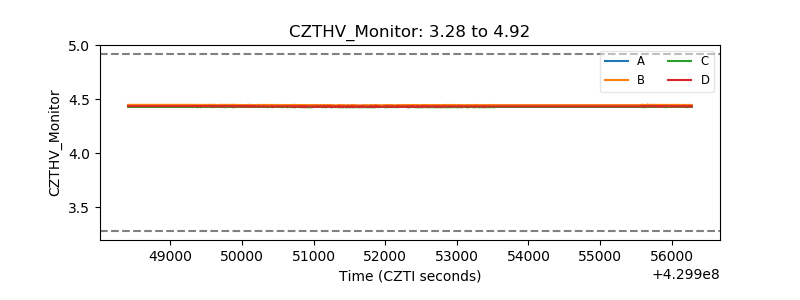 |
| D_VDD | 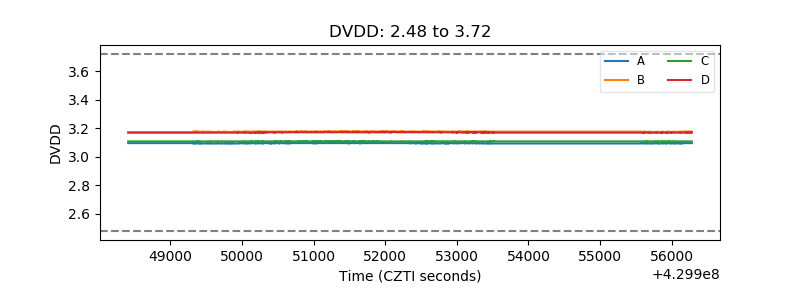 |
| Temperature 1 | 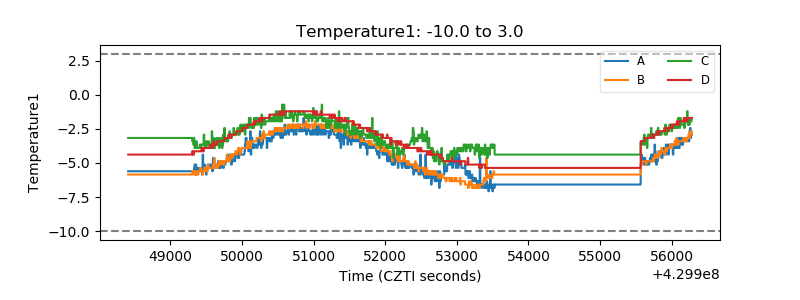 |
| Veto HV Monitor | 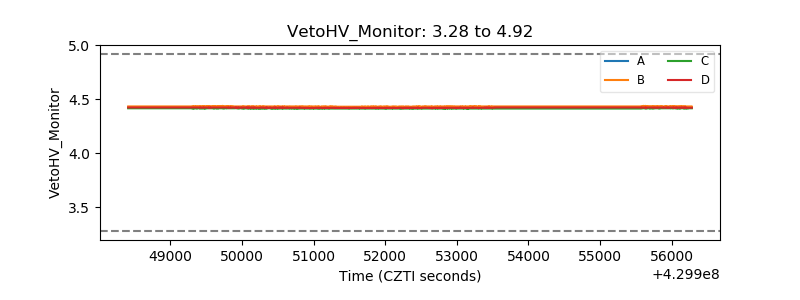 |
| Veto LLD | 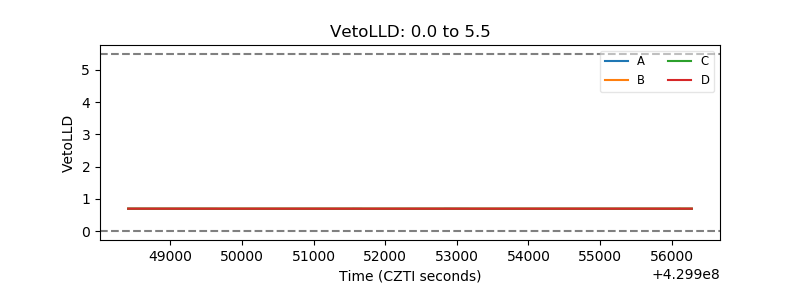 |
| Alpha Counter | 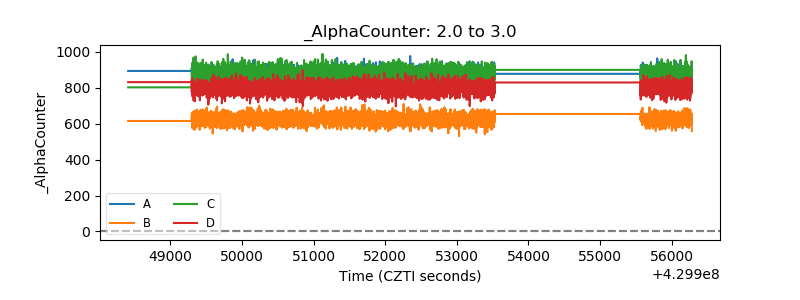 |
| _CPM_Rate |  |
| CZT Counter | 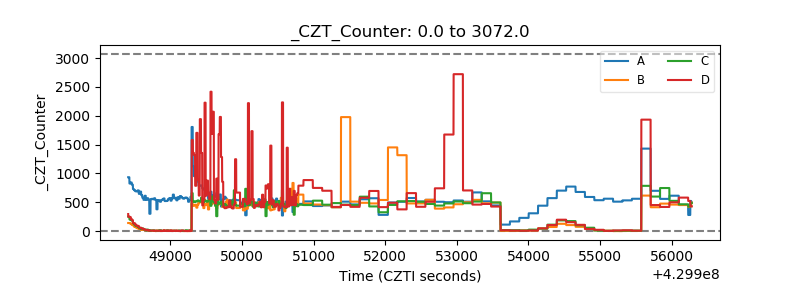 |
| +2.5 Volts monitor | 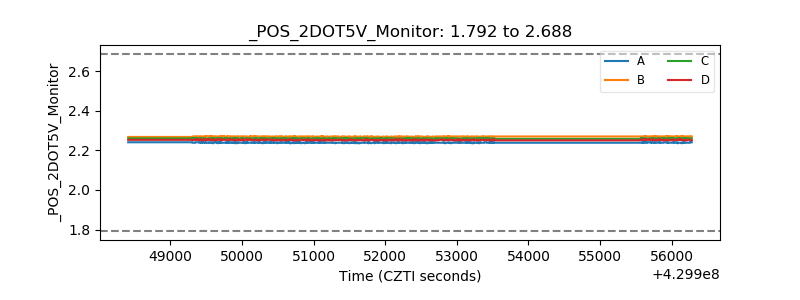 |
| +5 Volts monitor | 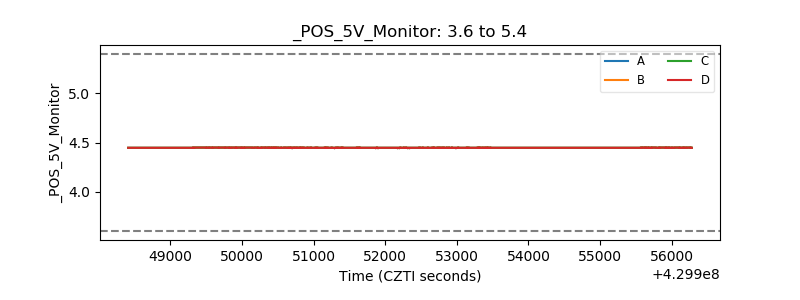 |
| _ROLL_ROT | 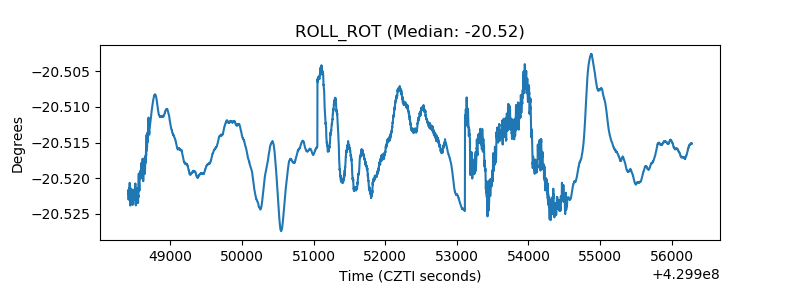 |
| _Roll_DEC |  |
| _Roll_RA | 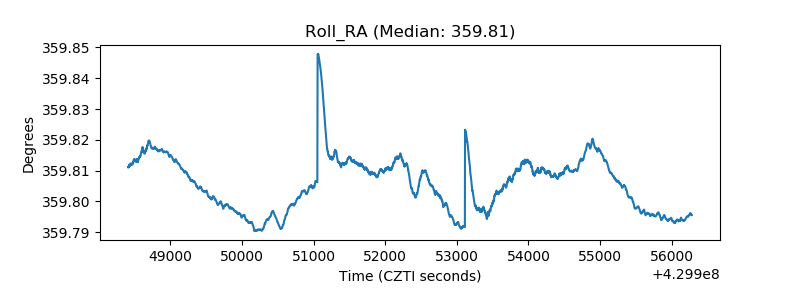 |
| Veto Counter | 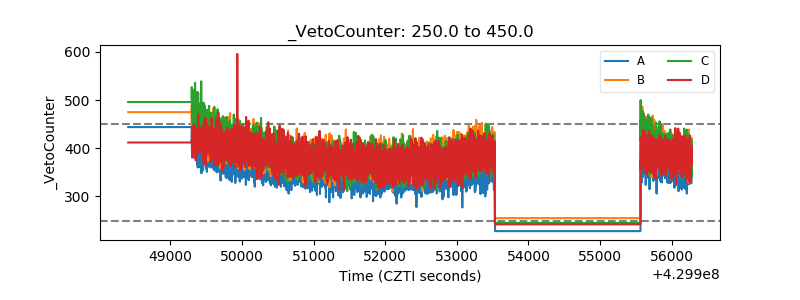 |