| Param | Original file | Final file |
|---|---|---|
| Filename | modeM0/AS1A05_174T01_9000005820_42637cztM0_level2.fits | modeM0/AS1A05_174T01_9000005820_42637cztM0_level2_quad_clean.evt |
| Size (bytes) | 313,891,200 | 83,269,440 |
| Size | 299.3 MB | 79.4 MB |
| Events in quadrant A | 2,652,410 | 554,572 |
| Events in quadrant B | 2,412,980 | 568,427 |
| Events in quadrant C | 2,415,643 | 552,918 |
| Events in quadrant D | 3,742,553 | 489,558 |
| Mode M9 | |||
|---|---|---|---|
| Quadrant | BADHDUFLAG | Total packets | Discarded packets |
| A | 0 | 17 | 0 |
| B | 0 | 17 | 0 |
| C | 0 | 17 | 0 |
| D | 0 | 17 | 0 |
| Mode SS | |||
|---|---|---|---|
| Quadrant | BADHDUFLAG | Total packets | Discarded packets |
| A | 0 | 104 | 0 |
| B | 0 | 104 | 0 |
| C | 0 | 104 | 0 |
| D | 0 | 104 | 0 |
| Mode M0 | |||
|---|---|---|---|
| Quadrant | BADHDUFLAG | Total packets | Discarded packets |
| A | 0 | 10841 | 63 |
| B | 0 | 10674 | 39 |
| C | 0 | 10246 | 31 |
| D | 0 | 14661 | 72 |
| Quadrant | Total seconds | Saturated seconds | Saturation percentage |
|---|---|---|---|
| A | 5070 | 8 | 0.157791% |
| B | 5074 | 28 | 0.551833% |
| C | 5079 | 4 | 0.078756% |
| D | 5075 | 295 | 5.812808% |
Noise dominated data is calculated using 1-second bins in cleaned event files. If a bin has >2000 counts, and if more than 50% of those come from <1% of pixels, then it is considered to be noise-dominated and hence unusable.
| Quadrant | # 1 sec bins | Bins with >0 counts | Bins with >2000 counts | High rate bins dominated by noise | Noise dominated (total time) | Noise dominated (detector-on time) | Marked lightcurve |
|---|---|---|---|---|---|---|---|
| A | 6793 | 5081 | 1 | 1 | 0.01% | 0.02% | 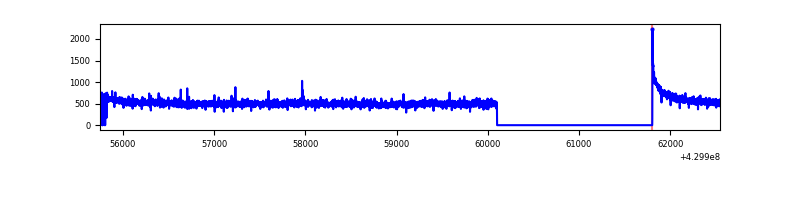 |
| B | 6794 | 5086 | 20 | 20 | 0.29% | 0.39% | 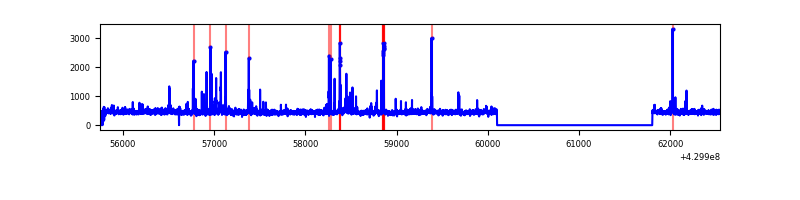 |
| C | 6791 | 5088 | 2 | 2 | 0.03% | 0.04% | 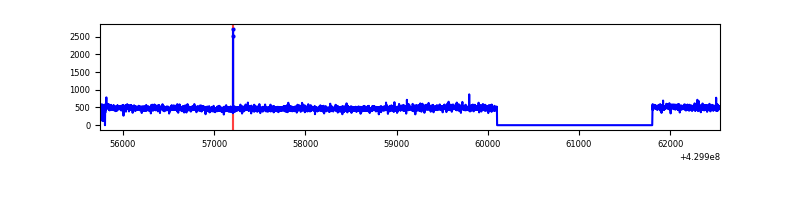 |
| D | 6798 | 5086 | 279 | 279 | 4.10% | 5.49% | 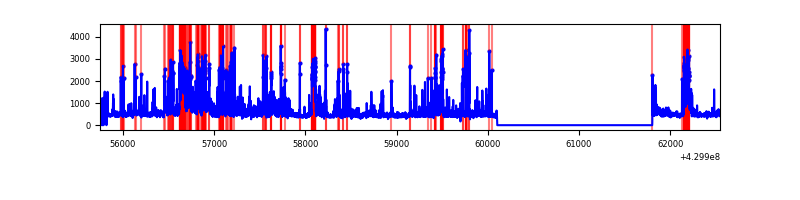 |
Top three noisy pixels from each quadrant. If the there are fewer than three noisy pixels in the level2.evt file, extra rows are filled as -1
| Pixel properties | Quadrant properties | ||||||
|---|---|---|---|---|---|---|---|
| Quadrant | DetID | PixID | Counts | Sigma | Mean | Median | Sigma |
| A | 10 | 83 | 469027 | 4016.72 | 561 | 549 | 116.6 |
| A | 3 | 137 | 6406 | 50.22 | 561 | 549 | 116.6 |
| A | 13 | 254 | 6252 | 48.9 | 561 | 549 | 116.6 |
| B | 3 | 112 | 122791 | 1135.16 | 556 | 539 | 107.7 |
| B | 0 | 245 | 80775 | 745.03 | 556 | 539 | 107.7 |
| B | 0 | 168 | 15989 | 143.46 | 556 | 539 | 107.7 |
| C | 15 | 214 | 209126 | 1611.65 | 553 | 556 | 129.4 |
| C | 3 | 233 | 38488 | 293.11 | 553 | 556 | 129.4 |
| C | 14 | 254 | 11171 | 82.02 | 553 | 556 | 129.4 |
| D | 12 | 218 | 574301 | 4307.66 | 541 | 525 | 133.2 |
| D | 2 | 249 | 234319 | 1755.22 | 541 | 525 | 133.2 |
| D | 1 | 52 | 191112 | 1430.84 | 541 | 525 | 133.2 |
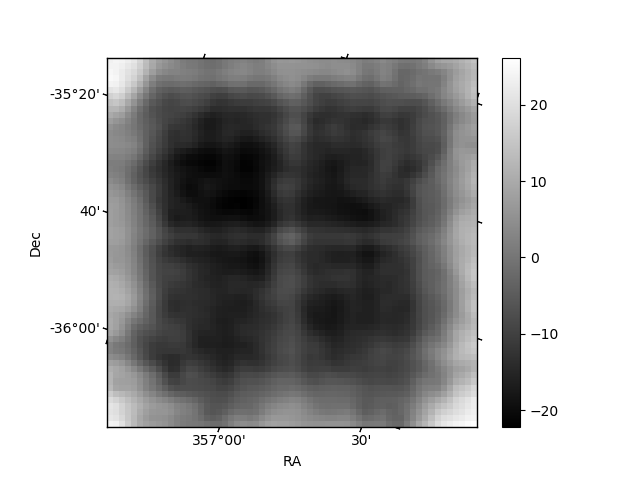
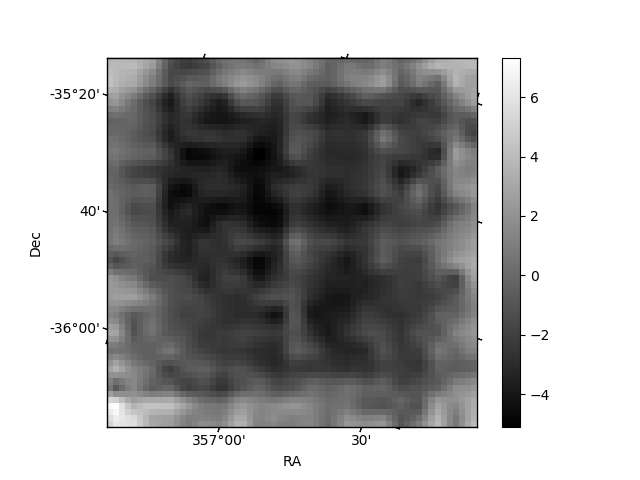
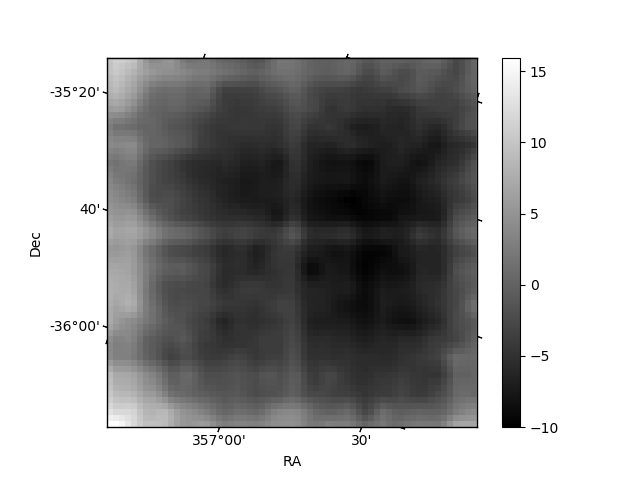
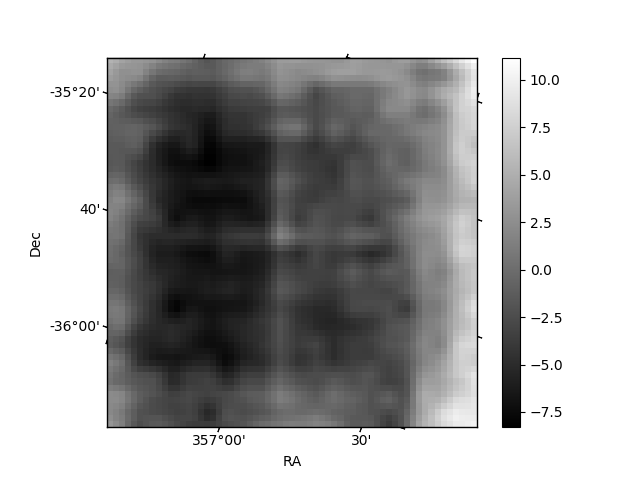
Histogram calculated using DETX and DETY for each event in the final _common_clean file
| Quadrant A | 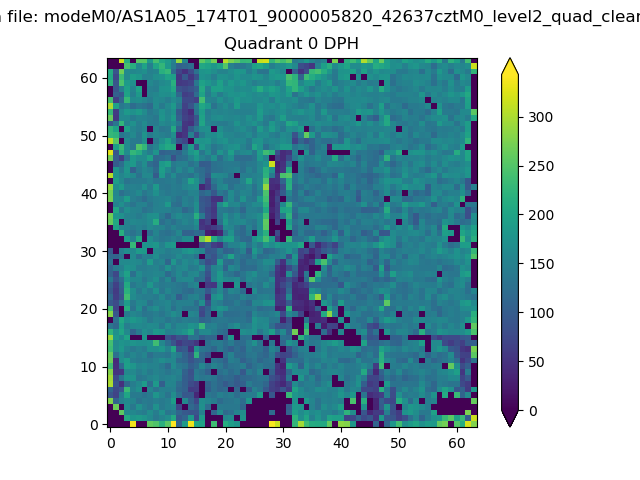 |
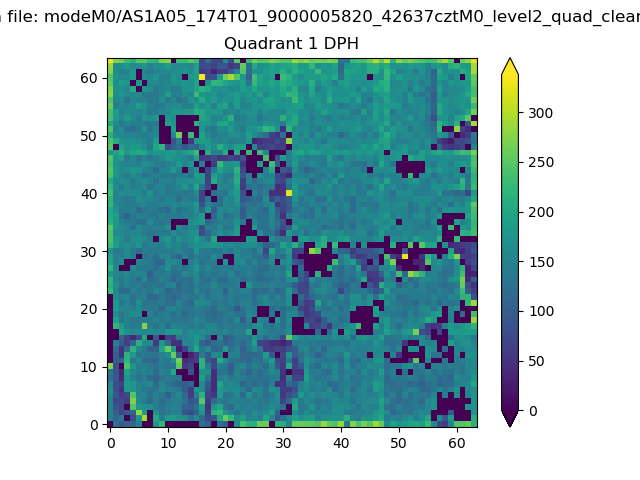 |
Quadrant B |
|---|---|---|---|
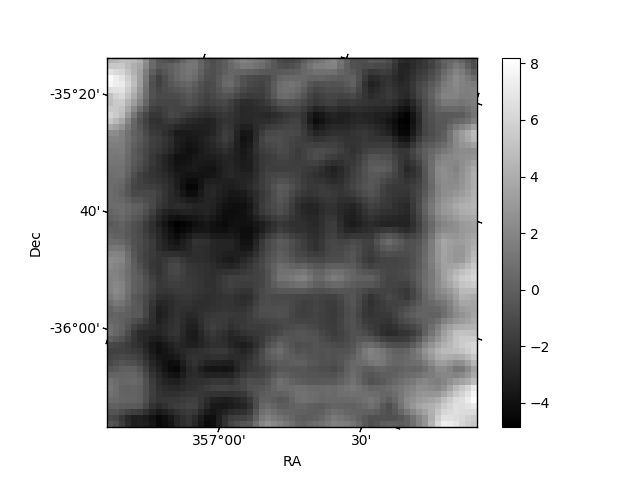
| Quadrant D | 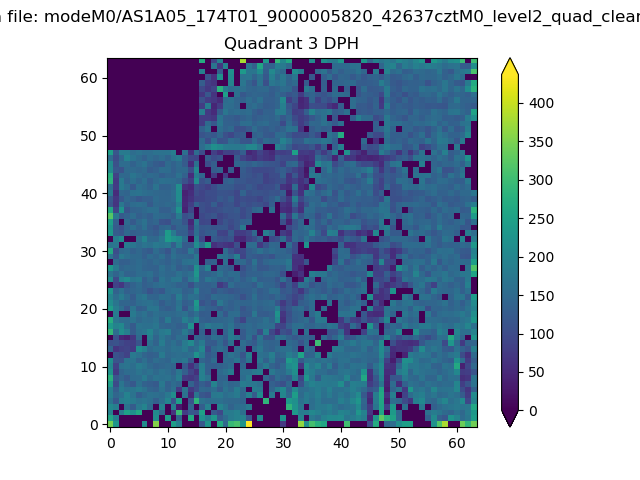 |
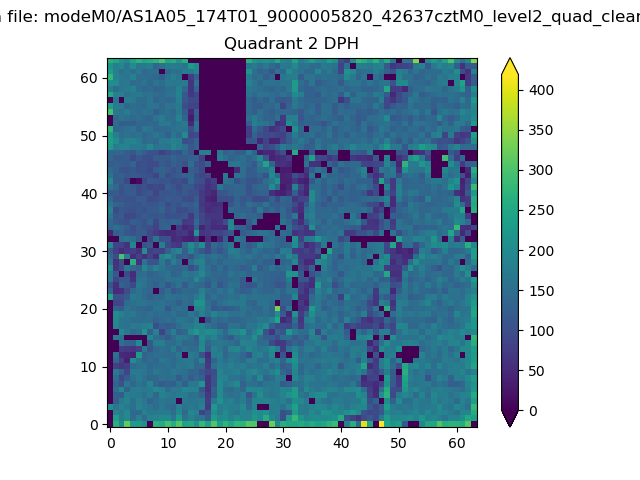 |
Quadrant C |
| Plot type | Count rate plots | Images |
|---|---|---|
| Comparison with Poisson distribution Blue bars denote a histogram of data divided into 1 sec bins. Red curve is a Poisson curve with rate = median count rate of data. |
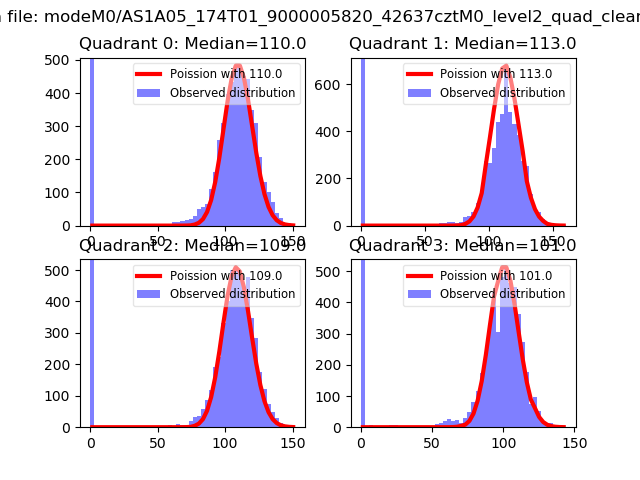 |
 |
| Quadrant-wise count rates Data is divided into 100 sec bins |
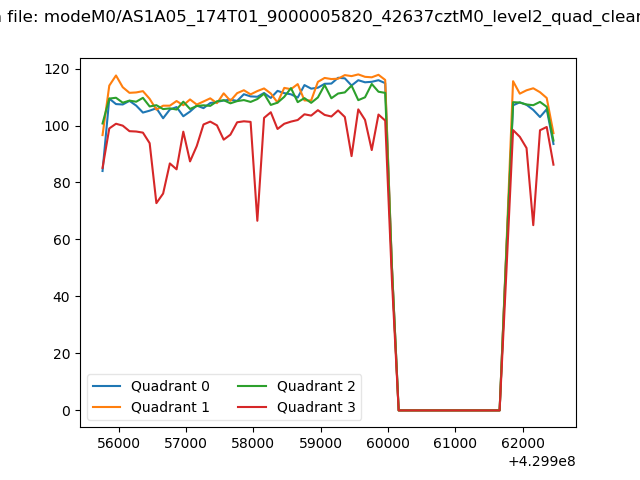 |
|
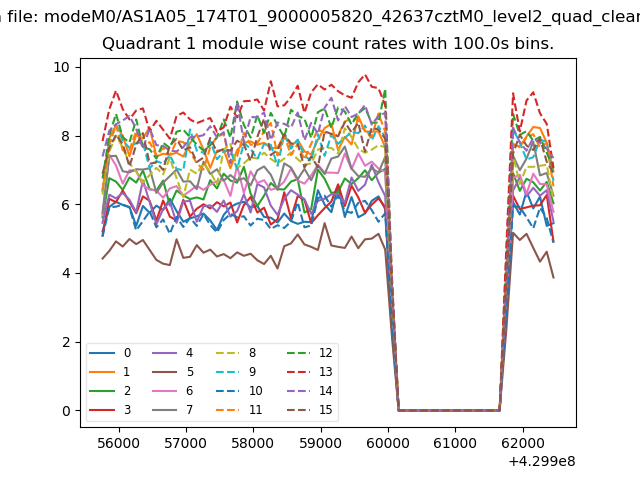
| Module-wise count rates for Quadrant A Data is divided into 100 sec bins |
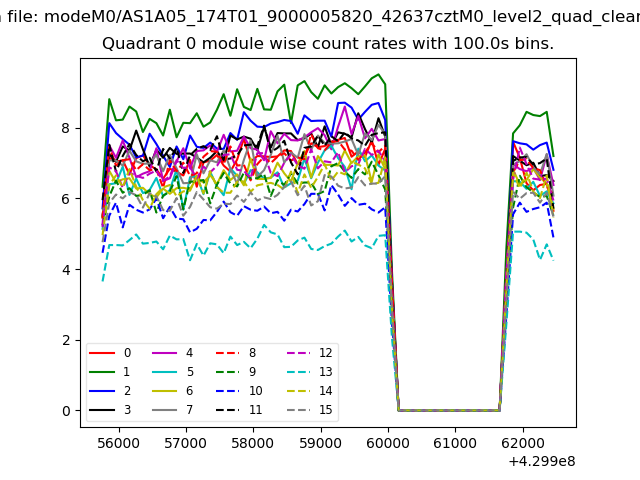 |
 |
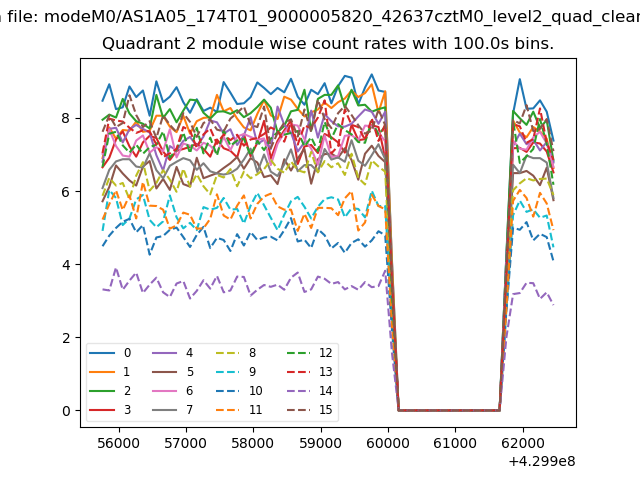
| Module-wise count rates for Quadrant B Data is divided into 100 sec bins |
 |
 |
| Module-wise count rates for Quadrant C Data is divided into 100 sec bins |
 |
 |
| Module-wise count rates for Quadrant D Data is divided into 100 sec bins |
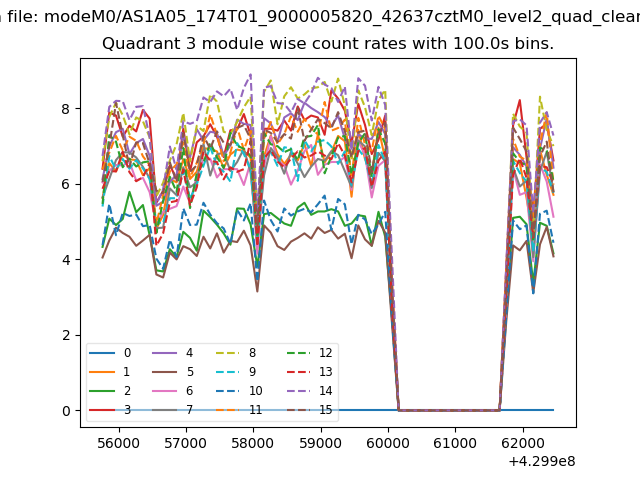 |
 |
| Parameter | Plot |
|---|---|
| CZT HV Monitor | 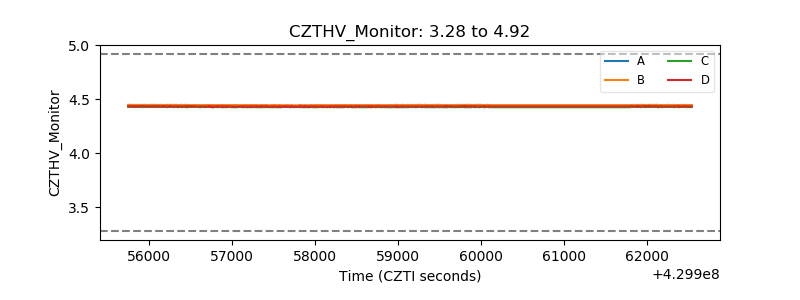 |
| D_VDD | 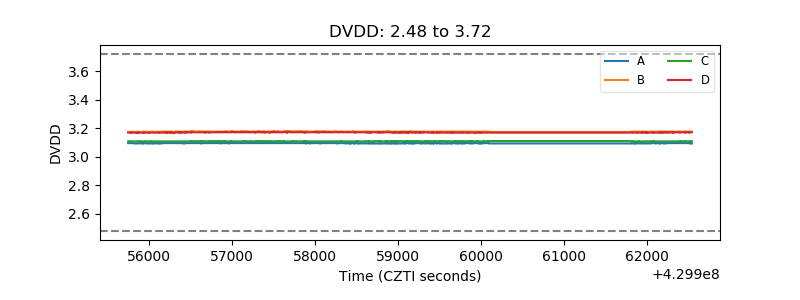 |
| Temperature 1 | 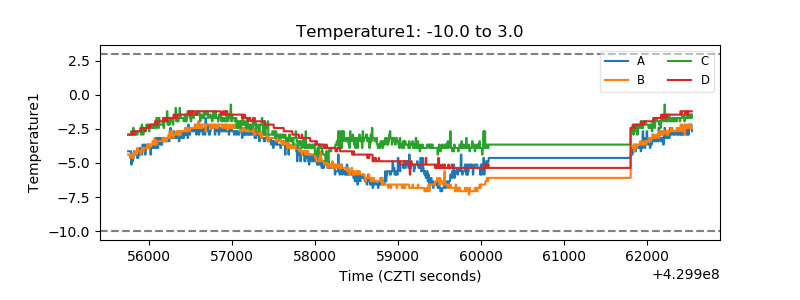 |
| Veto HV Monitor | 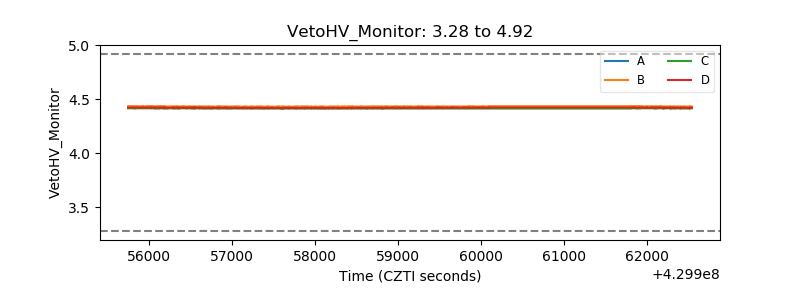 |
| Veto LLD | 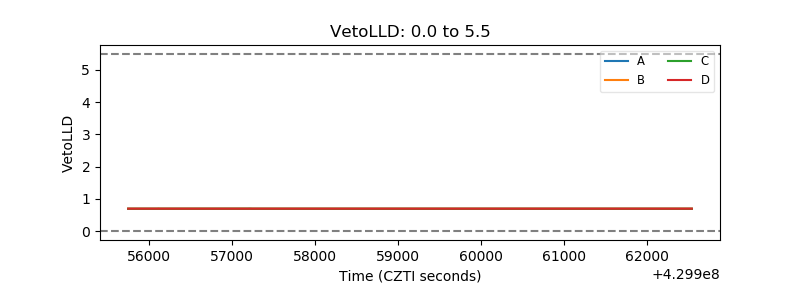 |
| Alpha Counter | 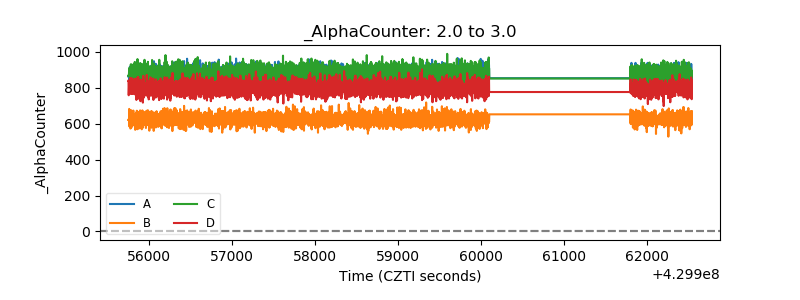 |
| _CPM_Rate | 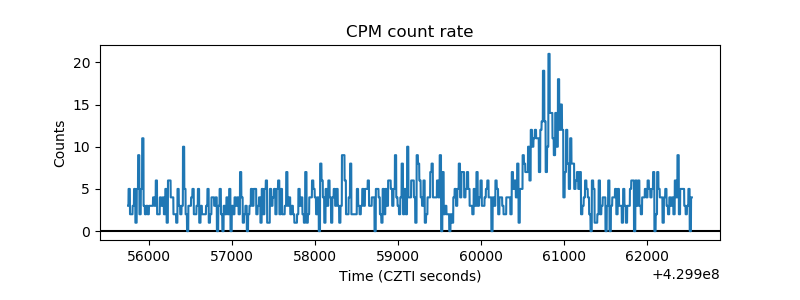 |
| CZT Counter | 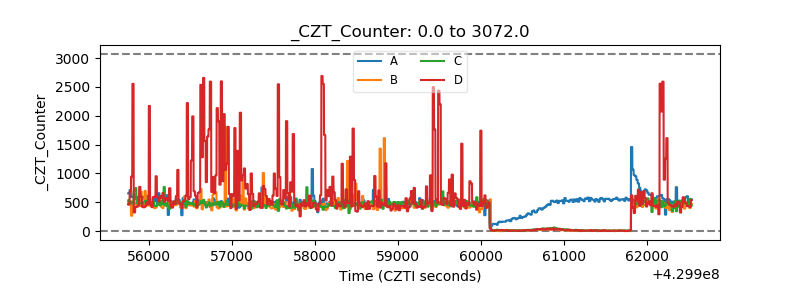 |
| +2.5 Volts monitor | 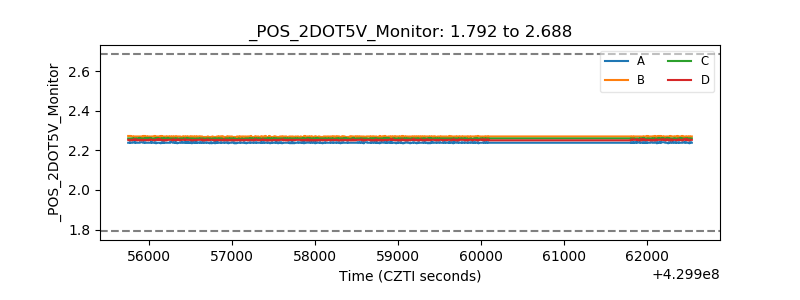 |
| +5 Volts monitor | 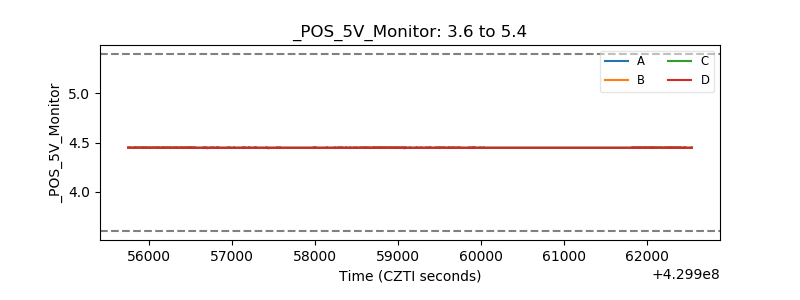 |
| _ROLL_ROT | 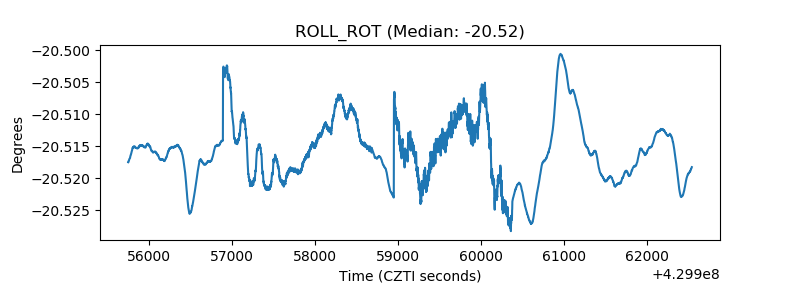 |
| _Roll_DEC | 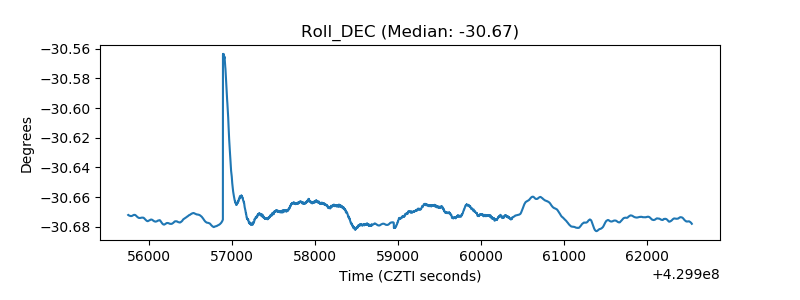 |
| _Roll_RA | 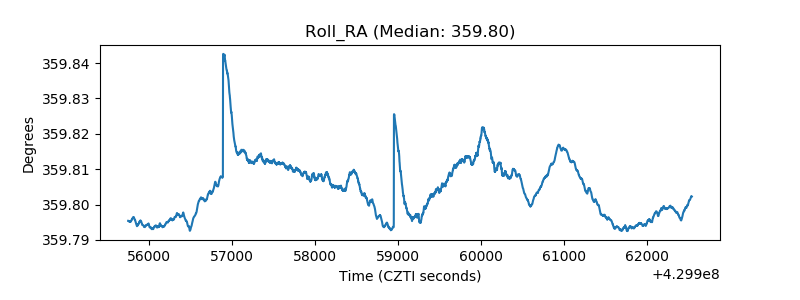 |
| Veto Counter | 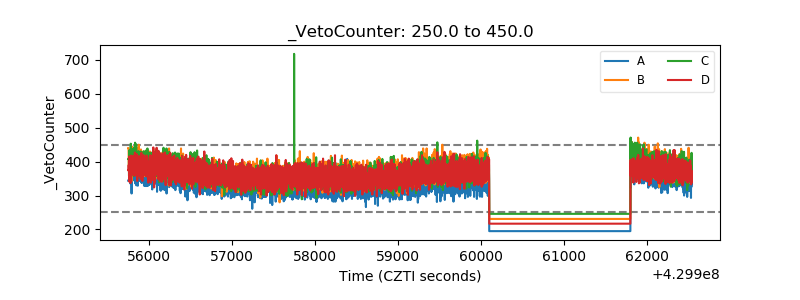 |