| Param | Original file | Final file |
|---|---|---|
| Filename | modeM0/AS1A05_174T01_9000005820_42638cztM0_level2.fits | modeM0/AS1A05_174T01_9000005820_42638cztM0_level2_quad_clean.evt |
| Size (bytes) | 381,931,200 | 103,985,280 |
| Size | 364.2 MB | 99.2 MB |
| Events in quadrant A | 3,438,869 | 693,761 |
| Events in quadrant B | 2,927,285 | 706,552 |
| Events in quadrant C | 3,009,421 | 689,170 |
| Events in quadrant D | 4,265,148 | 613,364 |
| Mode M9 | |||
|---|---|---|---|
| Quadrant | BADHDUFLAG | Total packets | Discarded packets |
| A | 0 | 31 | 0 |
| B | 0 | 31 | 0 |
| C | 0 | 31 | 0 |
| D | 0 | 31 | 0 |
| Mode SS | |||
|---|---|---|---|
| Quadrant | BADHDUFLAG | Total packets | Discarded packets |
| A | 0 | 132 | 0 |
| B | 0 | 132 | 0 |
| C | 0 | 132 | 0 |
| D | 0 | 132 | 0 |
| Mode M0 | |||
|---|---|---|---|
| Quadrant | BADHDUFLAG | Total packets | Discarded packets |
| A | 0 | 13956 | 2 |
| B | 0 | 13171 | 2 |
| C | 0 | 12868 | 3 |
| D | 0 | 17087 | 2 |
| Quadrant | Total seconds | Saturated seconds | Saturation percentage |
|---|---|---|---|
| A | 6386 | 19 | 0.297526% |
| B | 6386 | 14 | 0.219230% |
| C | 6386 | 4 | 0.062637% |
| D | 6386 | 330 | 5.167554% |
Noise dominated data is calculated using 1-second bins in cleaned event files. If a bin has >2000 counts, and if more than 50% of those come from <1% of pixels, then it is considered to be noise-dominated and hence unusable.
| Quadrant | # 1 sec bins | Bins with >0 counts | Bins with >2000 counts | High rate bins dominated by noise | Noise dominated (total time) | Noise dominated (detector-on time) | Marked lightcurve |
|---|---|---|---|---|---|---|---|
| A | 9492 | 6388 | 3 | 3 | 0.03% | 0.05% |  |
| B | 9492 | 6388 | 5 | 5 | 0.05% | 0.08% | 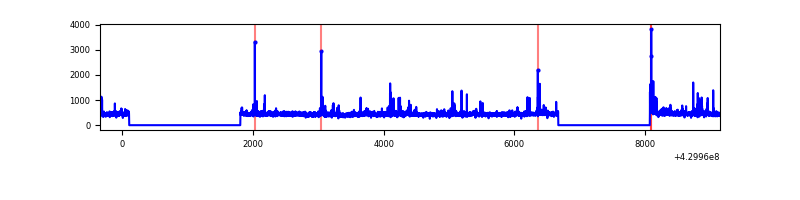 |
| C | 9492 | 6388 | 3 | 3 | 0.03% | 0.05% | 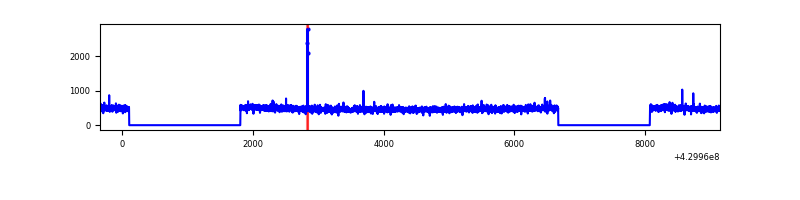 |
| D | 9492 | 6388 | 303 | 303 | 3.19% | 4.74% | 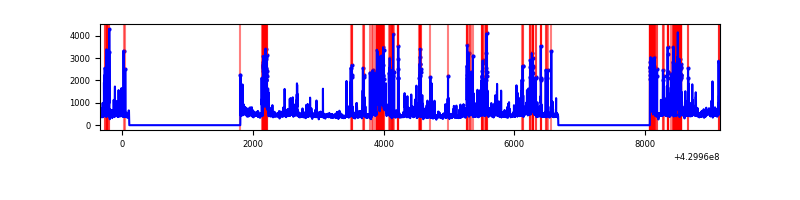 |
Top three noisy pixels from each quadrant. If the there are fewer than three noisy pixels in the level2.evt file, extra rows are filled as -1
| Pixel properties | Quadrant properties | ||||||
|---|---|---|---|---|---|---|---|
| Quadrant | DetID | PixID | Counts | Sigma | Mean | Median | Sigma |
| A | 10 | 83 | 630139 | 4305.73 | 702 | 686 | 146.2 |
| A | 13 | 248 | 52251 | 352.73 | 702 | 686 | 146.2 |
| A | 15 | 223 | 19697 | 130.04 | 702 | 686 | 146.2 |
| B | 0 | 245 | 78387 | 568.5 | 697 | 678 | 136.7 |
| B | 3 | 112 | 71018 | 514.59 | 697 | 678 | 136.7 |
| B | 5 | 172 | 24547 | 174.62 | 697 | 678 | 136.7 |
| C | 15 | 214 | 265548 | 1643.73 | 692 | 695 | 161.1 |
| C | 3 | 233 | 27380 | 165.61 | 692 | 695 | 161.1 |
| C | 14 | 254 | 15333 | 90.85 | 692 | 695 | 161.1 |
| D | 2 | 249 | 549510 | 3346.72 | 678 | 660 | 164.0 |
| D | 12 | 6 | 332284 | 2022.14 | 678 | 660 | 164.0 |
| D | 1 | 52 | 211979 | 1288.56 | 678 | 660 | 164.0 |
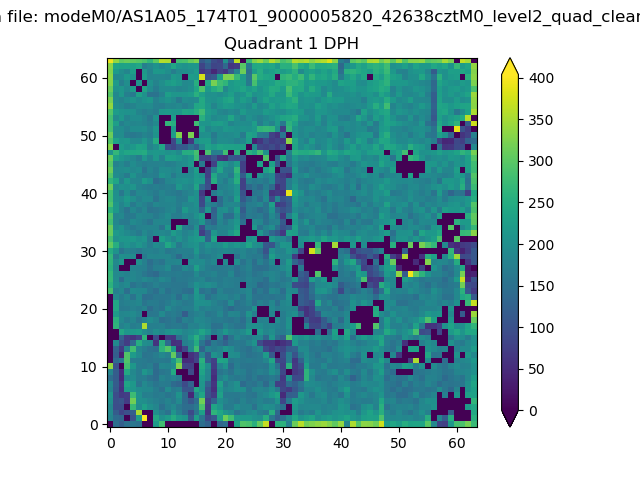
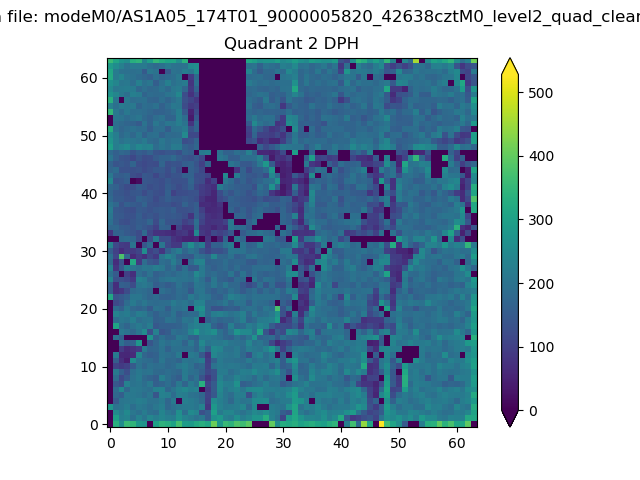
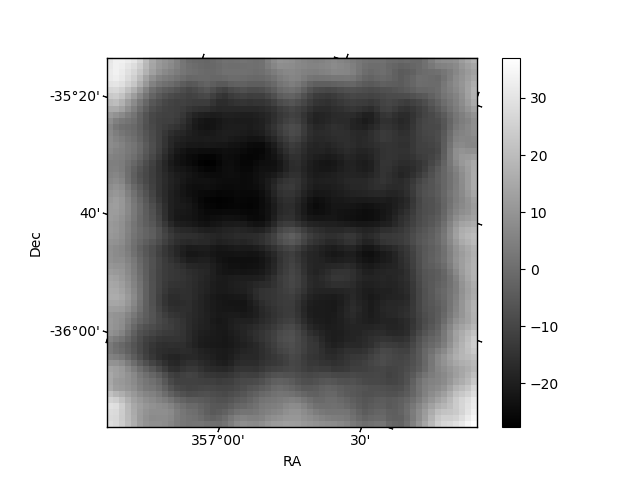
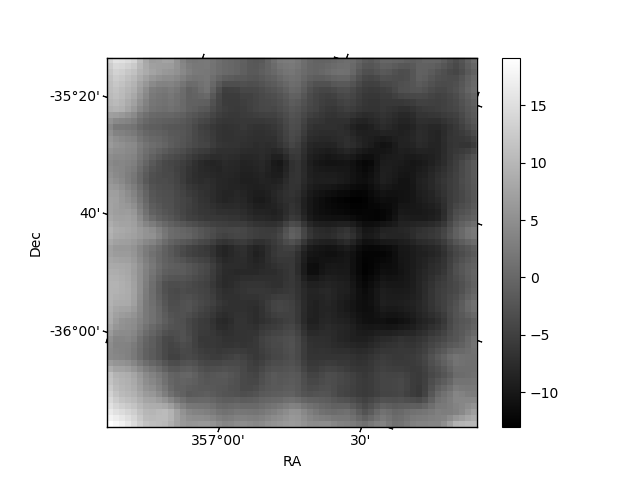
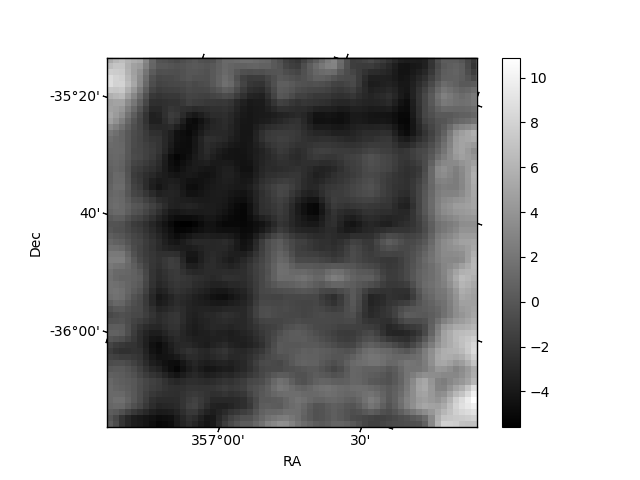
Histogram calculated using DETX and DETY for each event in the final _common_clean file
| Quadrant A | 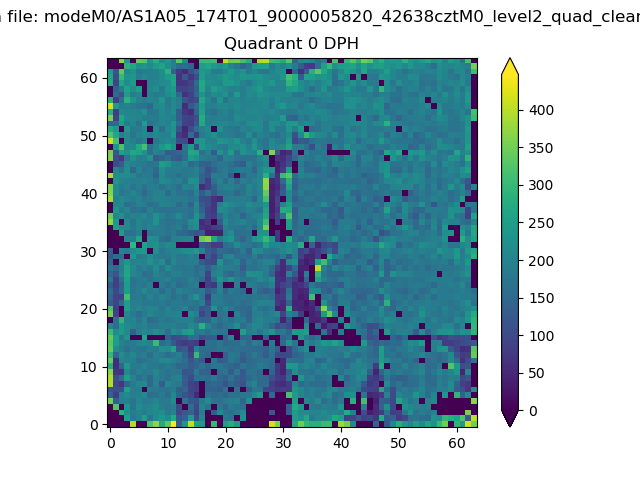 |
 |
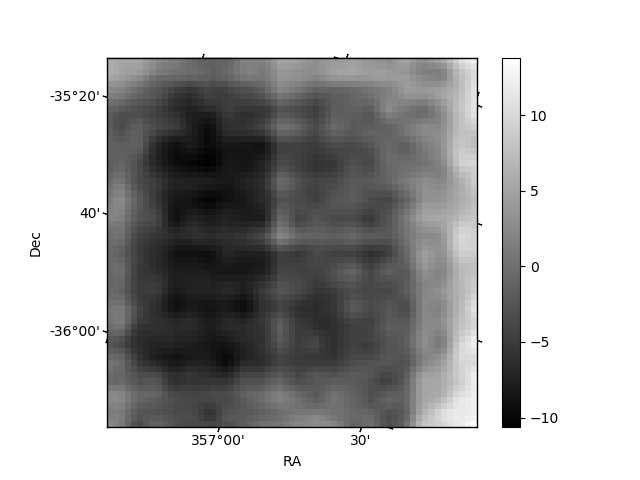
Quadrant B |
|---|---|---|---|
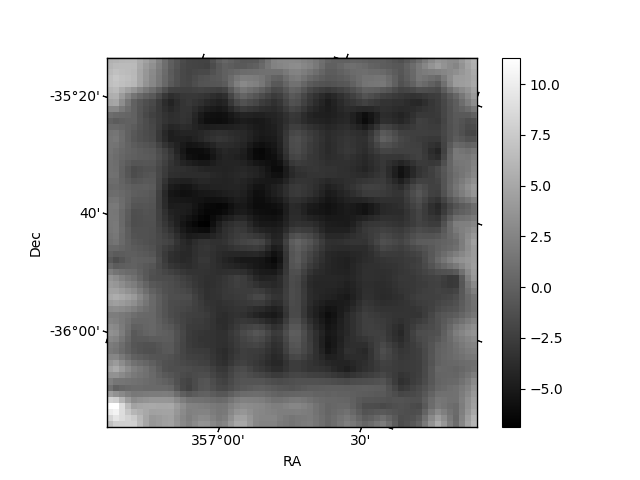
| Quadrant D | 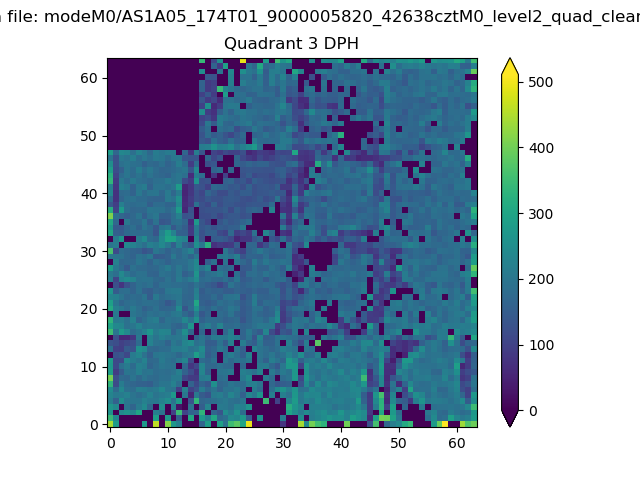 |
 |
Quadrant C |
| Plot type | Count rate plots | Images |
|---|---|---|
| Comparison with Poisson distribution Blue bars denote a histogram of data divided into 1 sec bins. Red curve is a Poisson curve with rate = median count rate of data. |
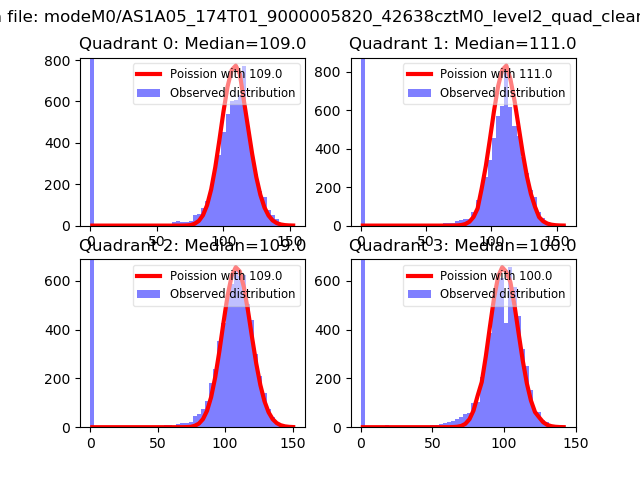 |
 |
| Quadrant-wise count rates Data is divided into 100 sec bins |
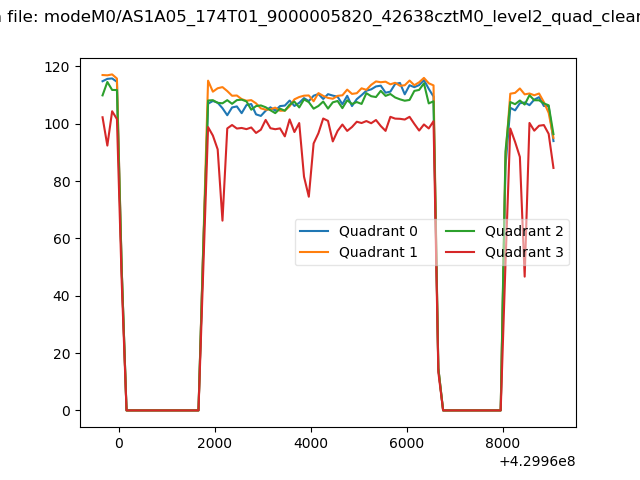 |
|
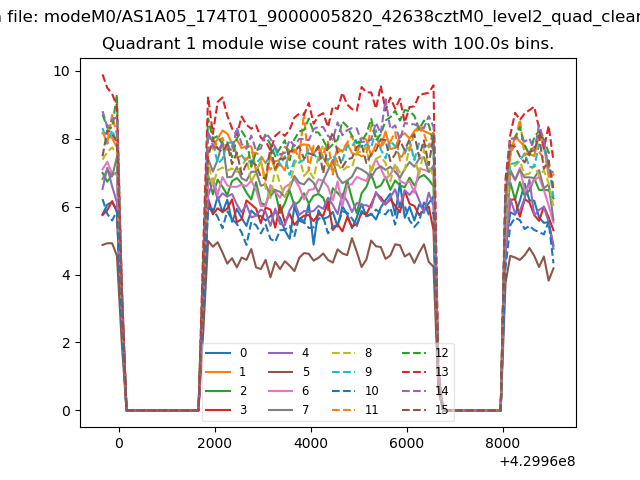
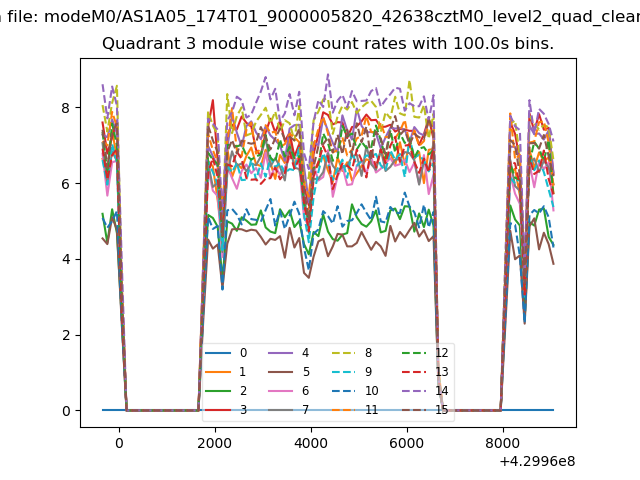
| Module-wise count rates for Quadrant A Data is divided into 100 sec bins |
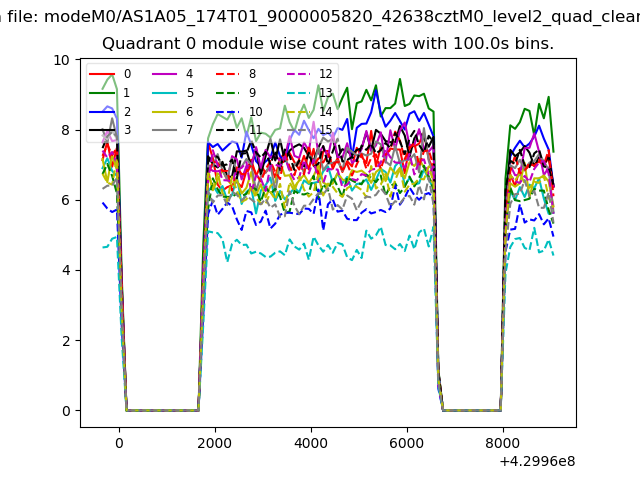 |
 |
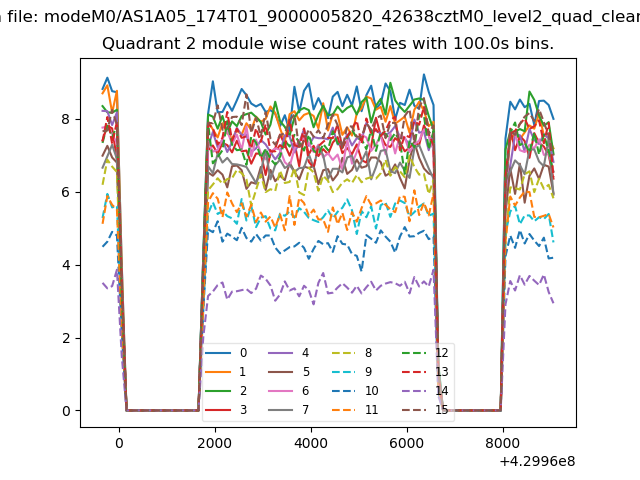
| Module-wise count rates for Quadrant B Data is divided into 100 sec bins |
 |
 |
| Module-wise count rates for Quadrant C Data is divided into 100 sec bins |
 |
 |
| Module-wise count rates for Quadrant D Data is divided into 100 sec bins |
 |
 |
| Parameter | Plot |
|---|---|
| CZT HV Monitor | 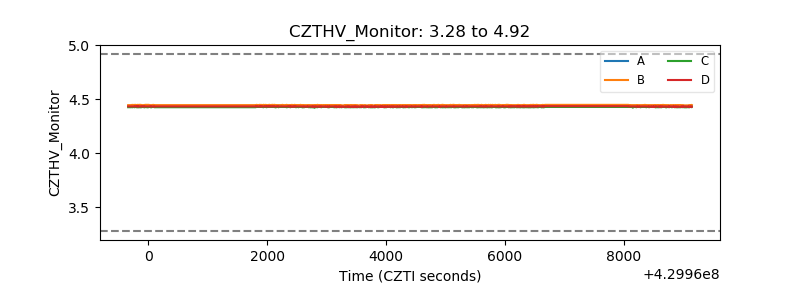 |
| D_VDD | 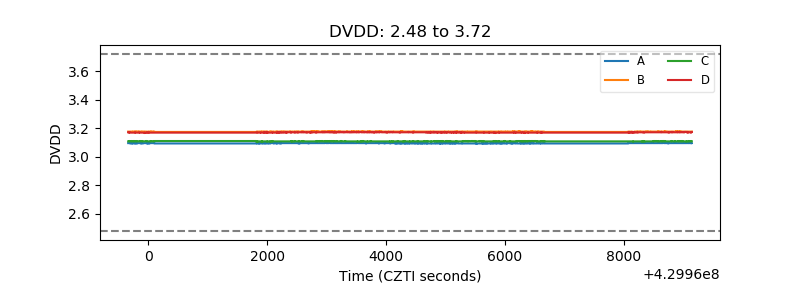 |
| Temperature 1 | 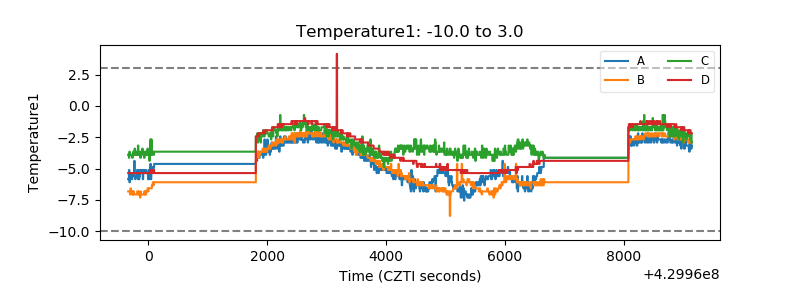 |
| Veto HV Monitor | 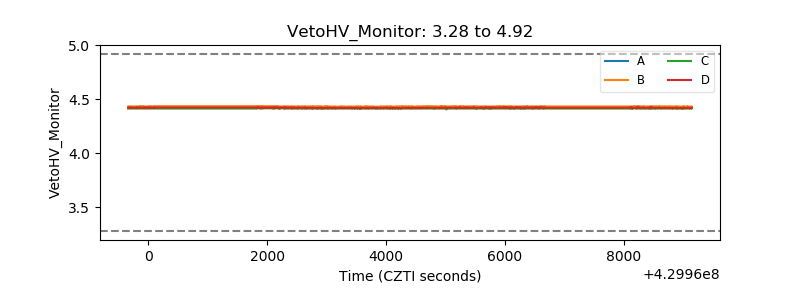 |
| Veto LLD | 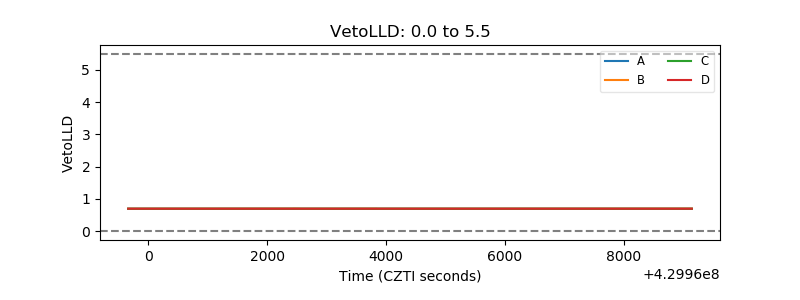 |
| Alpha Counter | 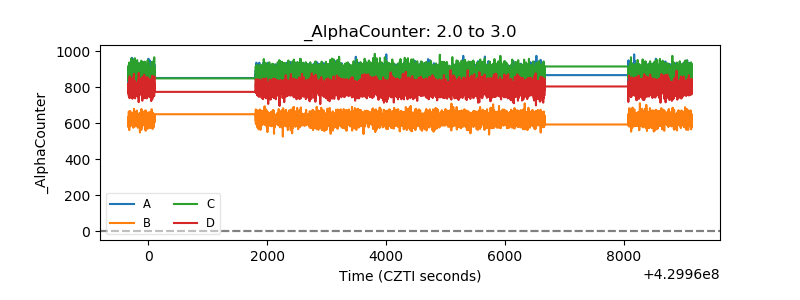 |
| _CPM_Rate | 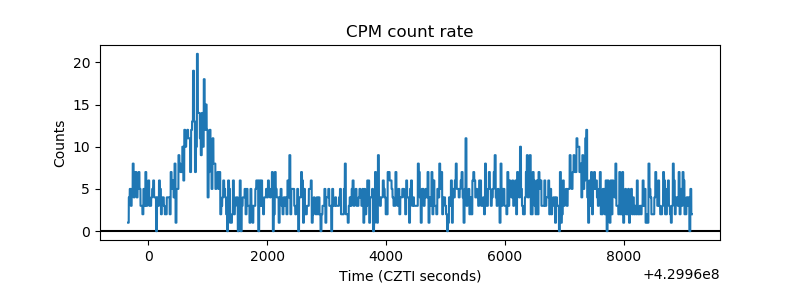 |
| CZT Counter | 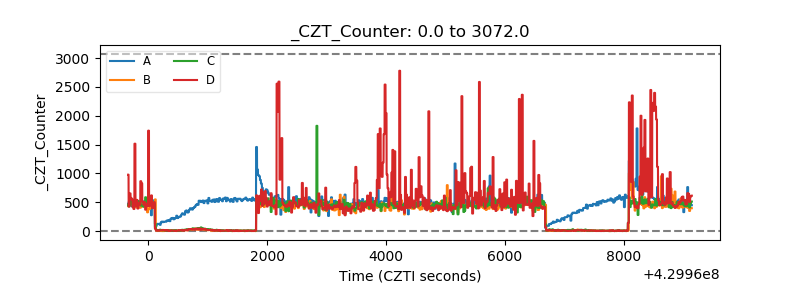 |
| +2.5 Volts monitor |  |
| +5 Volts monitor |  |
| _ROLL_ROT | 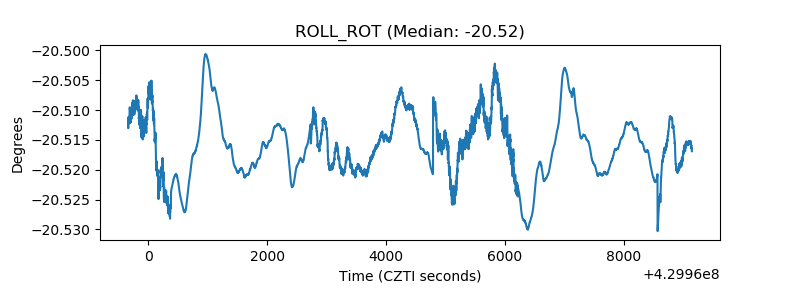 |
| _Roll_DEC | 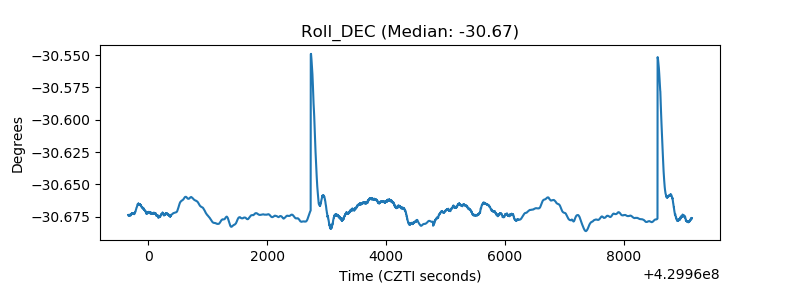 |
| _Roll_RA | 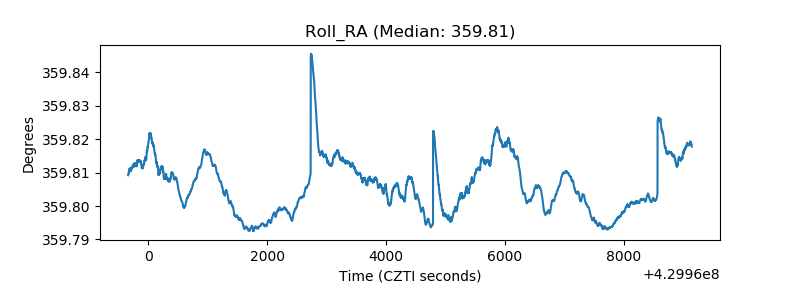 |
| Veto Counter | 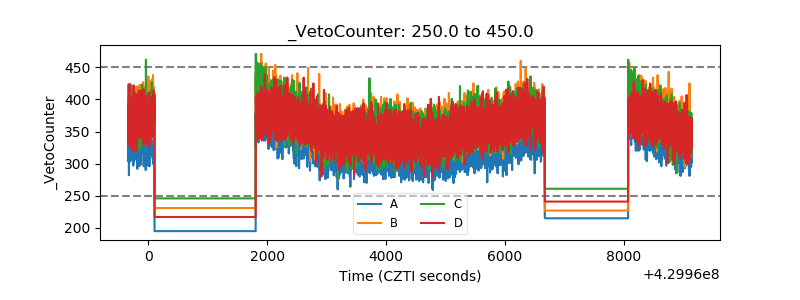 |