| Param | Original file | Final file |
|---|---|---|
| Filename | modeM0/AS1A05_174T01_9000005820_42639cztM0_level2.fits | modeM0/AS1A05_174T01_9000005820_42639cztM0_level2_quad_clean.evt |
| Size (bytes) | 350,818,560 | 98,835,840 |
| Size | 334.6 MB | 94.3 MB |
| Events in quadrant A | 3,288,399 | 659,866 |
| Events in quadrant B | 2,844,494 | 669,138 |
| Events in quadrant C | 2,833,167 | 650,090 |
| Events in quadrant D | 3,547,820 | 590,028 |
| Mode M9 | |||
|---|---|---|---|
| Quadrant | BADHDUFLAG | Total packets | Discarded packets |
| A | 0 | 24 | 0 |
| B | 0 | 25 | 0 |
| C | 0 | 25 | 0 |
| D | 0 | 25 | 0 |
| Mode SS | |||
|---|---|---|---|
| Quadrant | BADHDUFLAG | Total packets | Discarded packets |
| A | 0 | 124 | 0 |
| B | 0 | 124 | 0 |
| C | 0 | 124 | 0 |
| D | 0 | 124 | 0 |
| Mode M0 | |||
|---|---|---|---|
| Quadrant | BADHDUFLAG | Total packets | Discarded packets |
| A | 0 | 13399 | 2 |
| B | 0 | 12657 | 2 |
| C | 0 | 12194 | 2 |
| D | 0 | 14776 | 2 |
| Quadrant | Total seconds | Saturated seconds | Saturation percentage |
|---|---|---|---|
| A | 6064 | 22 | 0.362797% |
| B | 6064 | 29 | 0.478232% |
| C | 6064 | 5 | 0.082454% |
| D | 6064 | 213 | 3.512533% |
Noise dominated data is calculated using 1-second bins in cleaned event files. If a bin has >2000 counts, and if more than 50% of those come from <1% of pixels, then it is considered to be noise-dominated and hence unusable.
| Quadrant | # 1 sec bins | Bins with >0 counts | Bins with >2000 counts | High rate bins dominated by noise | Noise dominated (total time) | Noise dominated (detector-on time) | Marked lightcurve |
|---|---|---|---|---|---|---|---|
| A | 7376 | 6065 | 2 | 2 | 0.03% | 0.03% | 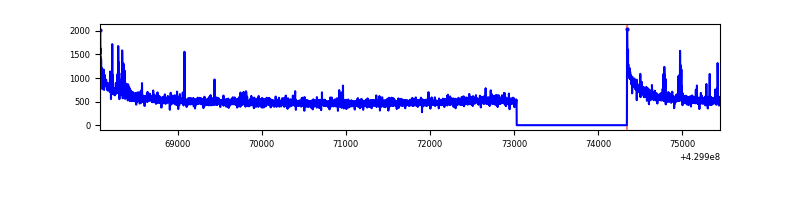 |
| B | 7376 | 6065 | 13 | 13 | 0.18% | 0.21% | 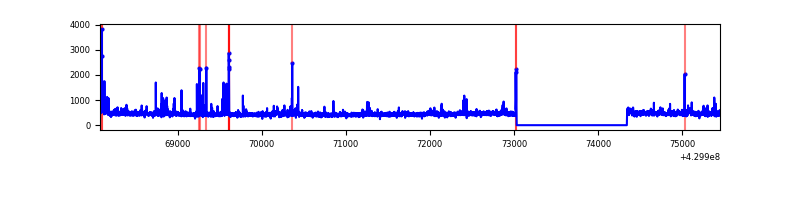 |
| C | 7376 | 6065 | 0 | 0 | 0.00% | 0.00% | 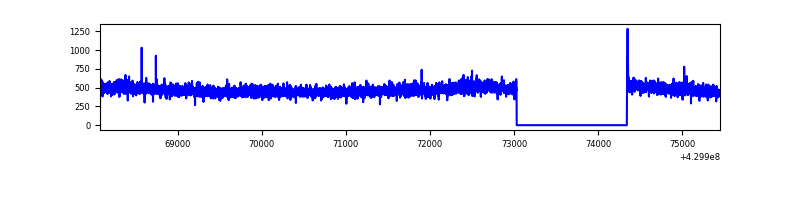 |
| D | 7376 | 6065 | 175 | 175 | 2.37% | 2.89% | 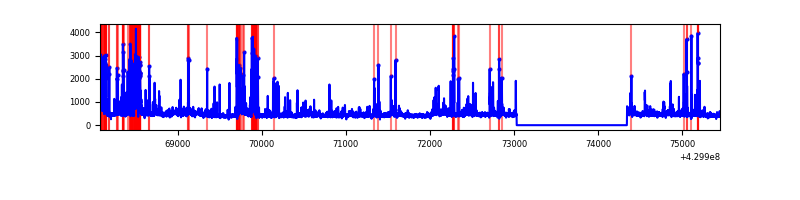 |
Top three noisy pixels from each quadrant. If the there are fewer than three noisy pixels in the level2.evt file, extra rows are filled as -1
| Pixel properties | Quadrant properties | ||||||
|---|---|---|---|---|---|---|---|
| Quadrant | DetID | PixID | Counts | Sigma | Mean | Median | Sigma |
| A | 10 | 83 | 610175 | 4410.14 | 666 | 651 | 138.2 |
| A | 13 | 248 | 76221 | 546.78 | 666 | 651 | 138.2 |
| A | 2 | 79 | 23415 | 164.71 | 666 | 651 | 138.2 |
| B | 0 | 245 | 119406 | 913.16 | 662 | 642 | 130.1 |
| B | 3 | 112 | 33630 | 253.64 | 662 | 642 | 130.1 |
| B | 0 | 229 | 28193 | 211.84 | 662 | 642 | 130.1 |
| C | 15 | 214 | 253000 | 1649.77 | 653 | 657 | 153.0 |
| C | 3 | 233 | 29936 | 191.42 | 653 | 657 | 153.0 |
| C | 13 | 61 | 4260 | 23.56 | 653 | 657 | 153.0 |
| D | 1 | 52 | 313581 | 1972.79 | 646 | 629 | 158.6 |
| D | 2 | 249 | 277941 | 1748.12 | 646 | 629 | 158.6 |
| D | 5 | 32 | 202408 | 1271.98 | 646 | 629 | 158.6 |
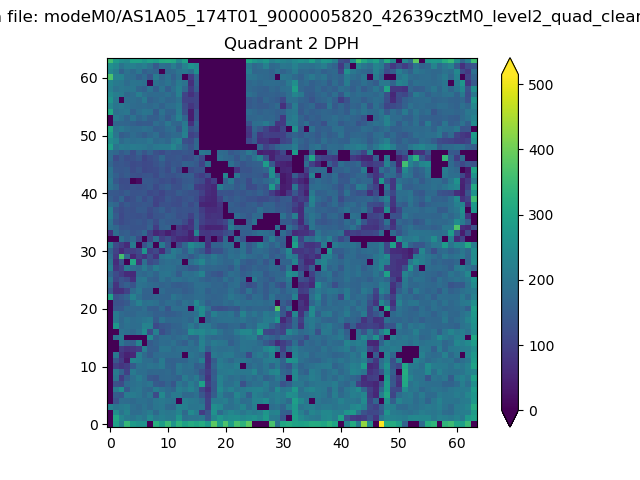
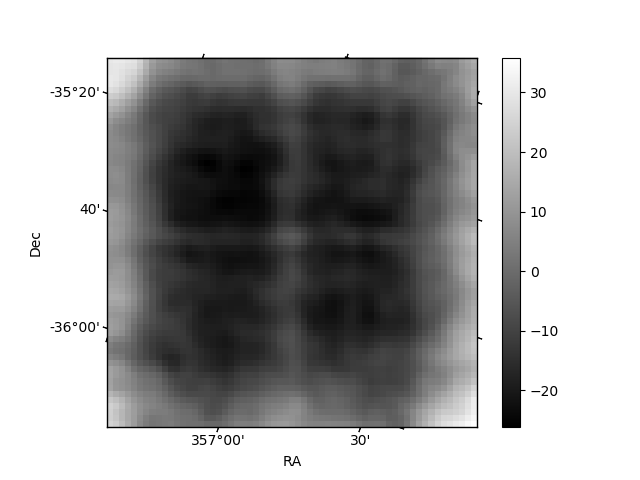
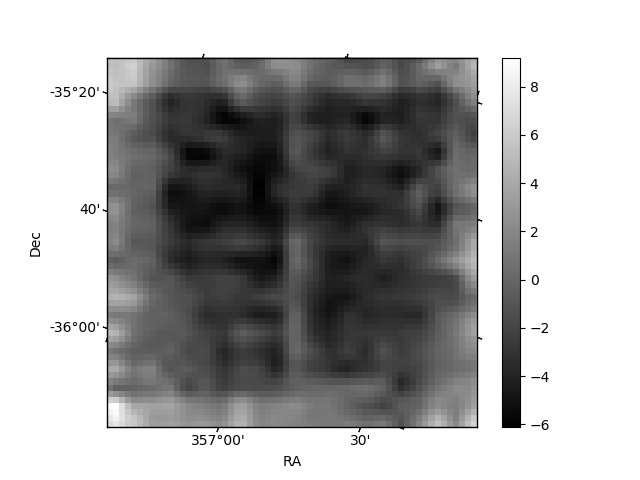
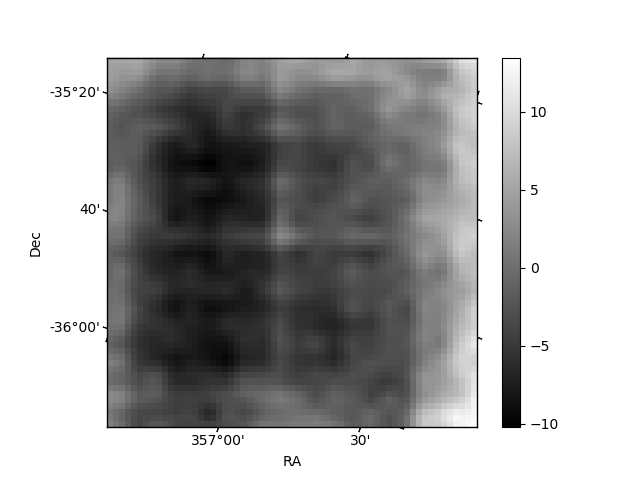
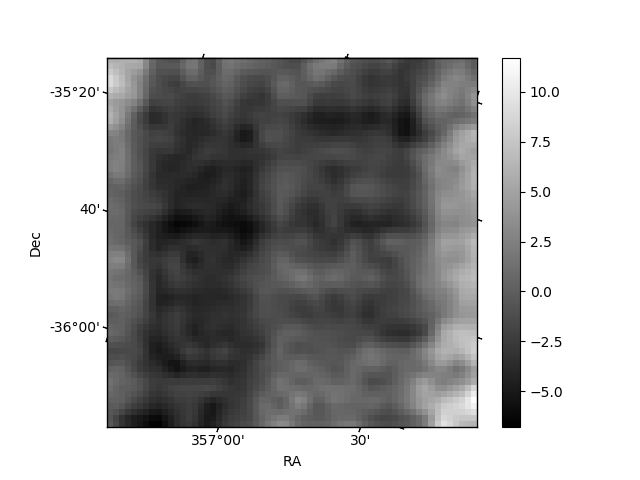
Histogram calculated using DETX and DETY for each event in the final _common_clean file
| Quadrant A | 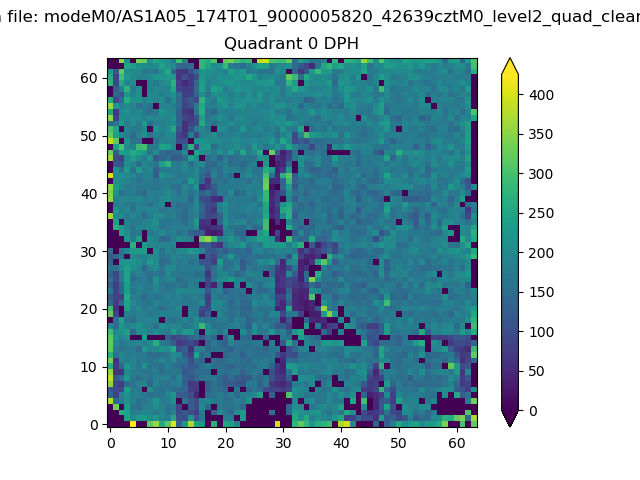 |
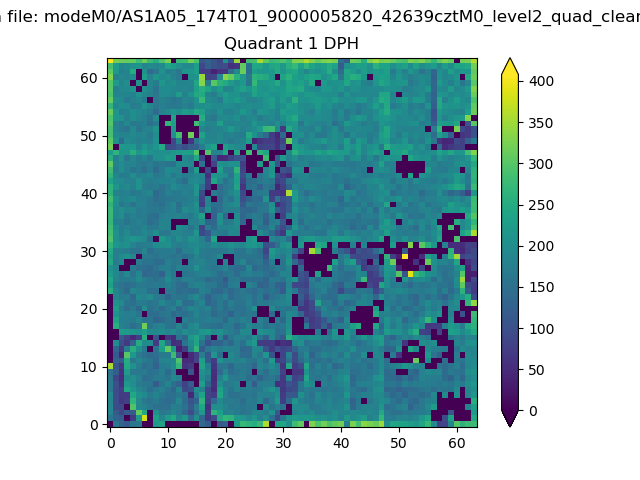 |
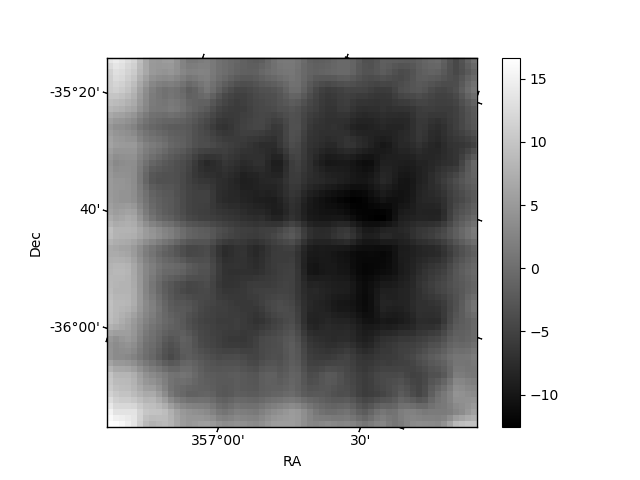
Quadrant B |
|---|---|---|---|
| Quadrant D | 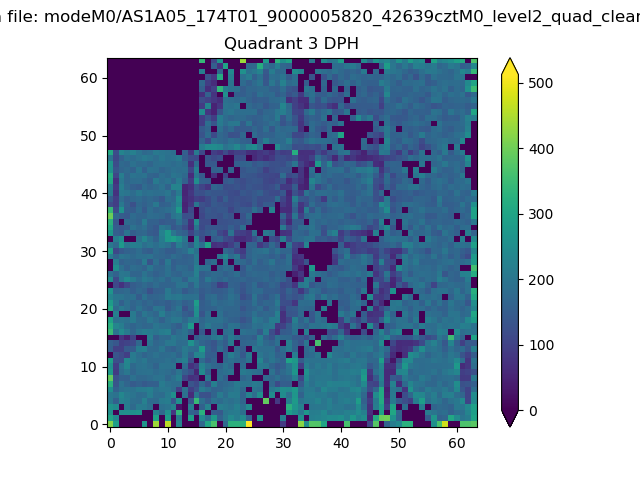 |
 |
Quadrant C |
| Plot type | Count rate plots | Images |
|---|---|---|
| Comparison with Poisson distribution Blue bars denote a histogram of data divided into 1 sec bins. Red curve is a Poisson curve with rate = median count rate of data. |
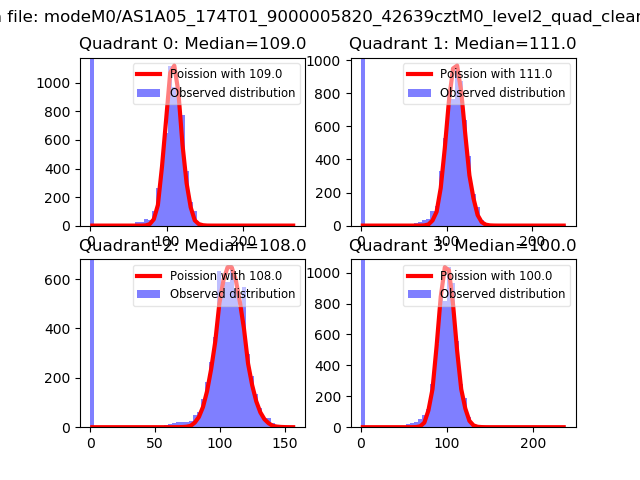 |
 |
| Quadrant-wise count rates Data is divided into 100 sec bins |
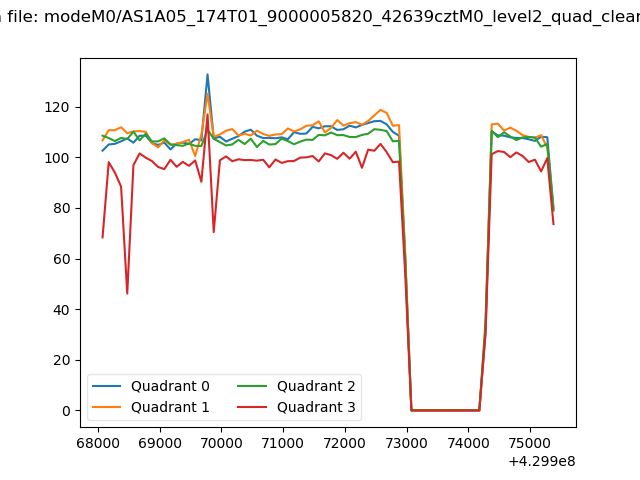 |
|
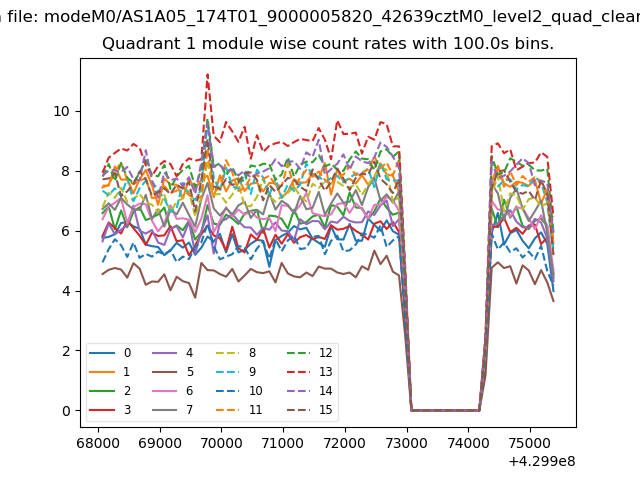
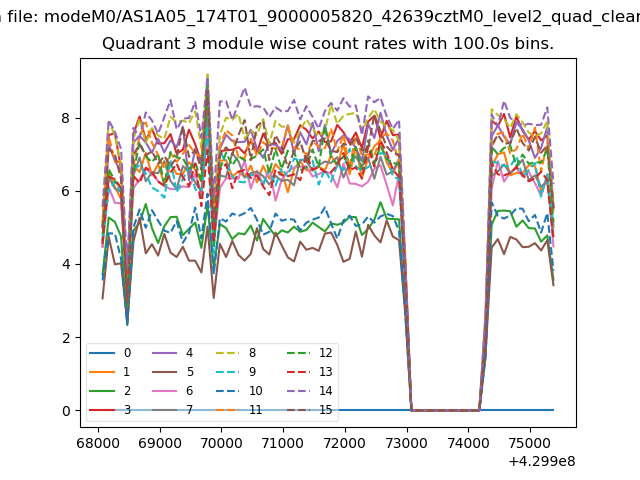
| Module-wise count rates for Quadrant A Data is divided into 100 sec bins |
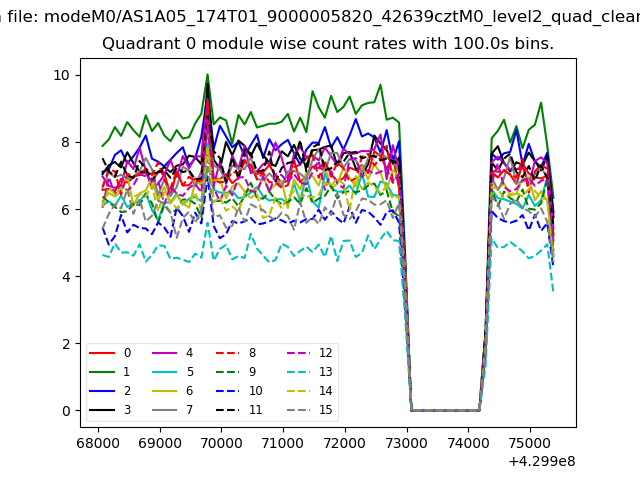 |
 |
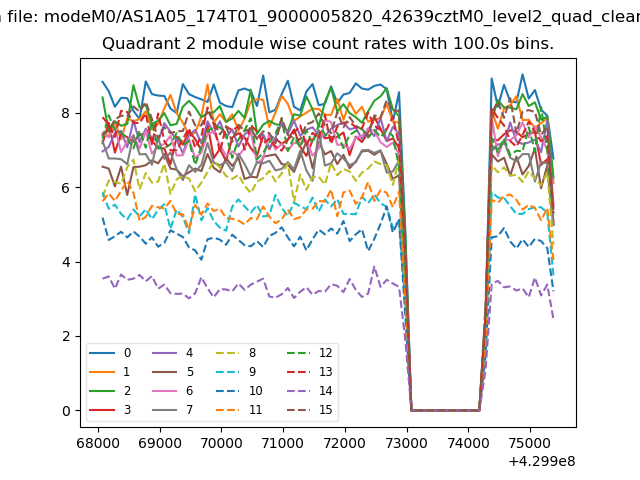
| Module-wise count rates for Quadrant B Data is divided into 100 sec bins |
 |
 |
| Module-wise count rates for Quadrant C Data is divided into 100 sec bins |
 |
 |
| Module-wise count rates for Quadrant D Data is divided into 100 sec bins |
 |
 |
| Parameter | Plot |
|---|---|
| CZT HV Monitor | 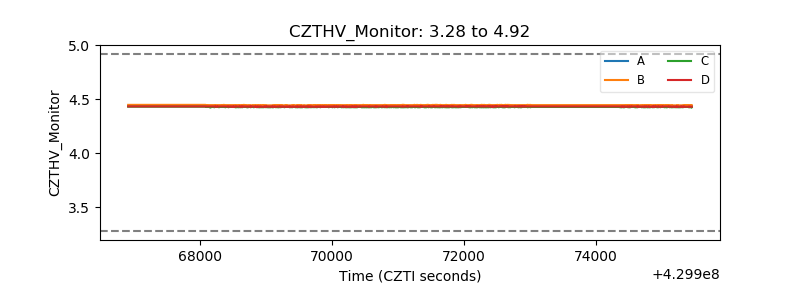 |
| D_VDD | 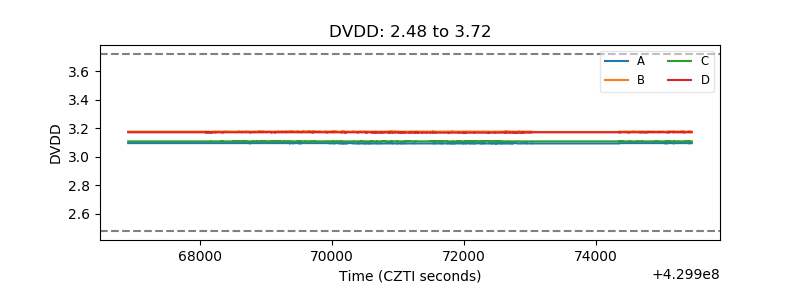 |
| Temperature 1 | 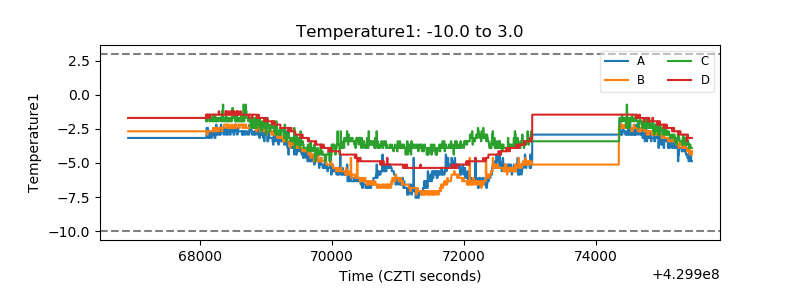 |
| Veto HV Monitor | 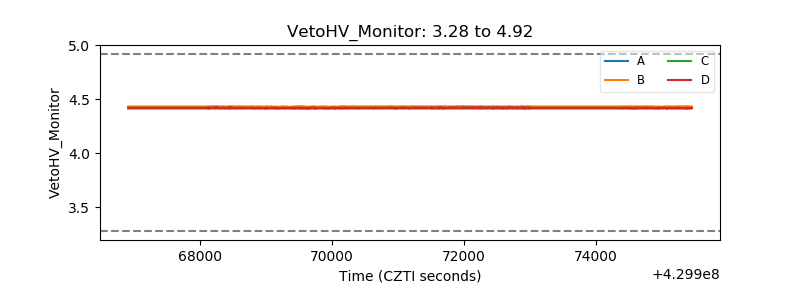 |
| Veto LLD | 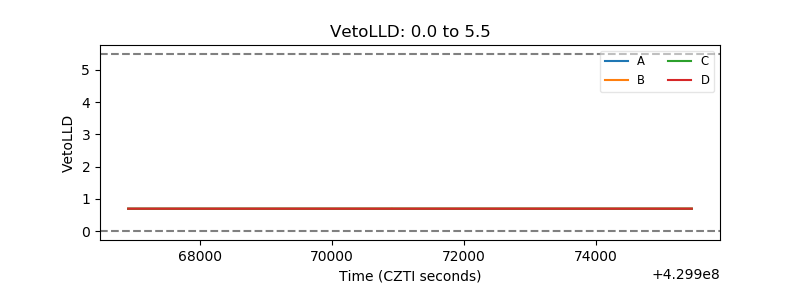 |
| Alpha Counter | 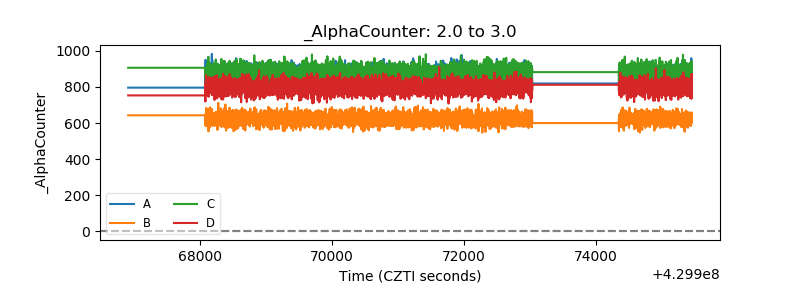 |
| _CPM_Rate | 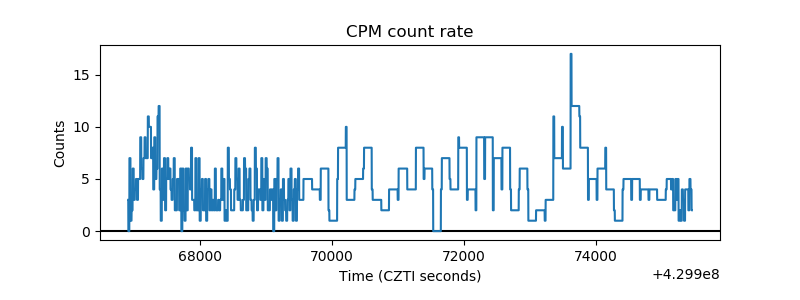 |
| CZT Counter | 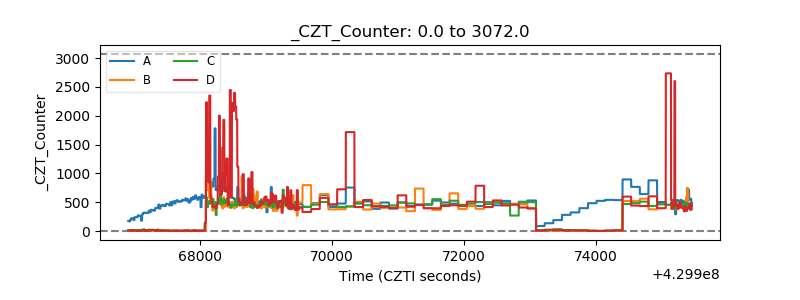 |
| +2.5 Volts monitor | 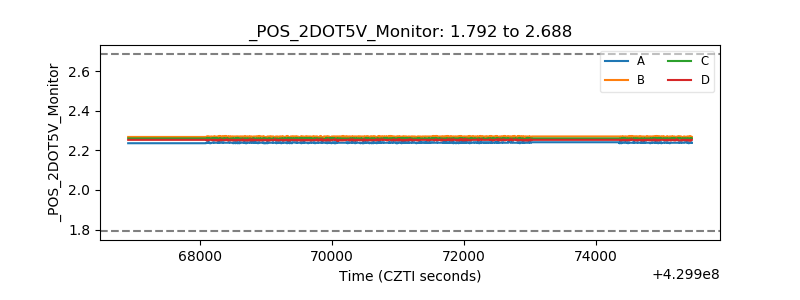 |
| +5 Volts monitor | 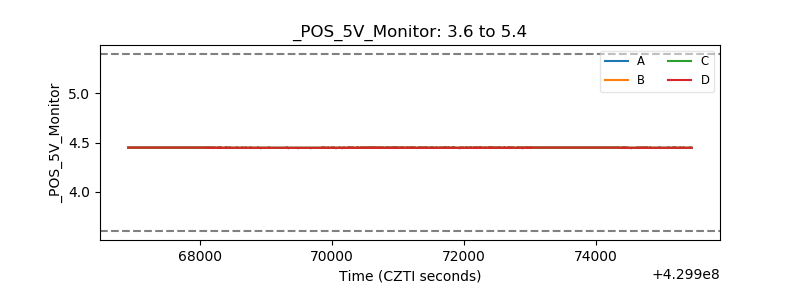 |
| _ROLL_ROT | 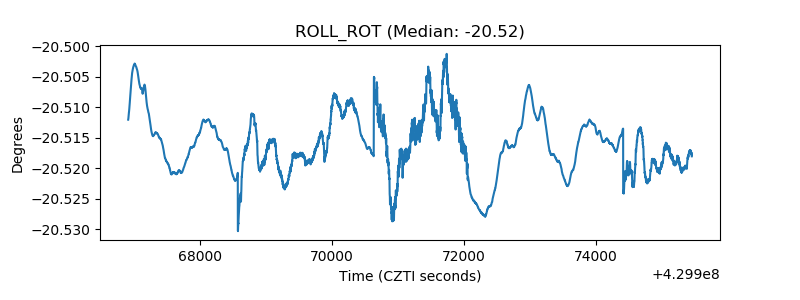 |
| _Roll_DEC | 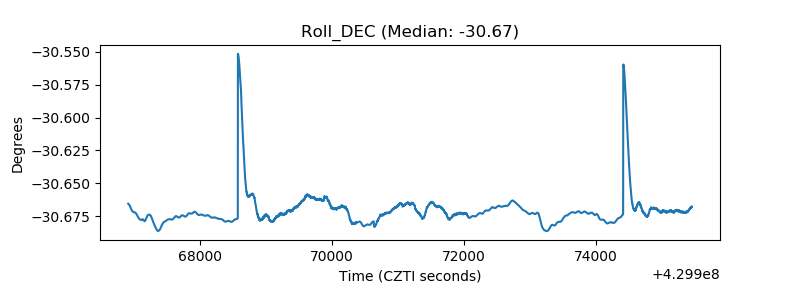 |
| _Roll_RA |  |
| Veto Counter | 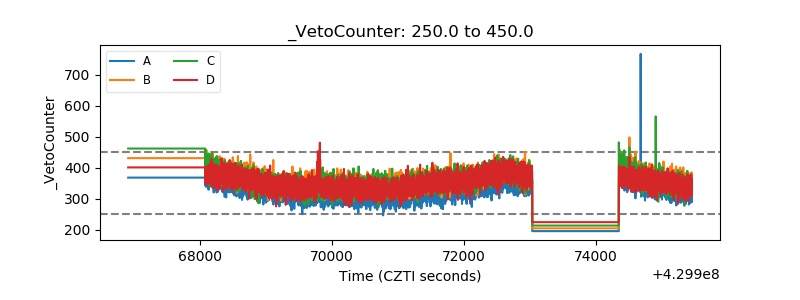 |