| Param | Original file | Final file |
|---|---|---|
| Filename | modeM0/AS1A05_174T01_9000005820_42642cztM0_level2.fits | modeM0/AS1A05_174T01_9000005820_42642cztM0_level2_quad_clean.evt |
| Size (bytes) | 796,032,000 | 206,714,880 |
| Size | 759.2 MB | 197.1 MB |
| Events in quadrant A | 7,994,732 | 1,374,040 |
| Events in quadrant B | 6,596,562 | 1,392,079 |
| Events in quadrant C | 6,124,066 | 1,360,416 |
| Events in quadrant D | 7,748,262 | 1,238,641 |
| Mode M9 | |||
|---|---|---|---|
| Quadrant | BADHDUFLAG | Total packets | Discarded packets |
| A | 0 | 41 | 0 |
| B | 0 | 41 | 0 |
| C | 0 | 41 | 0 |
| D | 0 | 41 | 0 |
| Mode SS | |||
|---|---|---|---|
| Quadrant | BADHDUFLAG | Total packets | Discarded packets |
| A | 0 | 262 | 0 |
| B | 0 | 262 | 0 |
| C | 0 | 262 | 0 |
| D | 0 | 262 | 0 |
| Mode M0 | |||
|---|---|---|---|
| Quadrant | BADHDUFLAG | Total packets | Discarded packets |
| A | 0 | 31902 | 3 |
| B | 0 | 28637 | 3 |
| C | 0 | 26271 | 3 |
| D | 0 | 32169 | 3 |
| Quadrant | Total seconds | Saturated seconds | Saturation percentage |
|---|---|---|---|
| A | 12939 | 203 | 1.568900% |
| B | 12940 | 261 | 2.017002% |
| C | 12939 | 7 | 0.054100% |
| D | 12939 | 385 | 2.975500% |
Noise dominated data is calculated using 1-second bins in cleaned event files. If a bin has >2000 counts, and if more than 50% of those come from <1% of pixels, then it is considered to be noise-dominated and hence unusable.
| Quadrant | # 1 sec bins | Bins with >0 counts | Bins with >2000 counts | High rate bins dominated by noise | Noise dominated (total time) | Noise dominated (detector-on time) | Marked lightcurve |
|---|---|---|---|---|---|---|---|
| A | 16965 | 12942 | 196 | 196 | 1.16% | 1.51% | 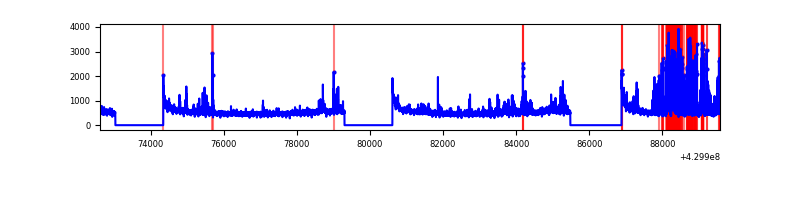 |
| B | 16966 | 12943 | 207 | 207 | 1.22% | 1.60% | 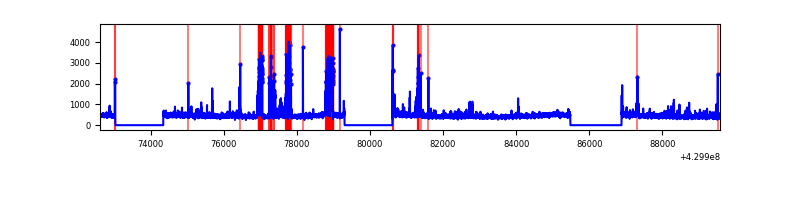 |
| C | 16965 | 12942 | 0 | 0 | 0.00% | 0.00% | 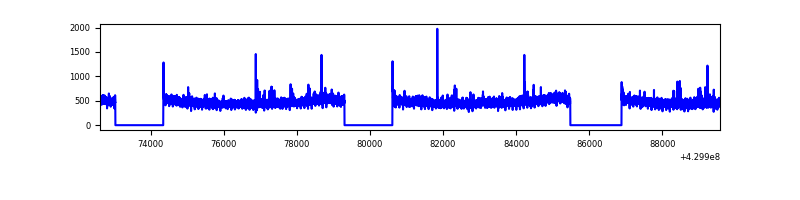 |
| D | 16965 | 12942 | 361 | 361 | 2.13% | 2.79% | 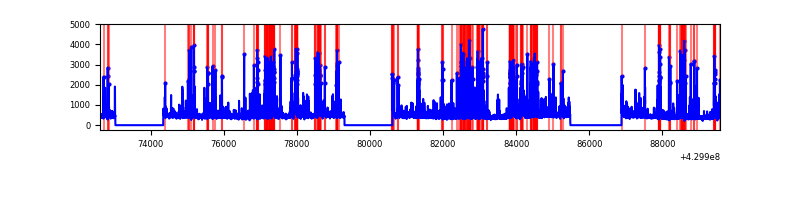 |
Top three noisy pixels from each quadrant. If the there are fewer than three noisy pixels in the level2.evt file, extra rows are filled as -1
| Pixel properties | Quadrant properties | ||||||
|---|---|---|---|---|---|---|---|
| Quadrant | DetID | PixID | Counts | Sigma | Mean | Median | Sigma |
| A | 13 | 248 | 1373854 | 4762.97 | 1396 | 1366 | 288.2 |
| A | 10 | 83 | 1147954 | 3979.02 | 1396 | 1366 | 288.2 |
| A | 2 | 79 | 62014 | 210.47 | 1396 | 1366 | 288.2 |
| B | 0 | 229 | 817448 | 3012.16 | 1385 | 1345 | 270.9 |
| B | 0 | 245 | 242996 | 891.91 | 1385 | 1345 | 270.9 |
| B | 3 | 112 | 61063 | 220.41 | 1385 | 1345 | 270.9 |
| C | 15 | 214 | 527731 | 1629.38 | 1380 | 1389 | 323.0 |
| C | 3 | 233 | 171908 | 527.87 | 1380 | 1389 | 323.0 |
| C | 5 | 250 | 21462 | 62.14 | 1380 | 1389 | 323.0 |
| D | 12 | 6 | 939644 | 2792.79 | 1361 | 1321 | 336.0 |
| D | 2 | 249 | 797003 | 2368.24 | 1361 | 1321 | 336.0 |
| D | 12 | 233 | 204806 | 605.65 | 1361 | 1321 | 336.0 |
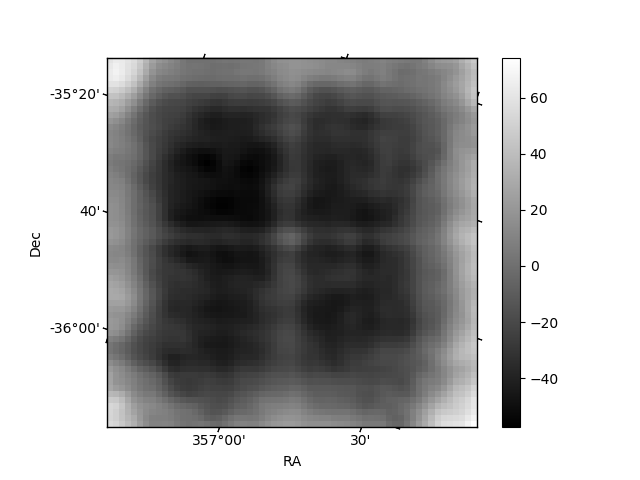
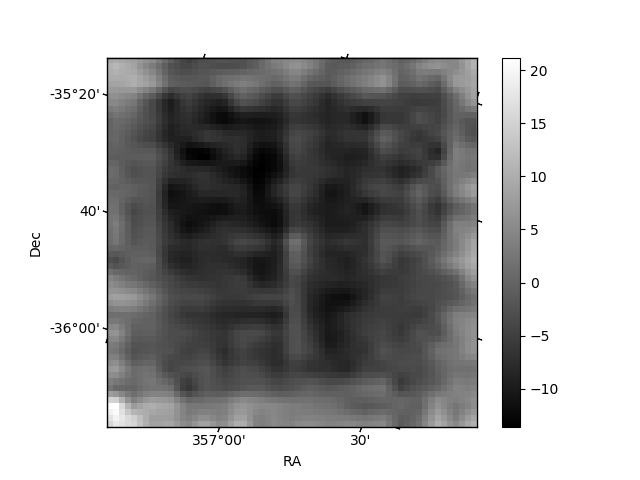
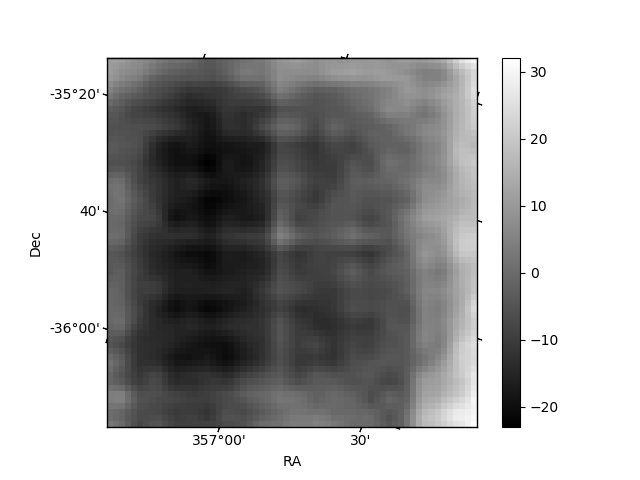
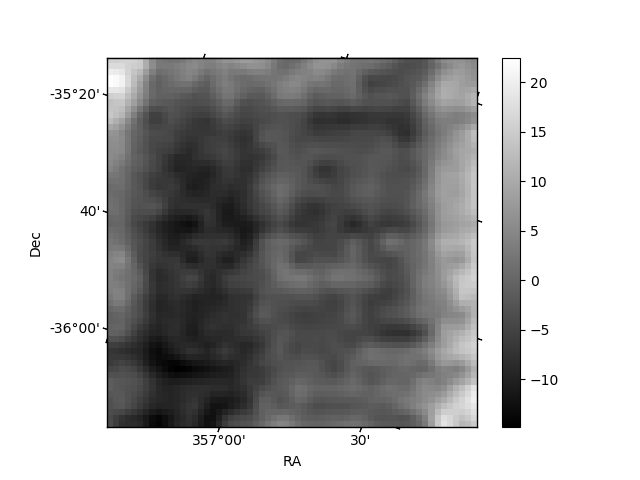
Histogram calculated using DETX and DETY for each event in the final _common_clean file
| Quadrant A | 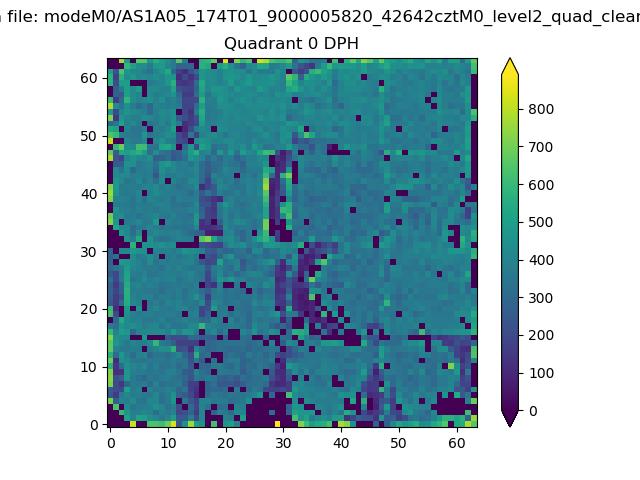 |
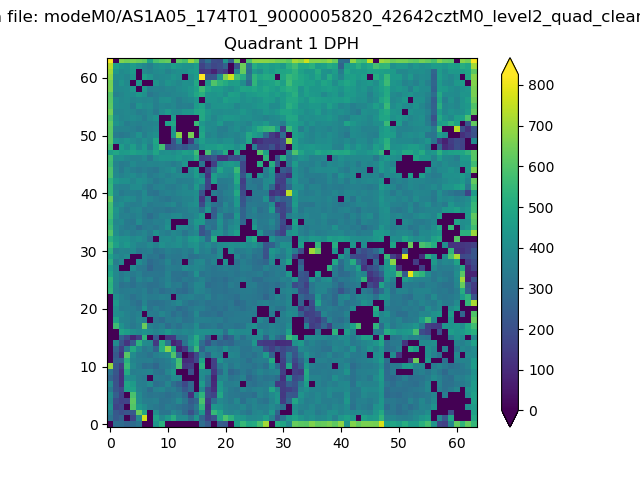 |
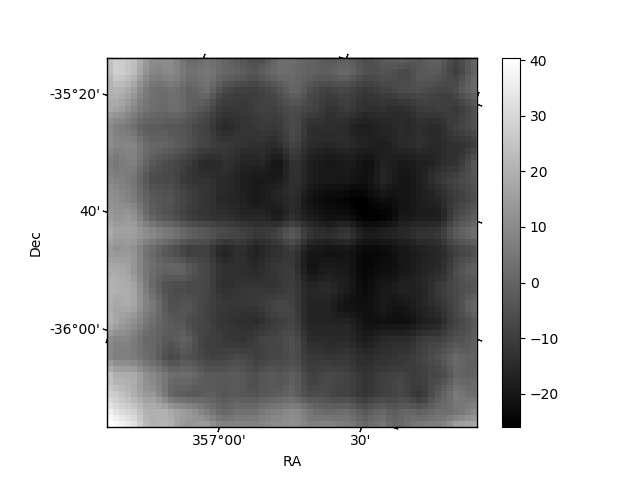
Quadrant B |
|---|---|---|---|
| Quadrant D | 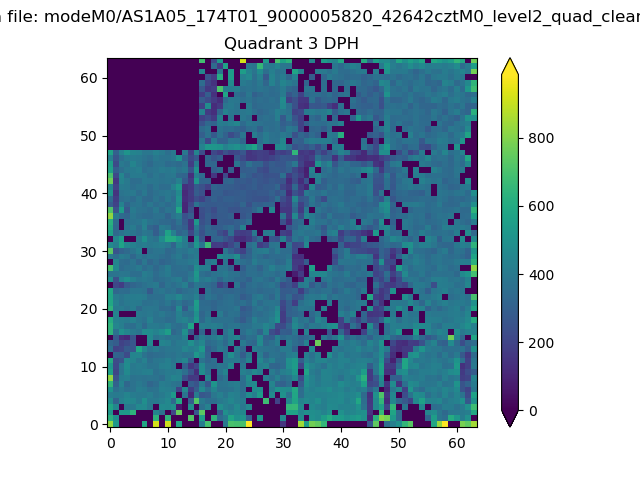 |
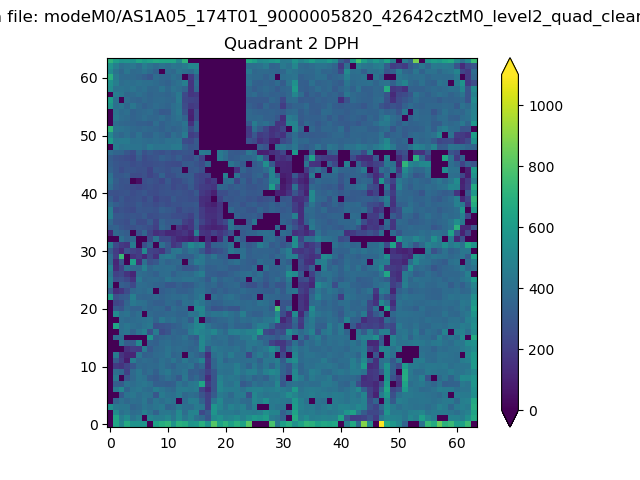 |
Quadrant C |
| Plot type | Count rate plots | Images |
|---|---|---|
| Comparison with Poisson distribution Blue bars denote a histogram of data divided into 1 sec bins. Red curve is a Poisson curve with rate = median count rate of data. |
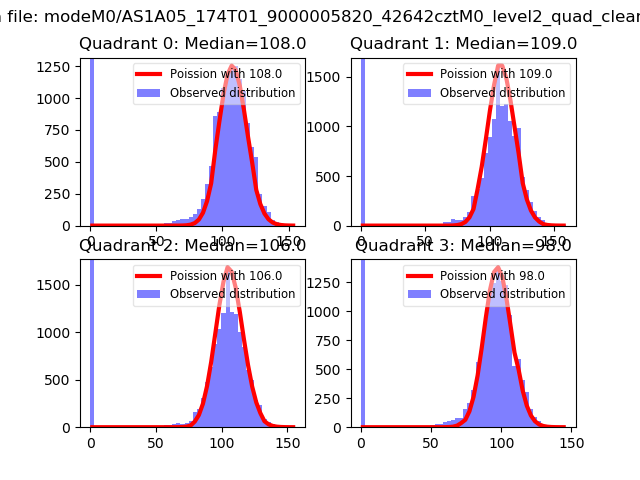 |
 |
| Quadrant-wise count rates Data is divided into 100 sec bins |
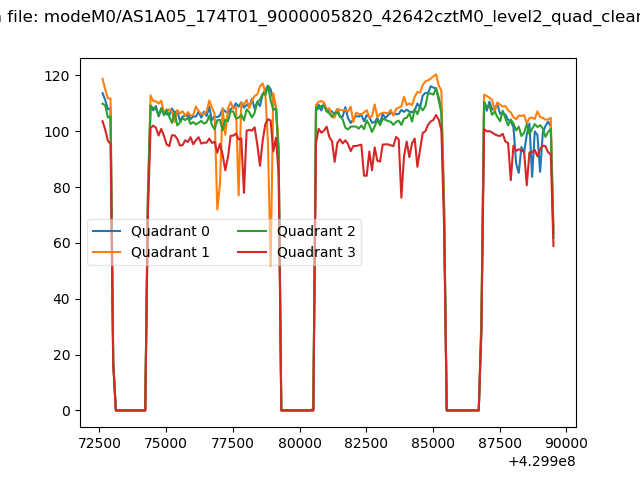 |
|
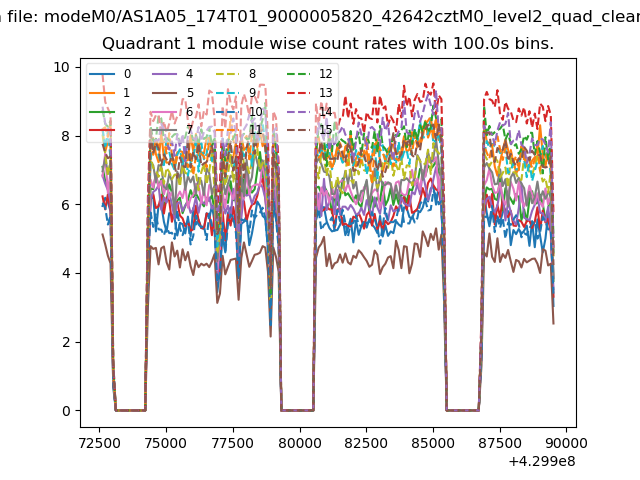
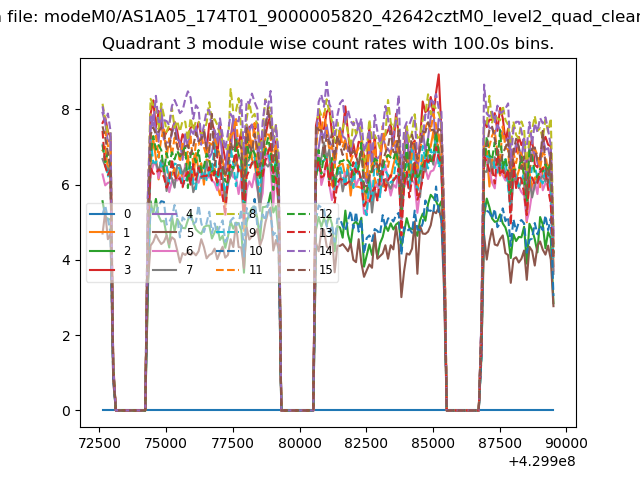
| Module-wise count rates for Quadrant A Data is divided into 100 sec bins |
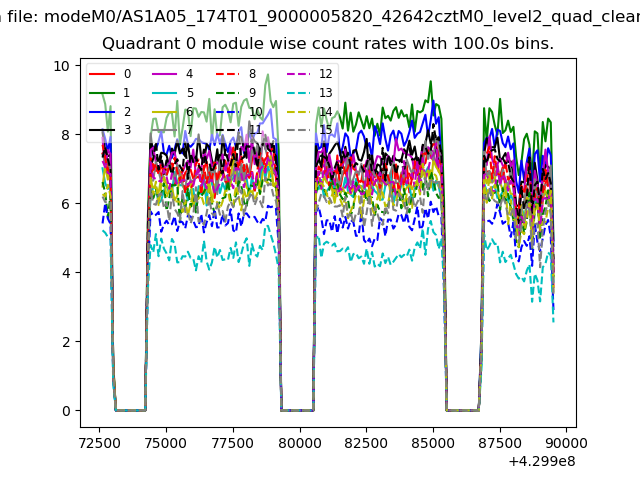 |
 |
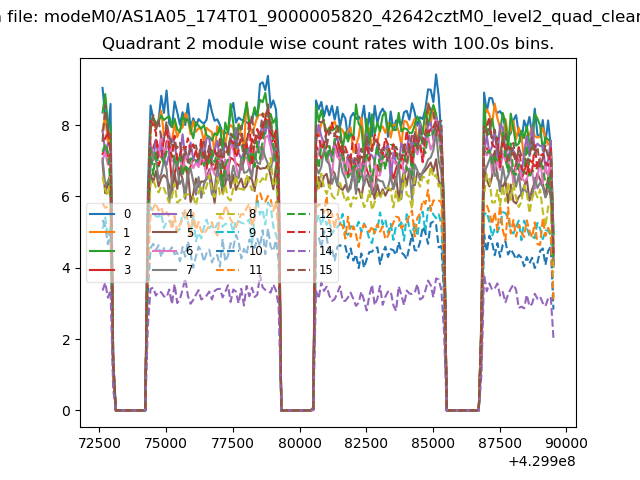
| Module-wise count rates for Quadrant B Data is divided into 100 sec bins |
 |
 |
| Module-wise count rates for Quadrant C Data is divided into 100 sec bins |
 |
 |
| Module-wise count rates for Quadrant D Data is divided into 100 sec bins |
 |
 |
| Parameter | Plot |
|---|---|
| CZT HV Monitor | 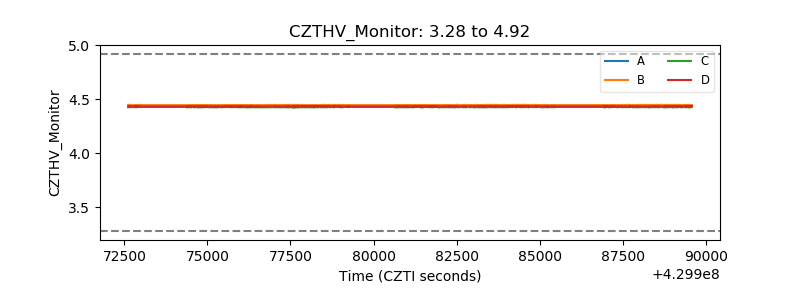 |
| D_VDD | 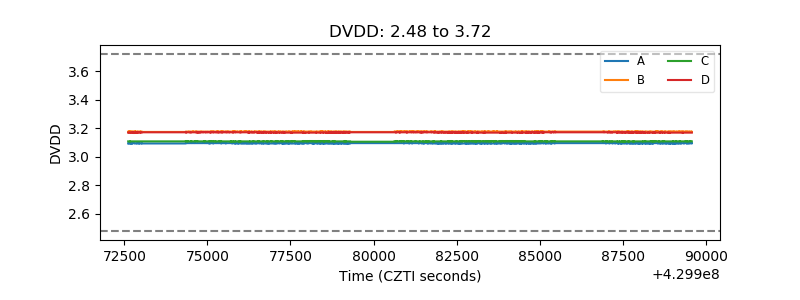 |
| Temperature 1 | 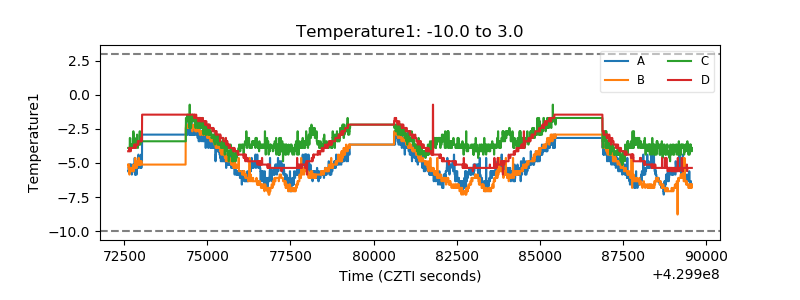 |
| Veto HV Monitor | 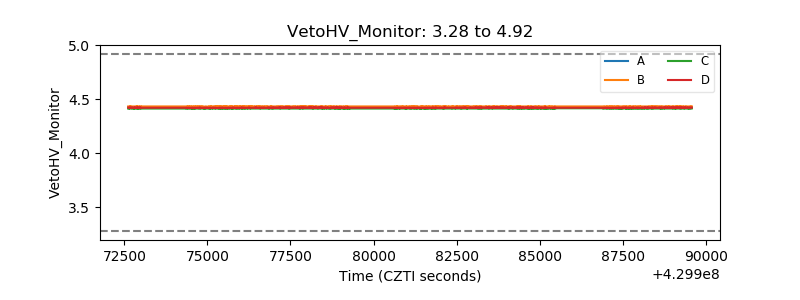 |
| Veto LLD | 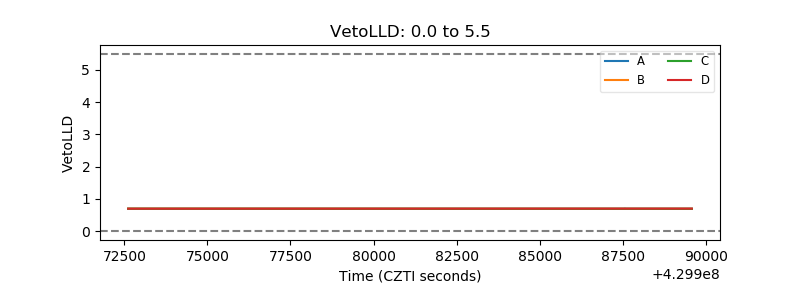 |
| Alpha Counter | 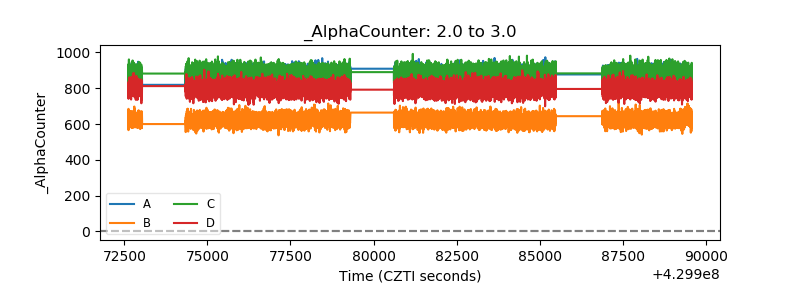 |
| _CPM_Rate | 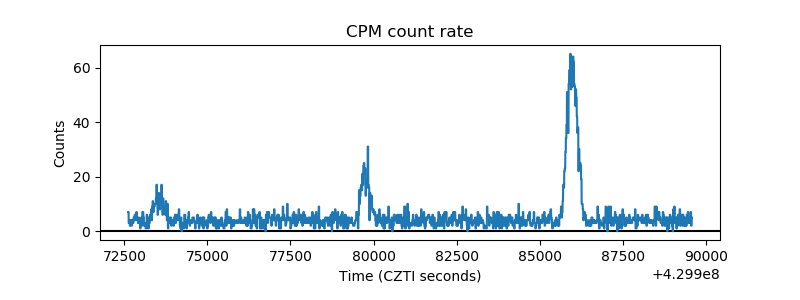 |
| CZT Counter | 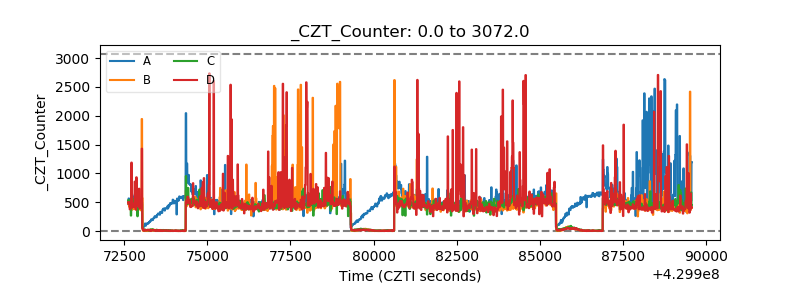 |
| +2.5 Volts monitor | 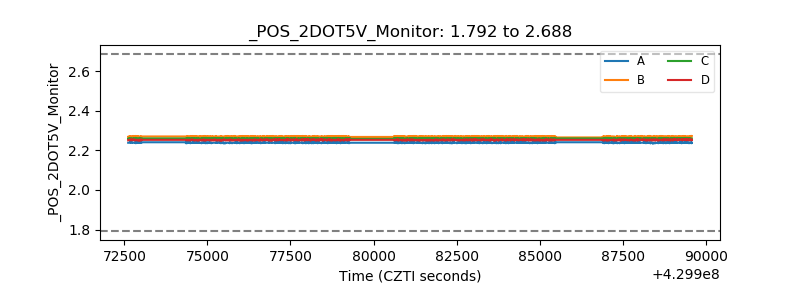 |
| +5 Volts monitor | 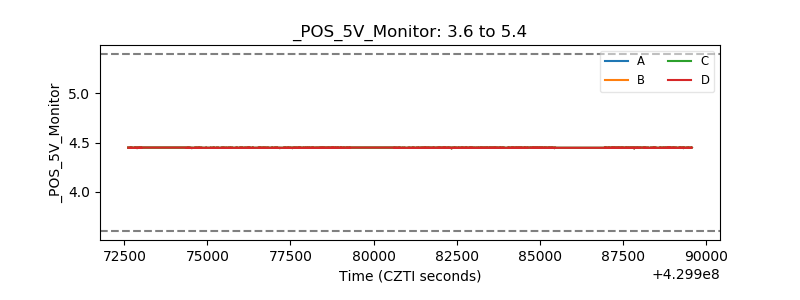 |
| _ROLL_ROT | 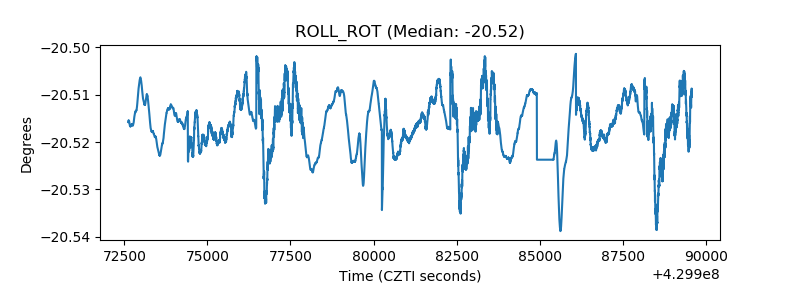 |
| _Roll_DEC | 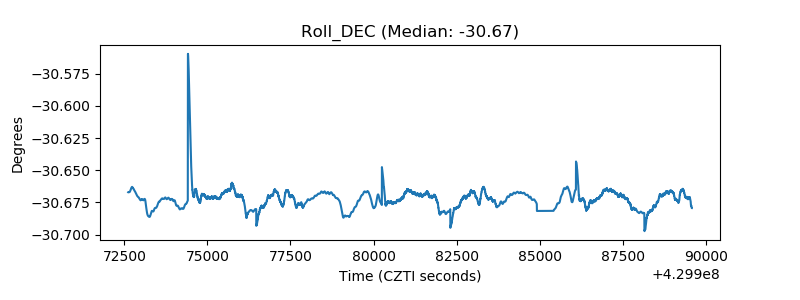 |
| _Roll_RA | 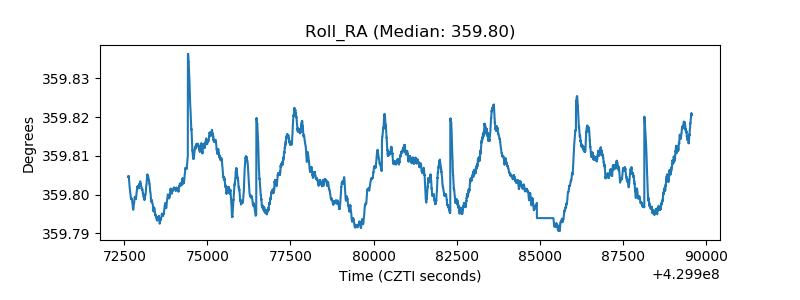 |
| Veto Counter |  |