| Param | Original file | Final file |
|---|---|---|
| Filename | modeM0/AS1A05_174T01_9000005820_42643cztM0_level2.fits | modeM0/AS1A05_174T01_9000005820_42643cztM0_level2_quad_clean.evt |
| Size (bytes) | 627,684,480 | 137,738,880 |
| Size | 598.6 MB | 131.4 MB |
| Events in quadrant A | 8,248,442 | 852,497 |
| Events in quadrant B | 4,087,180 | 965,115 |
| Events in quadrant C | 4,278,610 | 919,607 |
| Events in quadrant D | 5,947,981 | 830,738 |
| Mode M9 | |||
|---|---|---|---|
| Quadrant | BADHDUFLAG | Total packets | Discarded packets |
| A | 0 | 31 | 0 |
| B | 0 | 31 | 0 |
| C | 0 | 31 | 0 |
| D | 0 | 31 | 0 |
| Mode SS | |||
|---|---|---|---|
| Quadrant | BADHDUFLAG | Total packets | Discarded packets |
| A | 0 | 178 | 0 |
| B | 0 | 178 | 0 |
| C | 0 | 178 | 0 |
| D | 0 | 178 | 0 |
| Mode M0 | |||
|---|---|---|---|
| Quadrant | BADHDUFLAG | Total packets | Discarded packets |
| A | 0 | 30448 | 2 |
| B | 0 | 18181 | 2 |
| C | 0 | 18111 | 2 |
| D | 0 | 23857 | 2 |
| Quadrant | Total seconds | Saturated seconds | Saturation percentage |
|---|---|---|---|
| A | 8674 | 985 | 11.355776% |
| B | 8675 | 21 | 0.242075% |
| C | 8675 | 21 | 0.242075% |
| D | 8675 | 304 | 3.504323% |
Noise dominated data is calculated using 1-second bins in cleaned event files. If a bin has >2000 counts, and if more than 50% of those come from <1% of pixels, then it is considered to be noise-dominated and hence unusable.
| Quadrant | # 1 sec bins | Bins with >0 counts | Bins with >2000 counts | High rate bins dominated by noise | Noise dominated (total time) | Noise dominated (detector-on time) | Marked lightcurve |
|---|---|---|---|---|---|---|---|
| A | 11780 | 8676 | 800 | 800 | 6.79% | 9.22% | 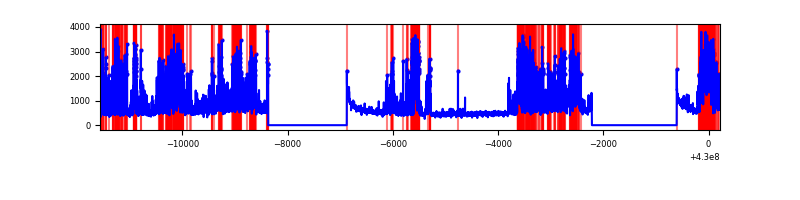 |
| B | 11781 | 8677 | 9 | 9 | 0.08% | 0.10% | 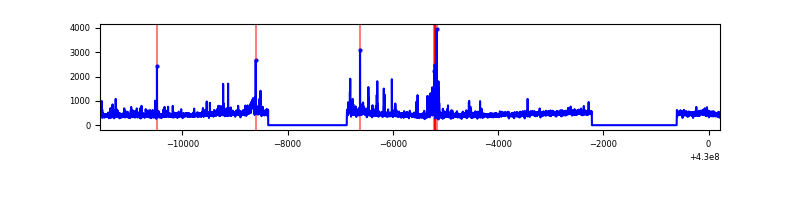 |
| C | 11781 | 8677 | 10 | 10 | 0.08% | 0.12% | 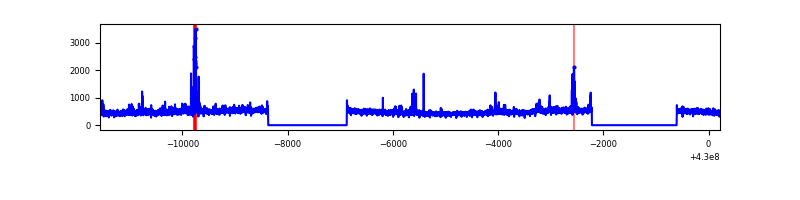 |
| D | 11781 | 8677 | 300 | 300 | 2.55% | 3.46% | 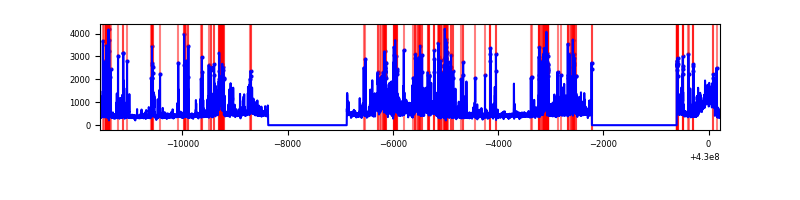 |
Top three noisy pixels from each quadrant. If the there are fewer than three noisy pixels in the level2.evt file, extra rows are filled as -1
| Pixel properties | Quadrant properties | ||||||
|---|---|---|---|---|---|---|---|
| Quadrant | DetID | PixID | Counts | Sigma | Mean | Median | Sigma |
| A | 13 | 248 | 3911284 | 20661.04 | 917 | 900 | 189.3 |
| A | 10 | 83 | 737761 | 3893.3 | 917 | 900 | 189.3 |
| A | 2 | 79 | 31268 | 160.45 | 917 | 900 | 189.3 |
| B | 0 | 245 | 187292 | 1006.57 | 942 | 913 | 185.2 |
| B | 3 | 112 | 124818 | 669.17 | 942 | 913 | 185.2 |
| B | 0 | 168 | 48142 | 255.07 | 942 | 913 | 185.2 |
| C | 15 | 214 | 351631 | 1616.31 | 934 | 939 | 217.0 |
| C | 3 | 233 | 146793 | 672.23 | 934 | 939 | 217.0 |
| C | 14 | 254 | 109281 | 499.34 | 934 | 939 | 217.0 |
| D | 2 | 249 | 879560 | 3875.28 | 919 | 893 | 226.7 |
| D | 13 | 249 | 845592 | 3725.47 | 919 | 893 | 226.7 |
| D | 12 | 6 | 324216 | 1425.99 | 919 | 893 | 226.7 |
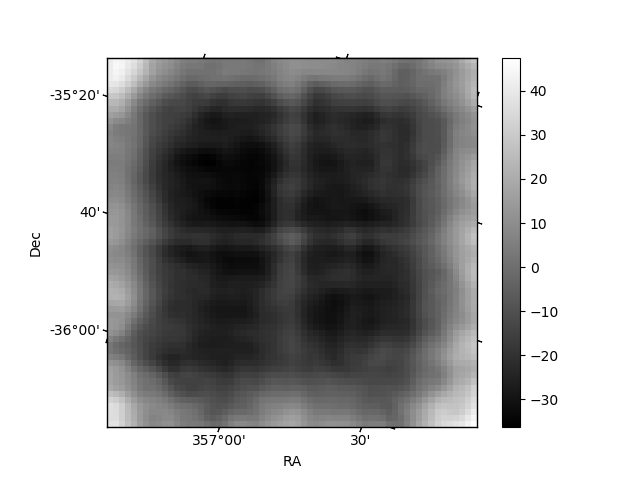
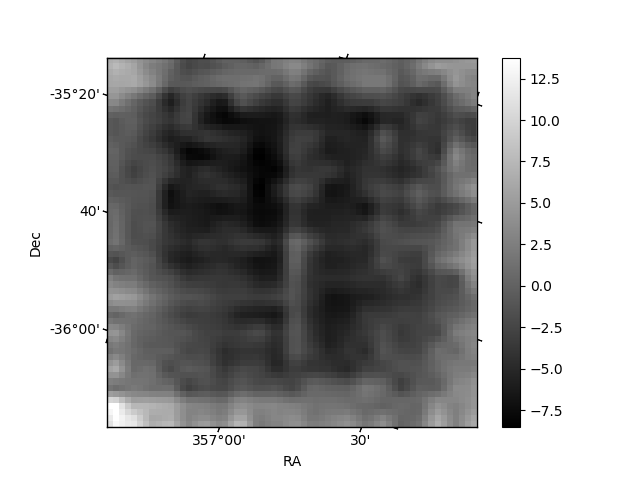
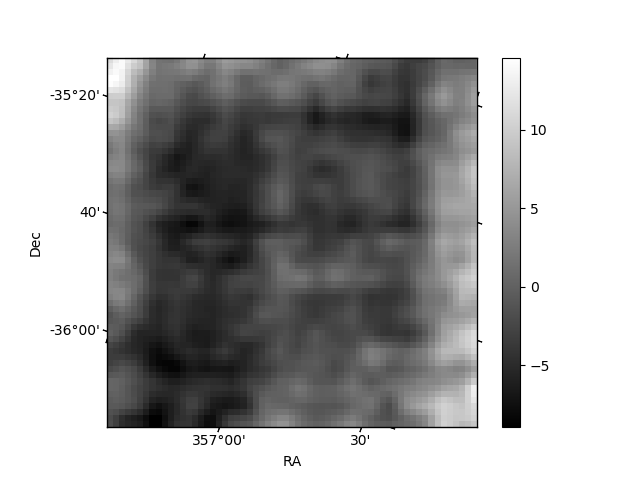
Histogram calculated using DETX and DETY for each event in the final _common_clean file
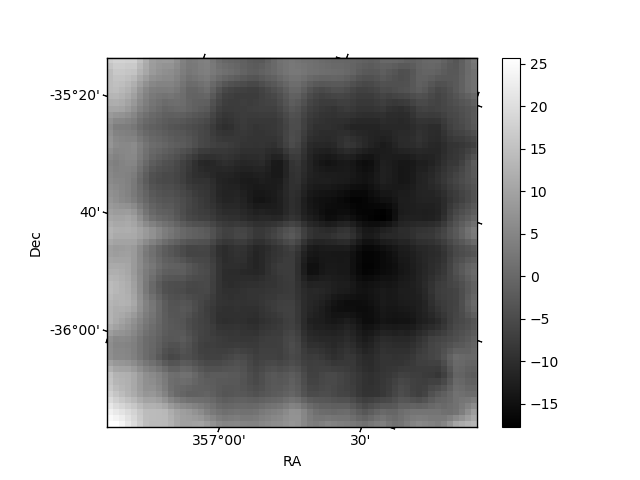
| Quadrant A | 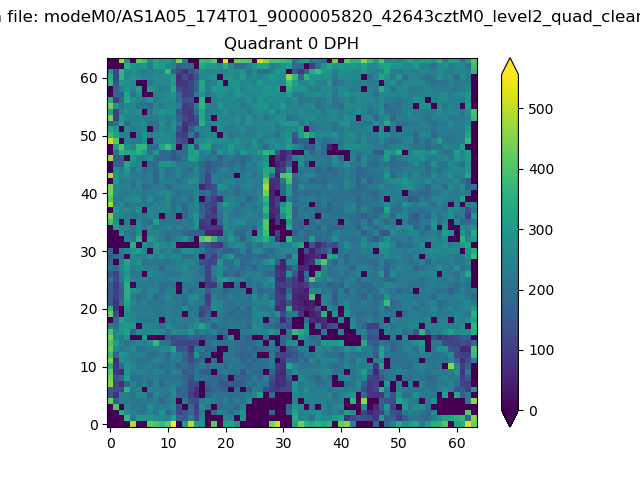 |
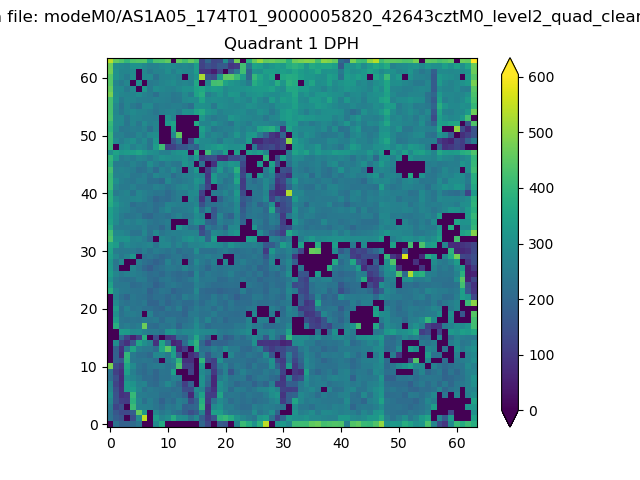 |
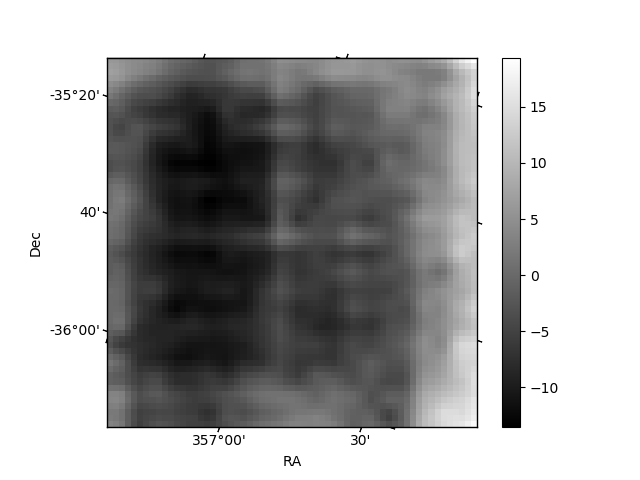
Quadrant B |
|---|---|---|---|
| Quadrant D | 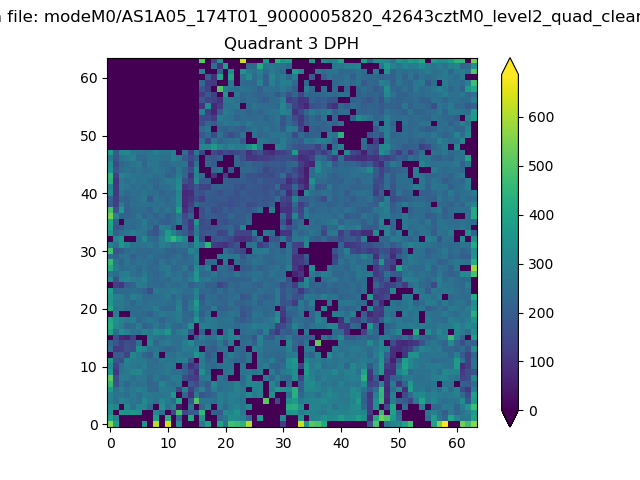 |
 |
Quadrant C |
| Plot type | Count rate plots | Images |
|---|---|---|
| Comparison with Poisson distribution Blue bars denote a histogram of data divided into 1 sec bins. Red curve is a Poisson curve with rate = median count rate of data. |
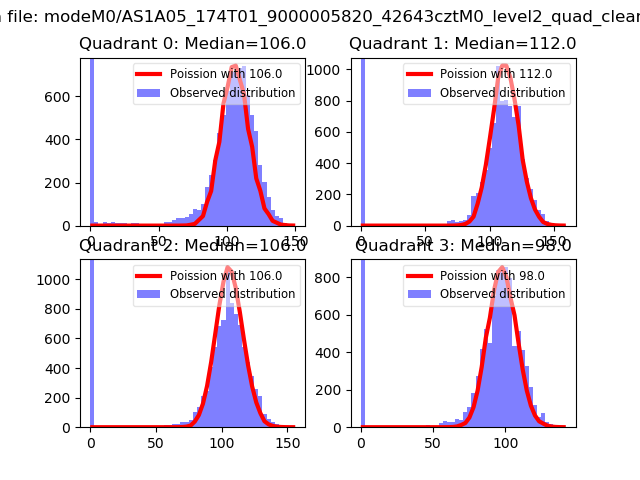 |
 |
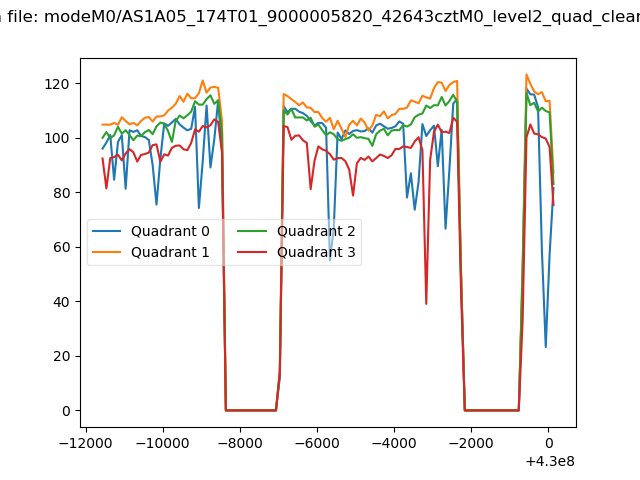
| Quadrant-wise count rates Data is divided into 100 sec bins |
 |
|
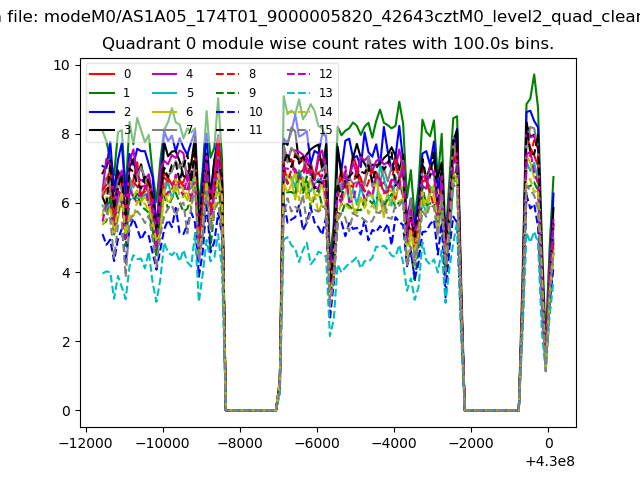
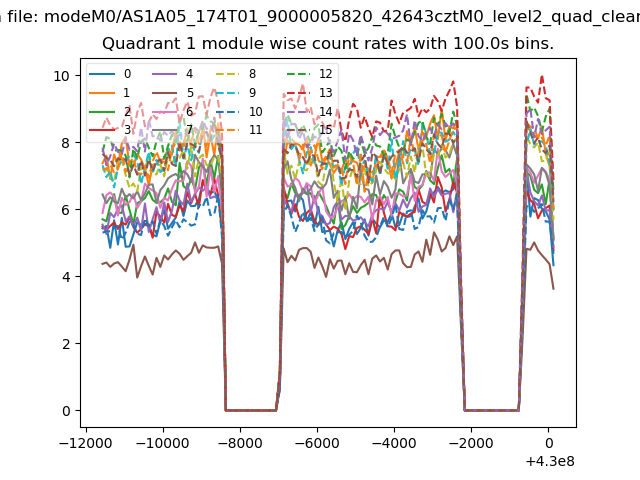
| Module-wise count rates for Quadrant A Data is divided into 100 sec bins |
 |
 |
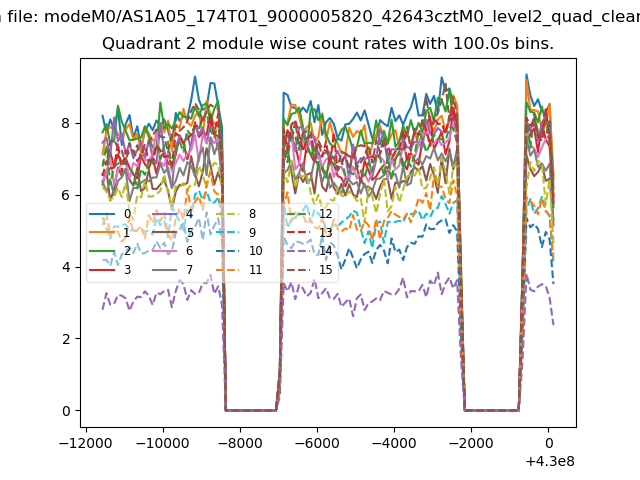
| Module-wise count rates for Quadrant B Data is divided into 100 sec bins |
 |
 |
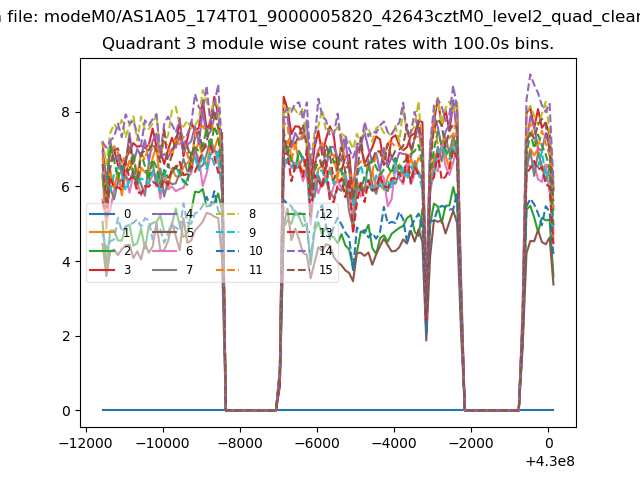
| Module-wise count rates for Quadrant C Data is divided into 100 sec bins |
 |
 |
| Module-wise count rates for Quadrant D Data is divided into 100 sec bins |
 |
 |
| Parameter | Plot |
|---|---|
| CZT HV Monitor |  |
| D_VDD | 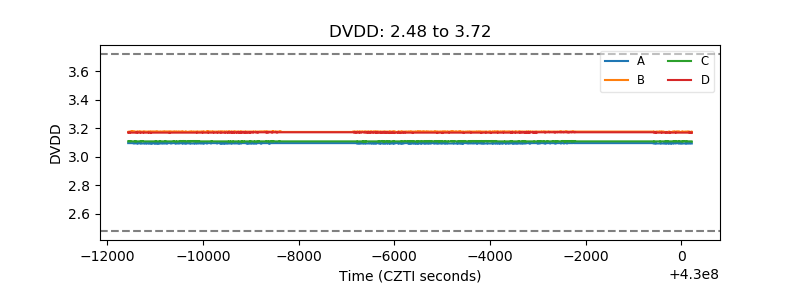 |
| Temperature 1 | 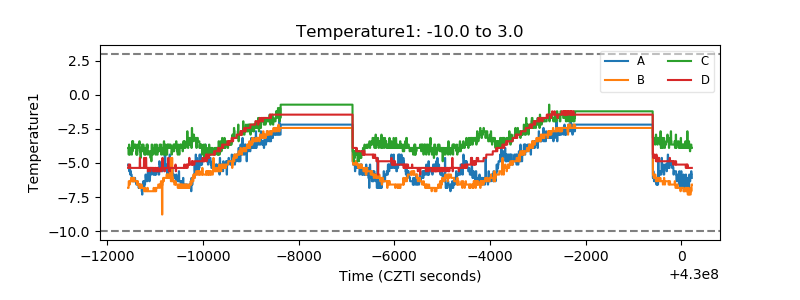 |
| Veto HV Monitor | 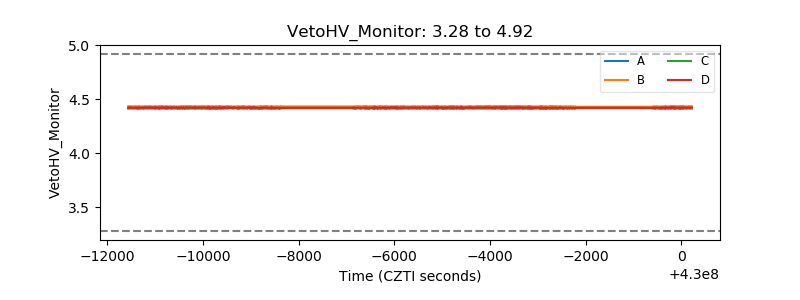 |
| Veto LLD | 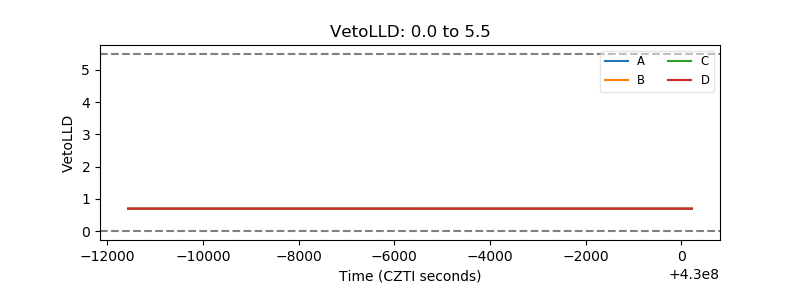 |
| Alpha Counter | 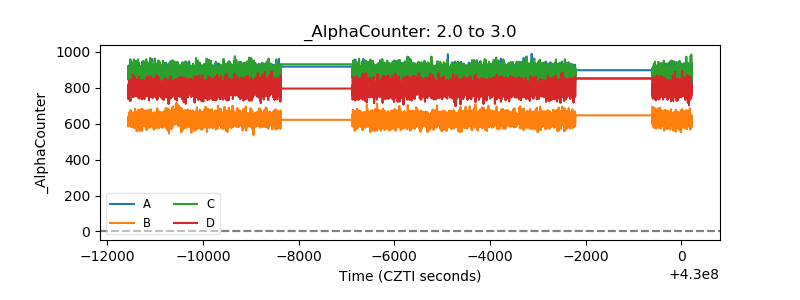 |
| _CPM_Rate | 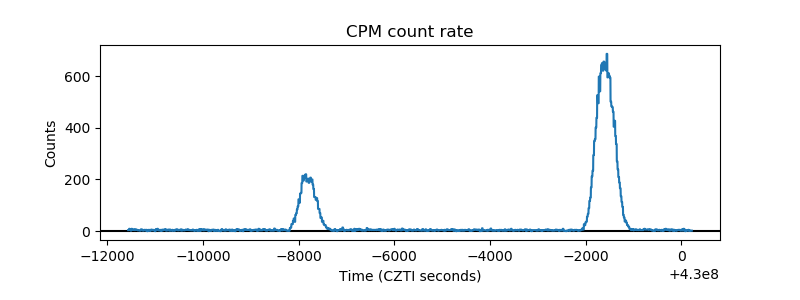 |
| CZT Counter | 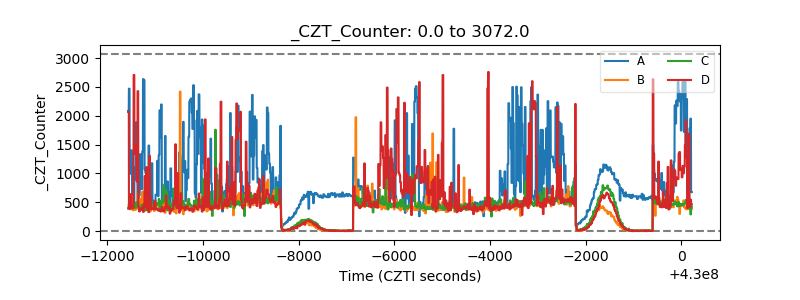 |
| +2.5 Volts monitor |  |
| +5 Volts monitor | 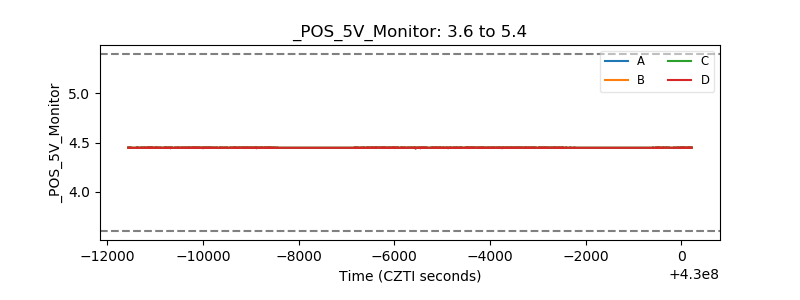 |
| _ROLL_ROT | 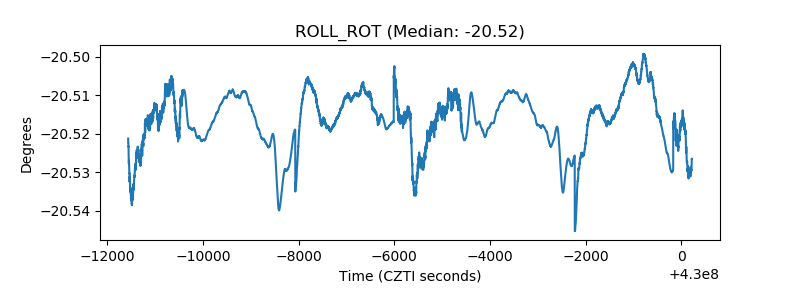 |
| _Roll_DEC |  |
| _Roll_RA |  |
| Veto Counter | 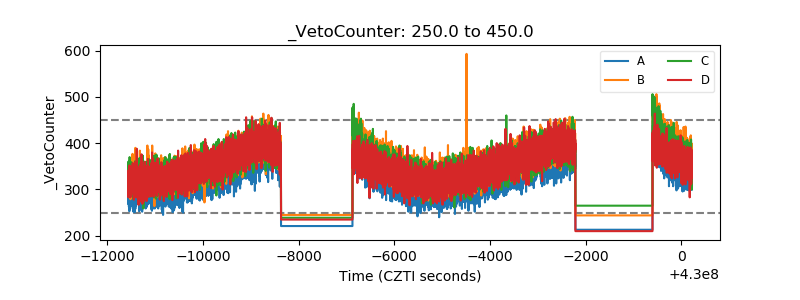 |