| Param | Original file | Final file |
|---|---|---|
| Filename | modeM0/AS1A05_174T01_9000005820_42645cztM0_level2.fits | modeM0/AS1A05_174T01_9000005820_42645cztM0_level2_quad_clean.evt |
| Size (bytes) | 412,398,720 | 96,914,880 |
| Size | 393.3 MB | 92.4 MB |
| Events in quadrant A | 4,842,420 | 627,939 |
| Events in quadrant B | 2,711,337 | 676,773 |
| Events in quadrant C | 3,135,218 | 640,139 |
| Events in quadrant D | 4,119,352 | 578,294 |
| Mode M9 | |||
|---|---|---|---|
| Quadrant | BADHDUFLAG | Total packets | Discarded packets |
| A | 0 | 34 | 0 |
| B | 0 | 34 | 0 |
| C | 0 | 34 | 0 |
| D | 0 | 34 | 0 |
| Mode SS | |||
|---|---|---|---|
| Quadrant | BADHDUFLAG | Total packets | Discarded packets |
| A | 0 | 122 | 0 |
| B | 0 | 122 | 0 |
| C | 0 | 122 | 0 |
| D | 0 | 122 | 0 |
| Mode M0 | |||
|---|---|---|---|
| Quadrant | BADHDUFLAG | Total packets | Discarded packets |
| A | 0 | 18266 | 2 |
| B | 0 | 12118 | 2 |
| C | 0 | 12998 | 2 |
| D | 0 | 16434 | 2 |
| Quadrant | Total seconds | Saturated seconds | Saturation percentage |
|---|---|---|---|
| A | 5886 | 287 | 4.875977% |
| B | 5886 | 11 | 0.186884% |
| C | 5886 | 81 | 1.376147% |
| D | 5886 | 227 | 3.856609% |
Noise dominated data is calculated using 1-second bins in cleaned event files. If a bin has >2000 counts, and if more than 50% of those come from <1% of pixels, then it is considered to be noise-dominated and hence unusable.
| Quadrant | # 1 sec bins | Bins with >0 counts | Bins with >2000 counts | High rate bins dominated by noise | Noise dominated (total time) | Noise dominated (detector-on time) | Marked lightcurve |
|---|---|---|---|---|---|---|---|
| A | 9260 | 5888 | 264 | 264 | 2.85% | 4.48% | 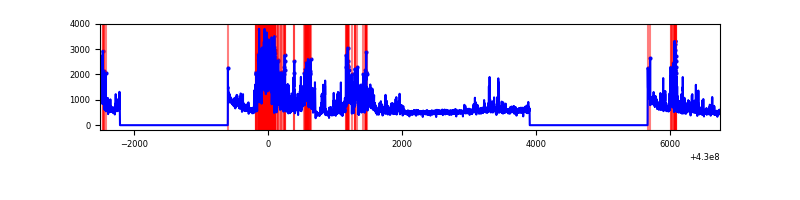 |
| B | 9260 | 5888 | 2 | 2 | 0.02% | 0.03% | 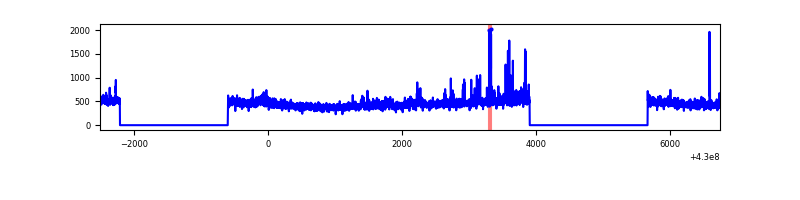 |
| C | 9260 | 5888 | 62 | 62 | 0.67% | 1.05% | 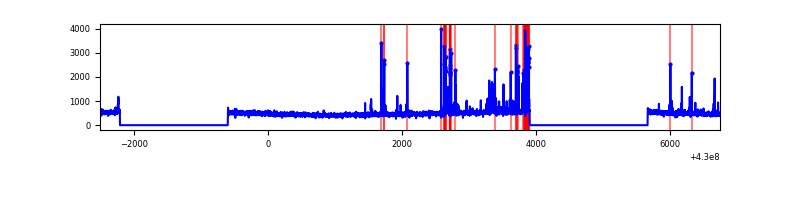 |
| D | 9260 | 5888 | 204 | 204 | 2.20% | 3.46% | 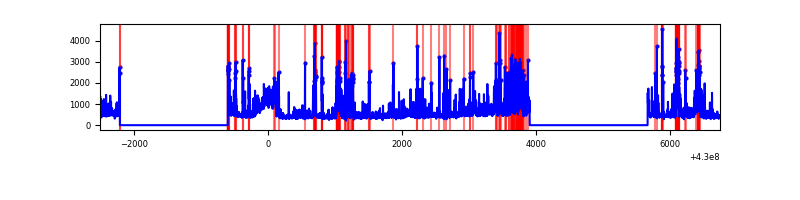 |
Top three noisy pixels from each quadrant. If the there are fewer than three noisy pixels in the level2.evt file, extra rows are filled as -1
| Pixel properties | Quadrant properties | ||||||
|---|---|---|---|---|---|---|---|
| Quadrant | DetID | PixID | Counts | Sigma | Mean | Median | Sigma |
| A | 13 | 248 | 1720534 | 12973.11 | 640 | 626 | 132.6 |
| A | 10 | 83 | 583180 | 4394.15 | 640 | 626 | 132.6 |
| A | 2 | 79 | 56963 | 424.94 | 640 | 626 | 132.6 |
| B | 0 | 245 | 120644 | 946.39 | 650 | 633 | 126.8 |
| B | 0 | 229 | 19681 | 150.21 | 650 | 633 | 126.8 |
| B | 12 | 111 | 16107 | 122.03 | 650 | 633 | 126.8 |
| C | 14 | 254 | 338265 | 2262.12 | 641 | 648 | 149.2 |
| C | 15 | 214 | 241759 | 1615.5 | 641 | 648 | 149.2 |
| C | 3 | 233 | 42281 | 278.95 | 641 | 648 | 149.2 |
| D | 2 | 249 | 523198 | 3377.59 | 631 | 613 | 154.7 |
| D | 13 | 249 | 392385 | 2532.11 | 631 | 613 | 154.7 |
| D | 1 | 52 | 233672 | 1506.32 | 631 | 613 | 154.7 |
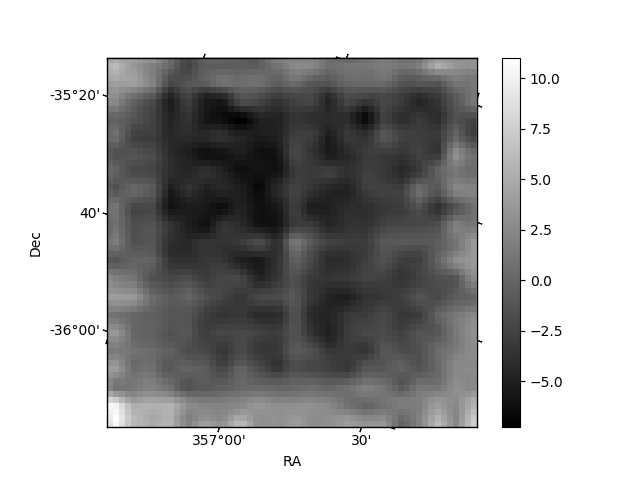
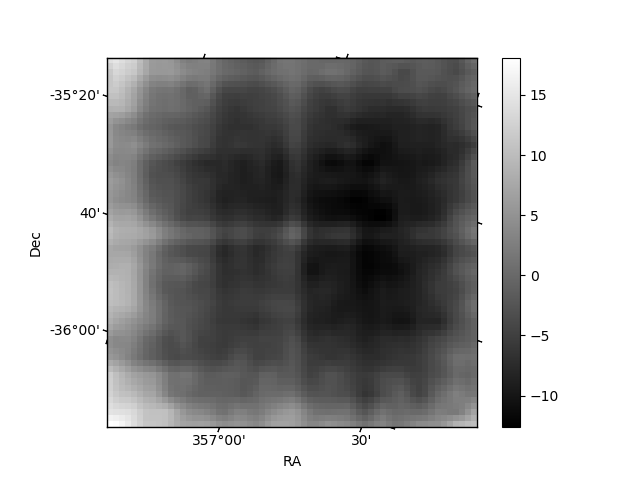
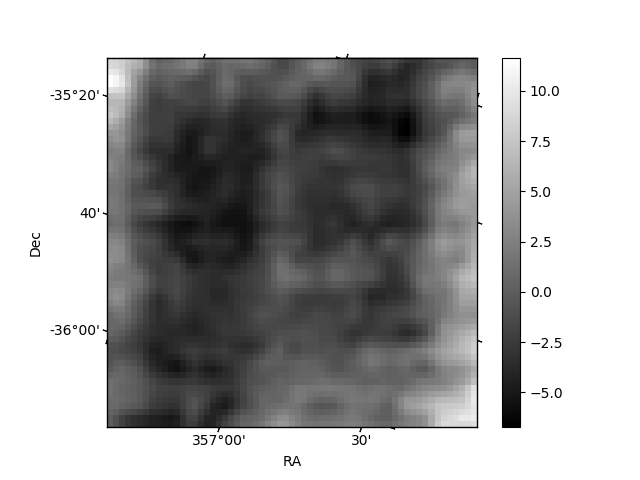
Histogram calculated using DETX and DETY for each event in the final _common_clean file
| Quadrant A | 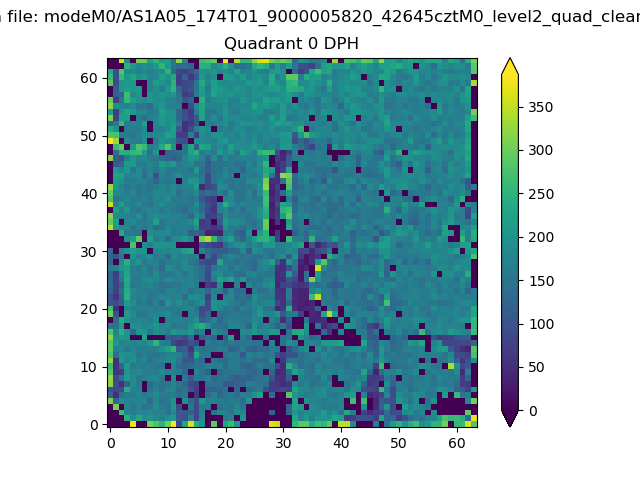 |
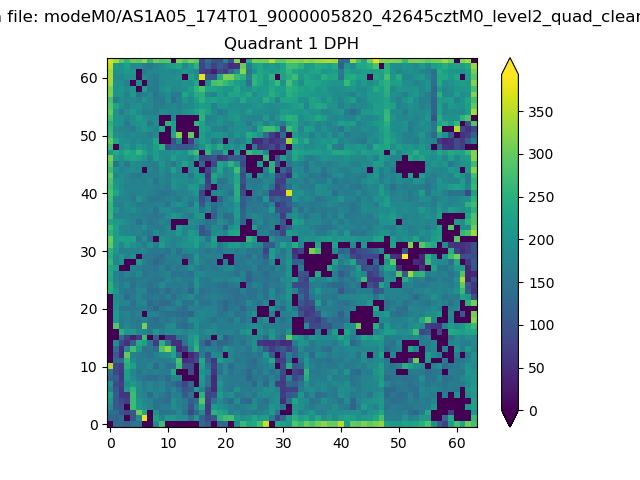 |
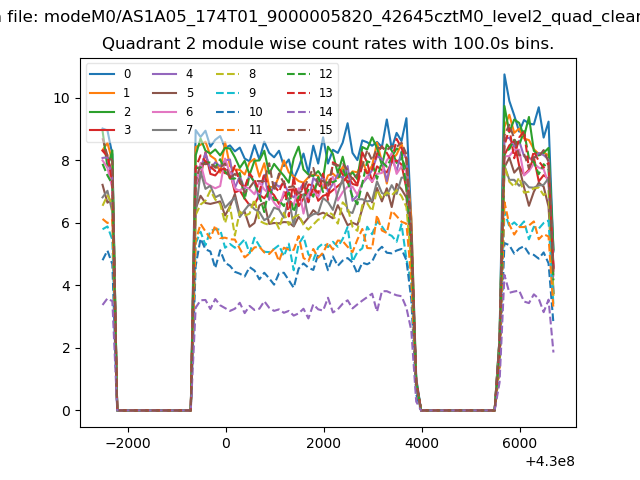
Quadrant B |
|---|---|---|---|
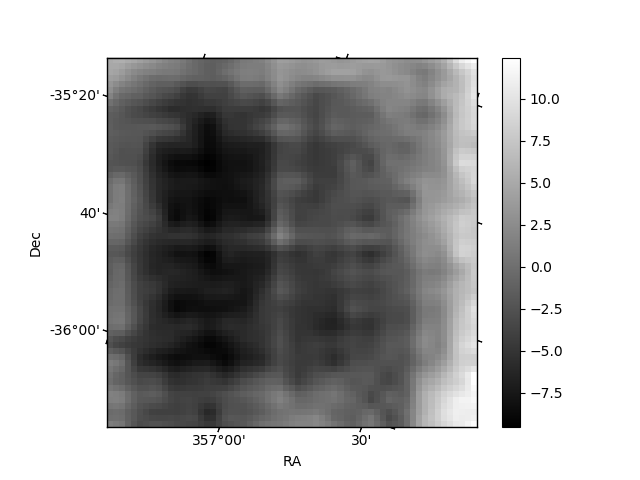
| Quadrant D | 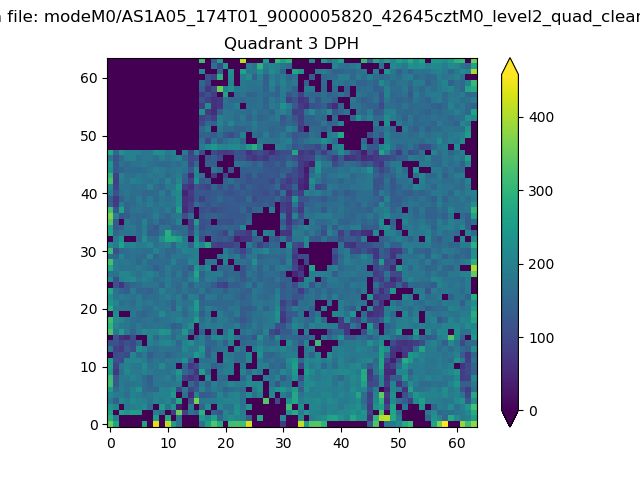 |
 |
Quadrant C |
| Plot type | Count rate plots | Images |
|---|---|---|
| Comparison with Poisson distribution Blue bars denote a histogram of data divided into 1 sec bins. Red curve is a Poisson curve with rate = median count rate of data. |
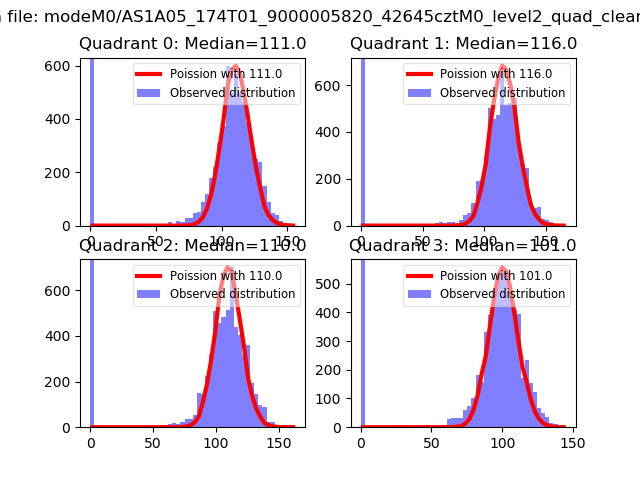 |
 |
| Quadrant-wise count rates Data is divided into 100 sec bins |
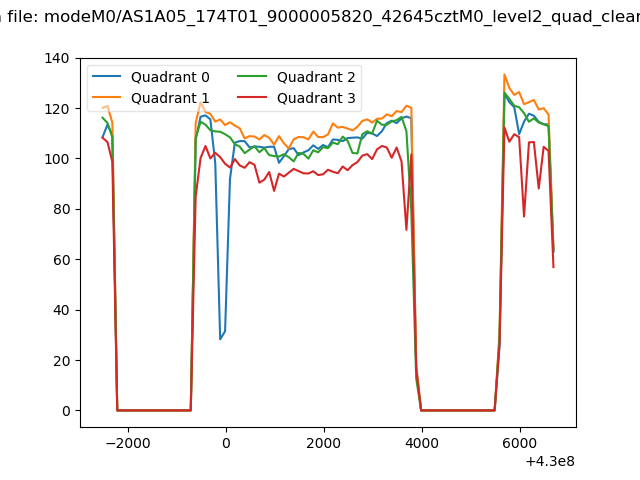 |
|
| Module-wise count rates for Quadrant A Data is divided into 100 sec bins |
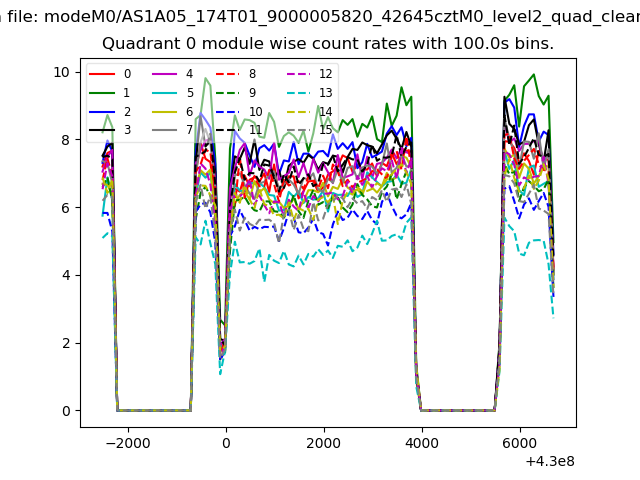 |
 |
| Module-wise count rates for Quadrant B Data is divided into 100 sec bins |
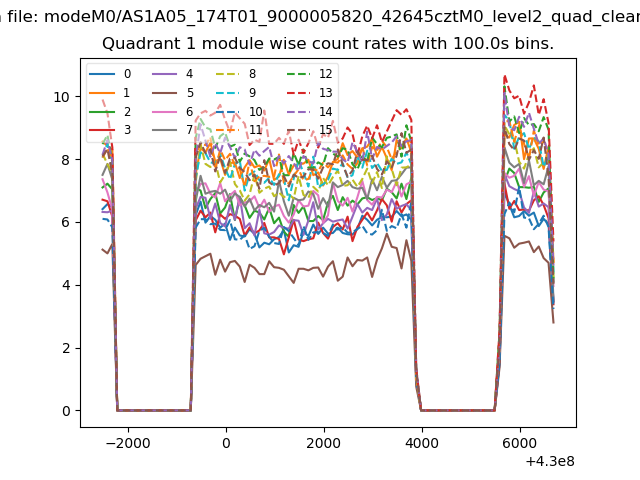 |
 |
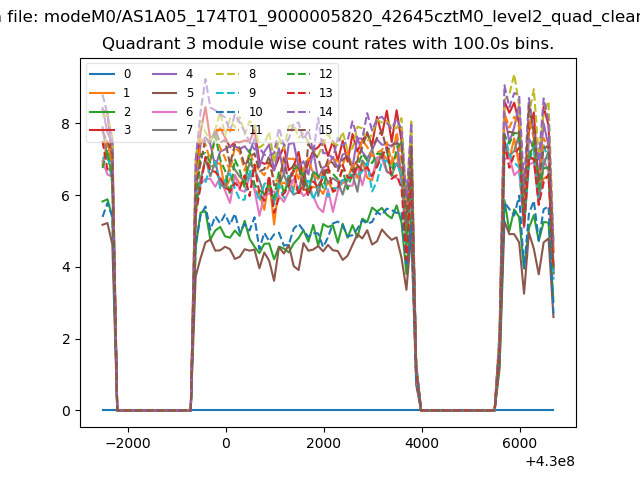
| Module-wise count rates for Quadrant C Data is divided into 100 sec bins |
 |
 |
| Module-wise count rates for Quadrant D Data is divided into 100 sec bins |
 |
 |
| Parameter | Plot |
|---|---|
| CZT HV Monitor | 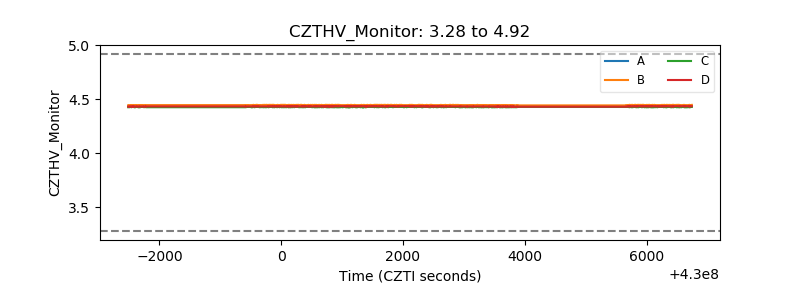 |
| D_VDD | 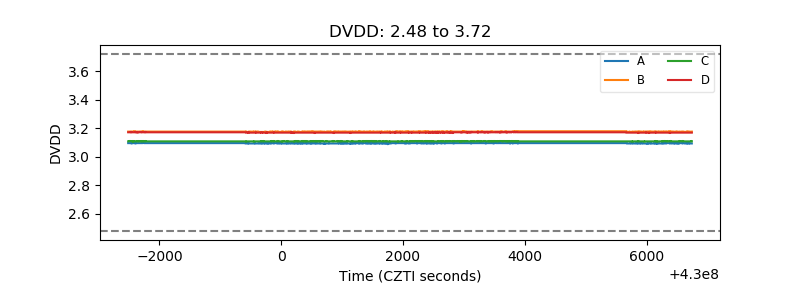 |
| Temperature 1 | 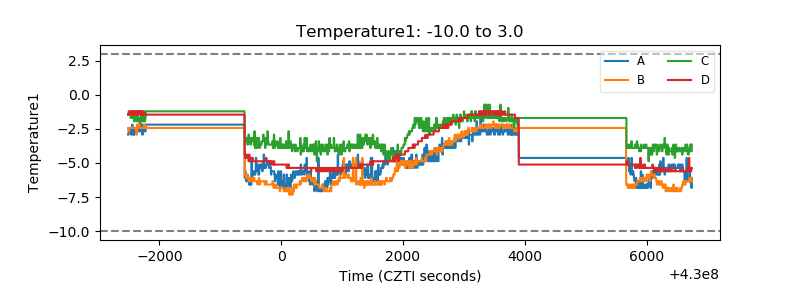 |
| Veto HV Monitor | 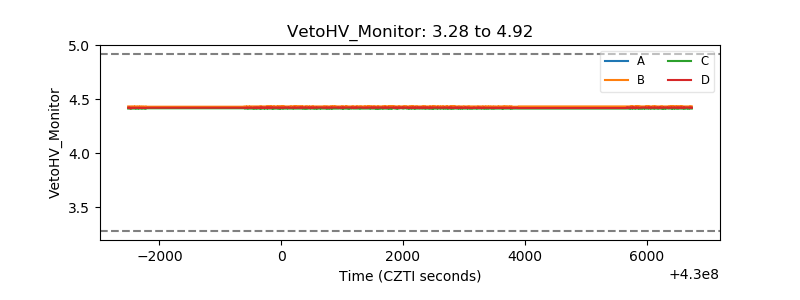 |
| Veto LLD | 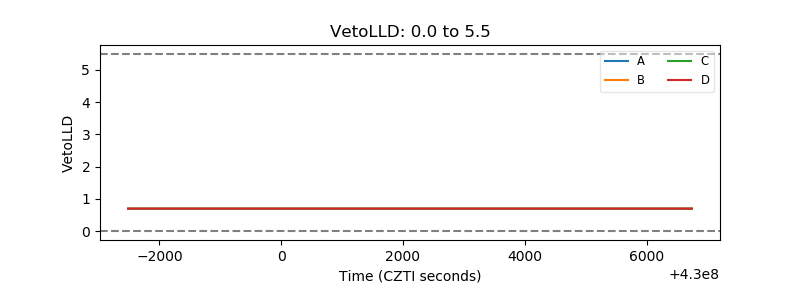 |
| Alpha Counter | 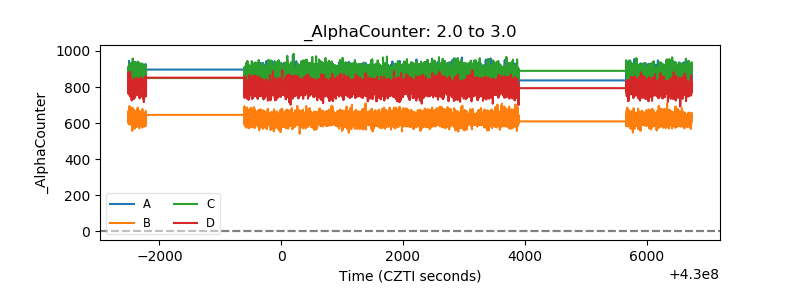 |
| _CPM_Rate | 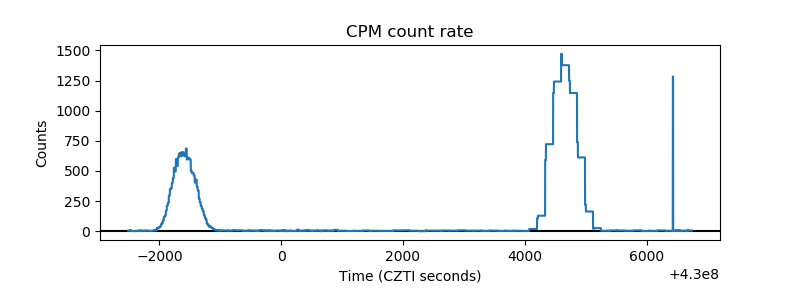 |
| CZT Counter | 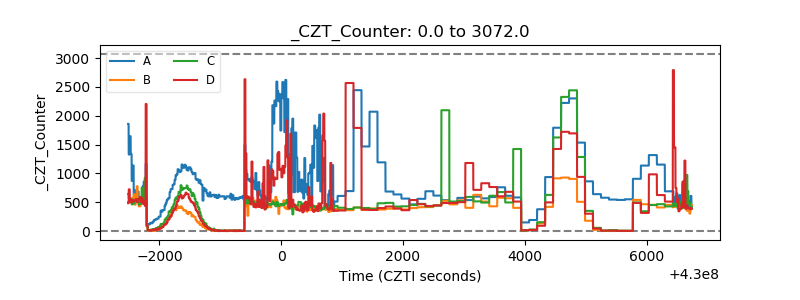 |
| +2.5 Volts monitor | 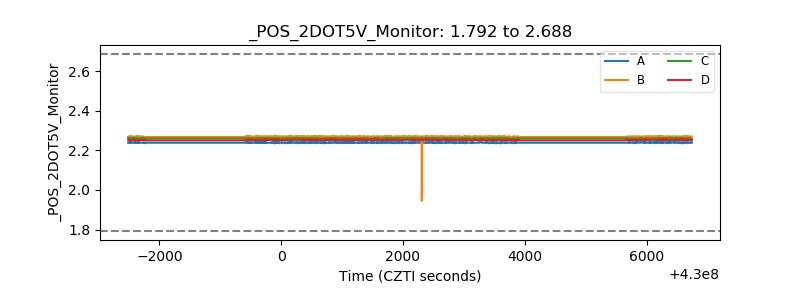 |
| +5 Volts monitor | 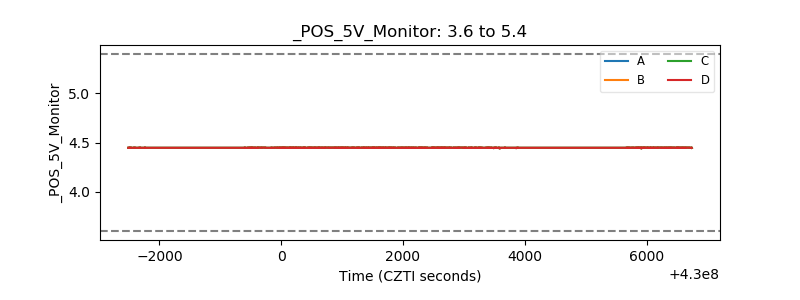 |
| _ROLL_ROT | 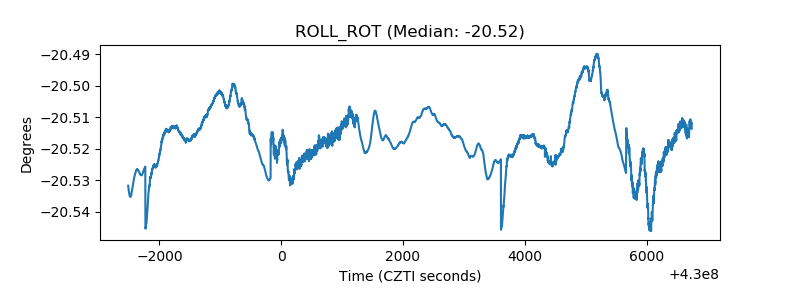 |
| _Roll_DEC | 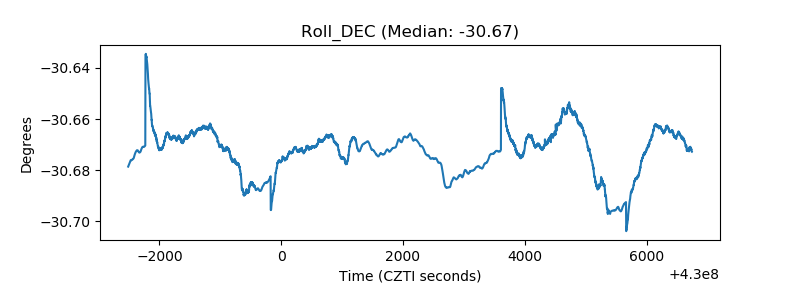 |
| _Roll_RA | 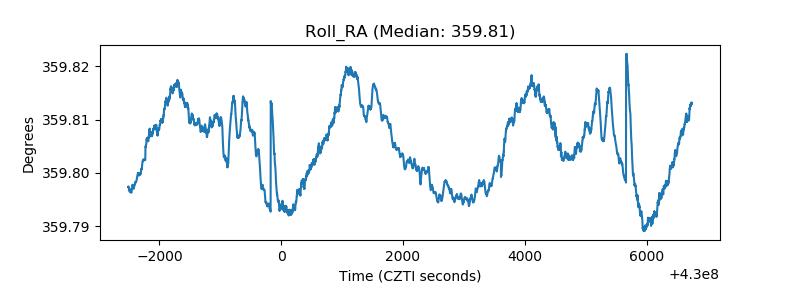 |
| Veto Counter | 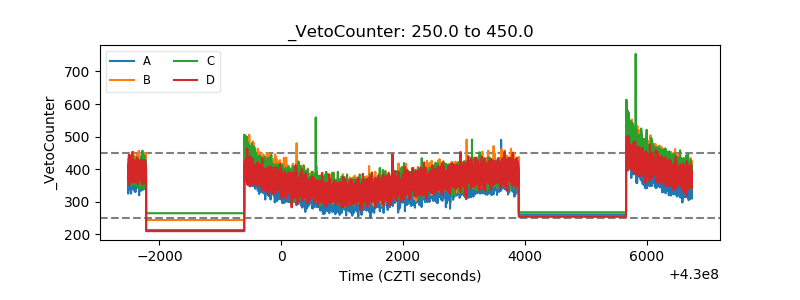 |