| Param | Original file | Final file |
|---|---|---|
| Filename | modeM0/AS1A05_174T01_9000005820_42647cztM0_level2.fits | modeM0/AS1A05_174T01_9000005820_42647cztM0_level2_quad_clean.evt |
| Size (bytes) | 579,816,000 | 169,424,640 |
| Size | 553.0 MB | 161.6 MB |
| Events in quadrant A | 5,648,154 | 1,129,264 |
| Events in quadrant B | 4,433,786 | 1,179,235 |
| Events in quadrant C | 4,948,267 | 1,133,566 |
| Events in quadrant D | 5,679,674 | 1,015,783 |
| Mode M9 | |||
|---|---|---|---|
| Quadrant | BADHDUFLAG | Total packets | Discarded packets |
| A | 0 | 47 | 0 |
| B | 0 | 48 | 0 |
| C | 0 | 48 | 0 |
| D | 0 | 48 | 0 |
| Mode SS | |||
|---|---|---|---|
| Quadrant | BADHDUFLAG | Total packets | Discarded packets |
| A | 0 | 198 | 0 |
| B | 0 | 198 | 0 |
| C | 0 | 198 | 0 |
| D | 0 | 198 | 0 |
| Mode M0 | |||
|---|---|---|---|
| Quadrant | BADHDUFLAG | Total packets | Discarded packets |
| A | 0 | 22524 | 3 |
| B | 0 | 19619 | 3 |
| C | 0 | 20292 | 3 |
| D | 0 | 23626 | 3 |
| Quadrant | Total seconds | Saturated seconds | Saturation percentage |
|---|---|---|---|
| A | 9703 | 40 | 0.412244% |
| B | 9703 | 15 | 0.154591% |
| C | 9703 | 29 | 0.298877% |
| D | 9703 | 230 | 2.370401% |
Noise dominated data is calculated using 1-second bins in cleaned event files. If a bin has >2000 counts, and if more than 50% of those come from <1% of pixels, then it is considered to be noise-dominated and hence unusable.
| Quadrant | # 1 sec bins | Bins with >0 counts | Bins with >2000 counts | High rate bins dominated by noise | Noise dominated (total time) | Noise dominated (detector-on time) | Marked lightcurve |
|---|---|---|---|---|---|---|---|
| A | 13590 | 9705 | 25 | 25 | 0.18% | 0.26% | 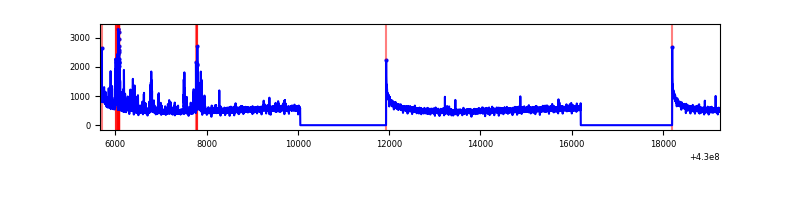 |
| B | 13590 | 9705 | 1 | 1 | 0.01% | 0.01% | 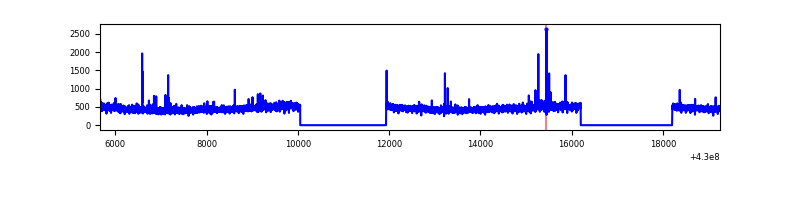 |
| C | 13590 | 9705 | 19 | 19 | 0.14% | 0.20% | 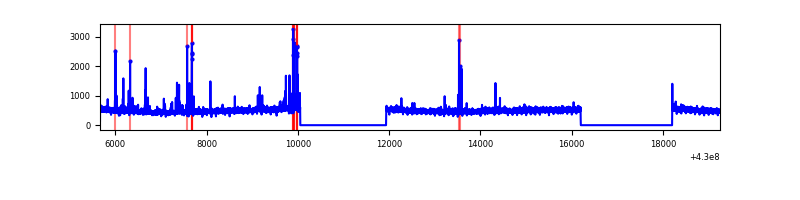 |
| D | 13590 | 9705 | 194 | 194 | 1.43% | 2.00% | 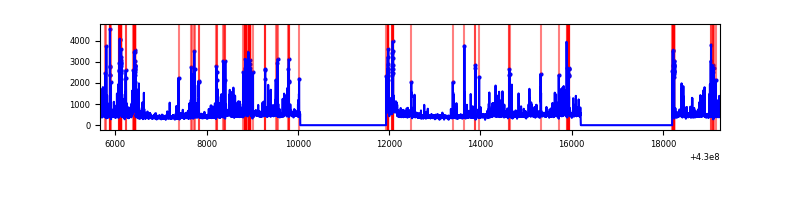 |
Top three noisy pixels from each quadrant. If the there are fewer than three noisy pixels in the level2.evt file, extra rows are filled as -1
| Pixel properties | Quadrant properties | ||||||
|---|---|---|---|---|---|---|---|
| Quadrant | DetID | PixID | Counts | Sigma | Mean | Median | Sigma |
| A | 10 | 83 | 937626 | 4120.93 | 1107 | 1084 | 227.3 |
| A | 13 | 248 | 424782 | 1864.34 | 1107 | 1084 | 227.3 |
| A | 3 | 137 | 11987 | 47.97 | 1107 | 1084 | 227.3 |
| B | 0 | 245 | 84155 | 395.67 | 1101 | 1071 | 210.0 |
| B | 12 | 111 | 26230 | 119.82 | 1101 | 1071 | 210.0 |
| B | 11 | 111 | 24714 | 112.6 | 1101 | 1071 | 210.0 |
| C | 15 | 214 | 402716 | 1578.55 | 1103 | 1115 | 254.4 |
| C | 14 | 254 | 190719 | 745.27 | 1103 | 1115 | 254.4 |
| C | 3 | 233 | 50331 | 193.45 | 1103 | 1115 | 254.4 |
| D | 2 | 249 | 402755 | 1538.08 | 1085 | 1057 | 261.2 |
| D | 12 | 6 | 277621 | 1058.95 | 1085 | 1057 | 261.2 |
| D | 1 | 52 | 254772 | 971.46 | 1085 | 1057 | 261.2 |
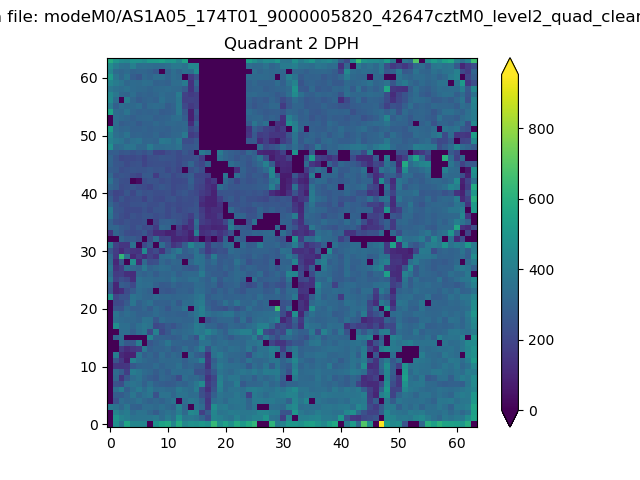
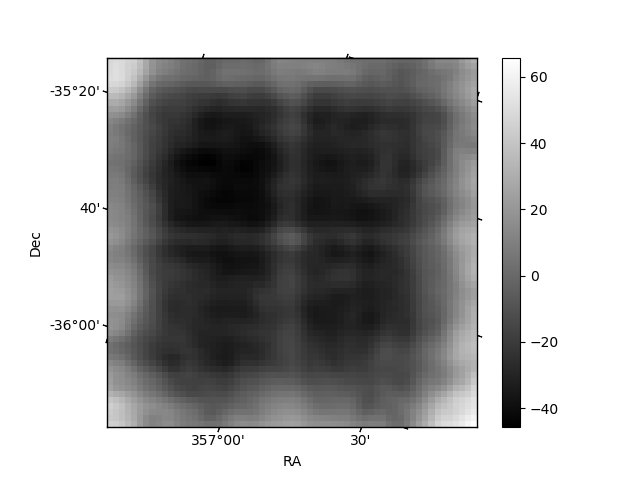
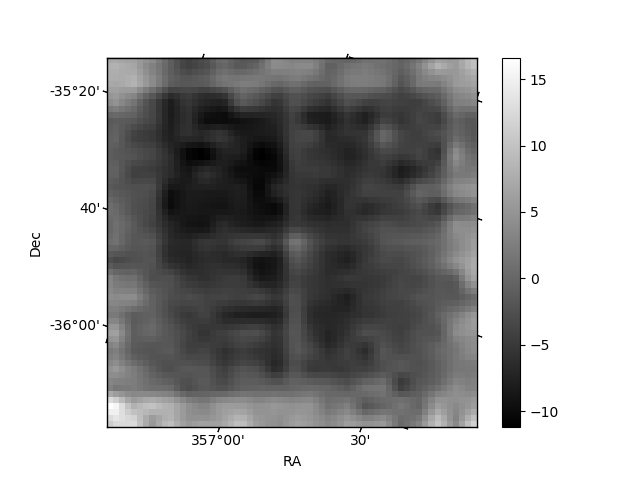
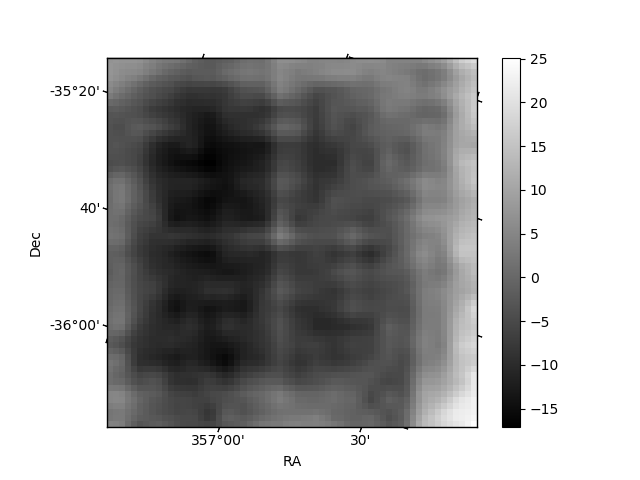
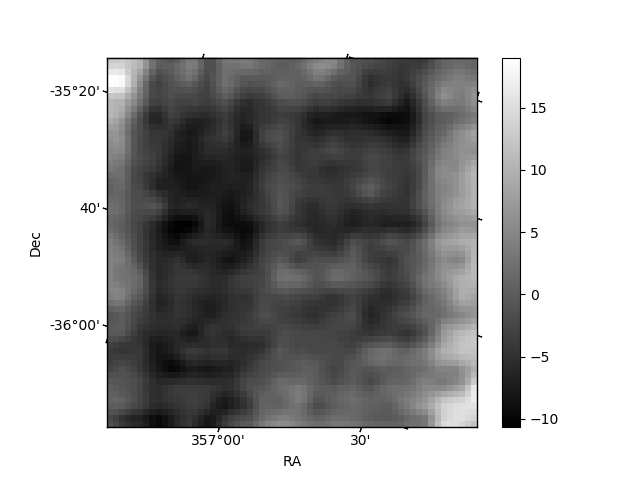
Histogram calculated using DETX and DETY for each event in the final _common_clean file
| Quadrant A | 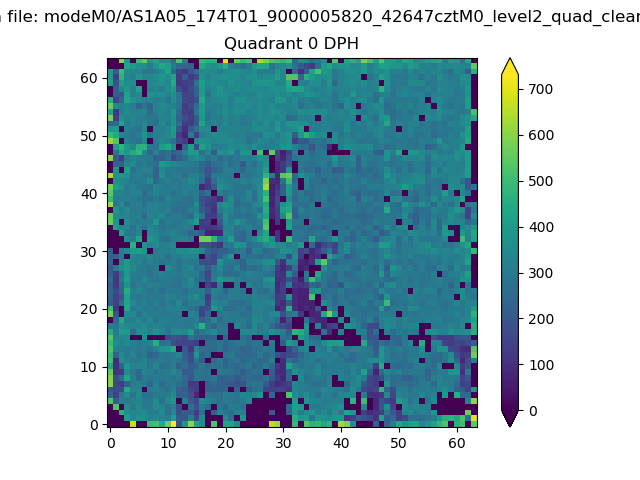 |
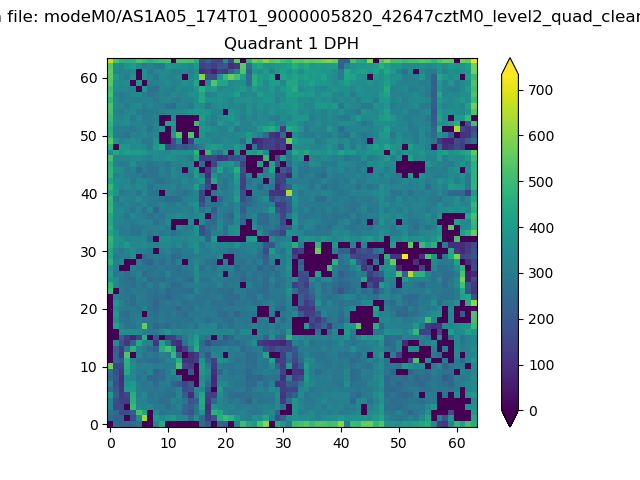 |
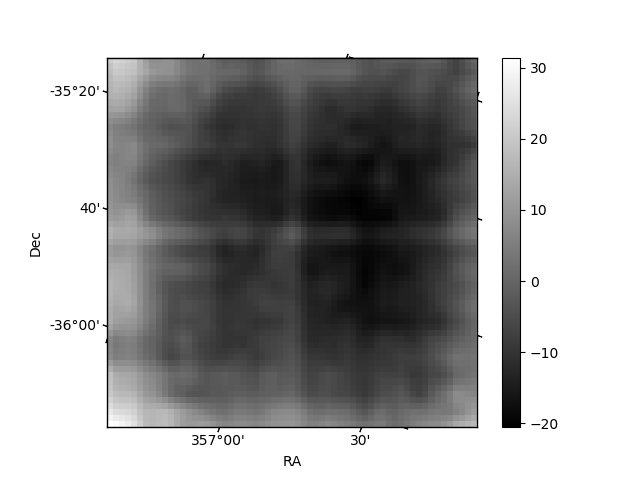
Quadrant B |
|---|---|---|---|
| Quadrant D | 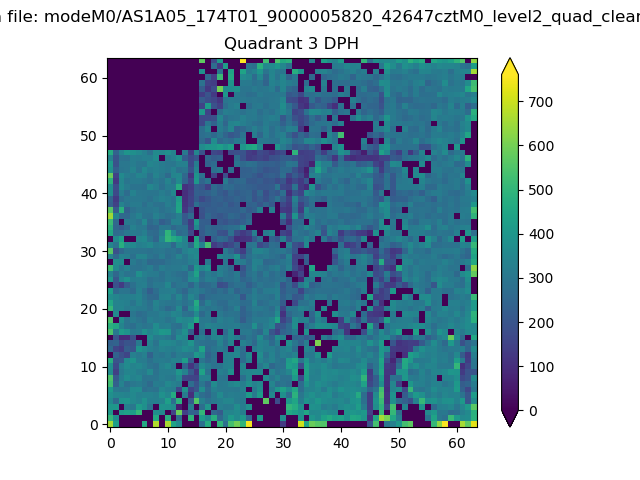 |
 |
Quadrant C |
| Plot type | Count rate plots | Images |
|---|---|---|
| Comparison with Poisson distribution Blue bars denote a histogram of data divided into 1 sec bins. Red curve is a Poisson curve with rate = median count rate of data. |
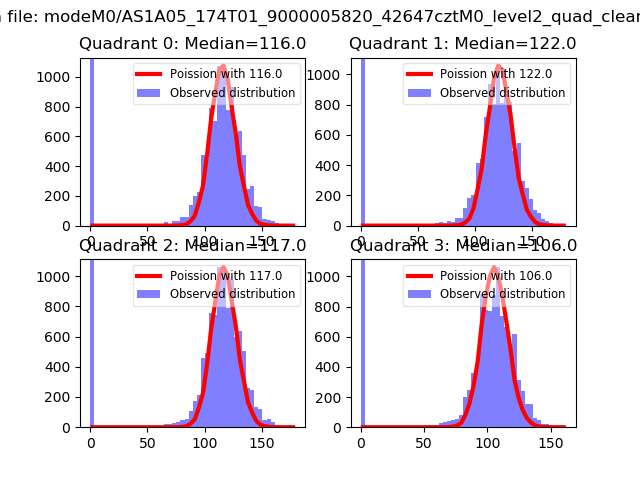 |
 |
| Quadrant-wise count rates Data is divided into 100 sec bins |
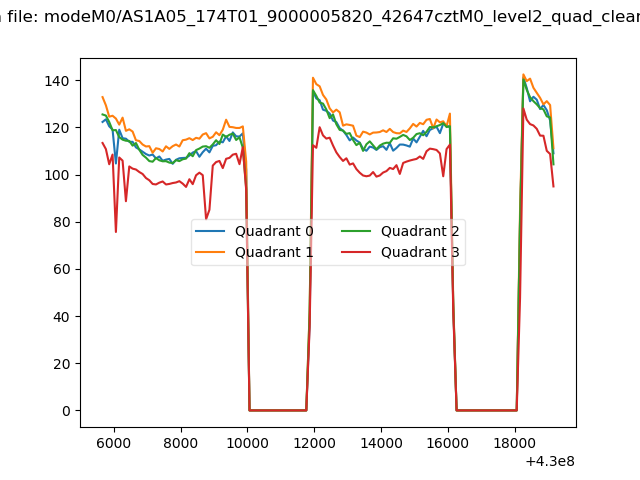 |
|
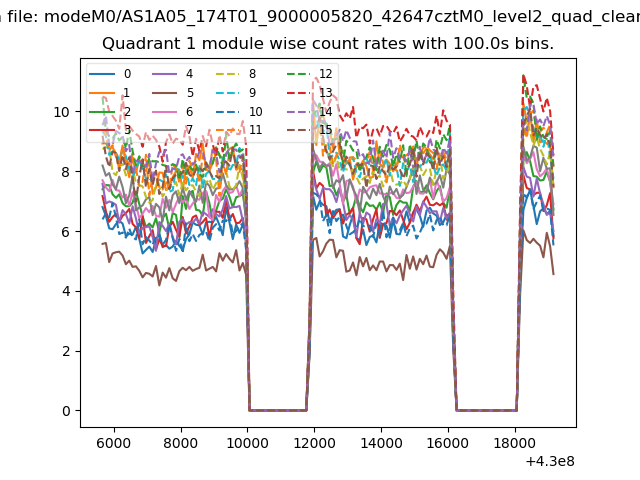
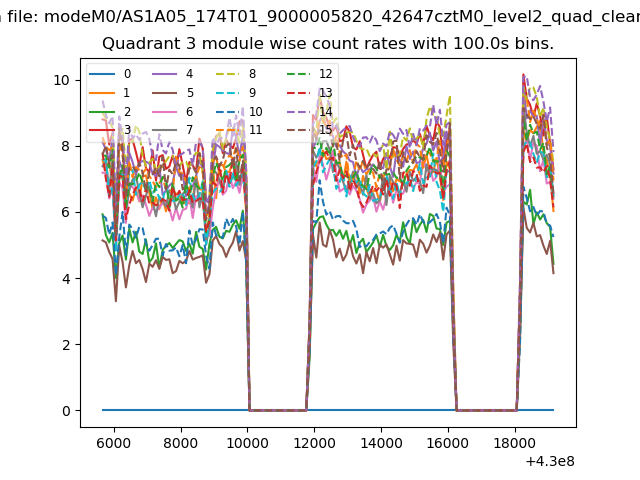
| Module-wise count rates for Quadrant A Data is divided into 100 sec bins |
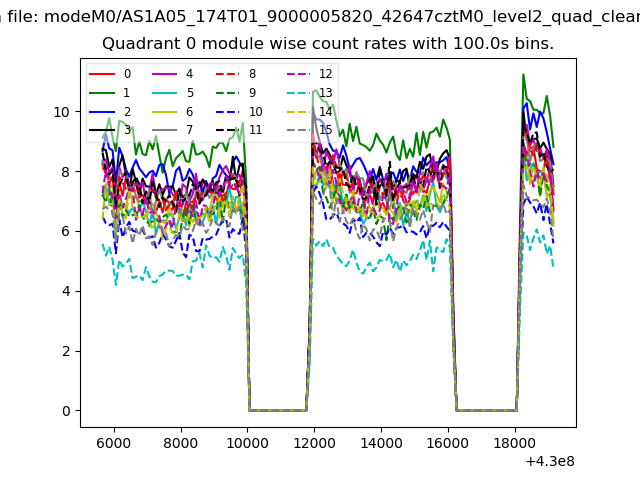 |
 |
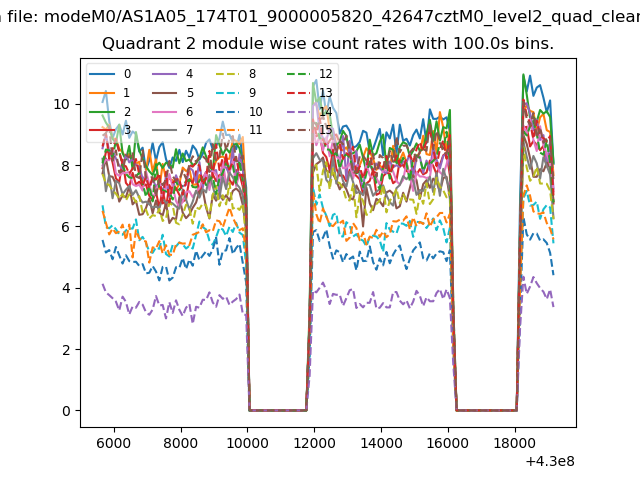
| Module-wise count rates for Quadrant B Data is divided into 100 sec bins |
 |
 |
| Module-wise count rates for Quadrant C Data is divided into 100 sec bins |
 |
 |
| Module-wise count rates for Quadrant D Data is divided into 100 sec bins |
 |
 |
| Parameter | Plot |
|---|---|
| CZT HV Monitor | 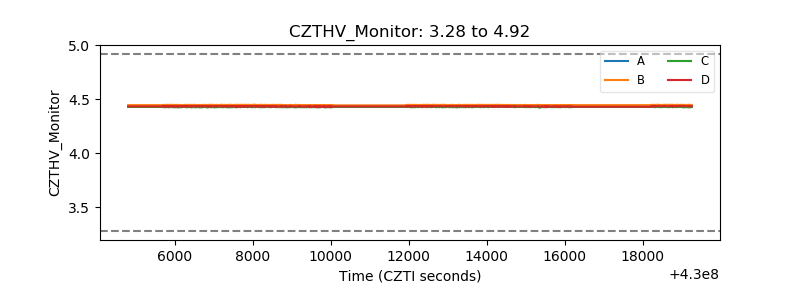 |
| D_VDD | 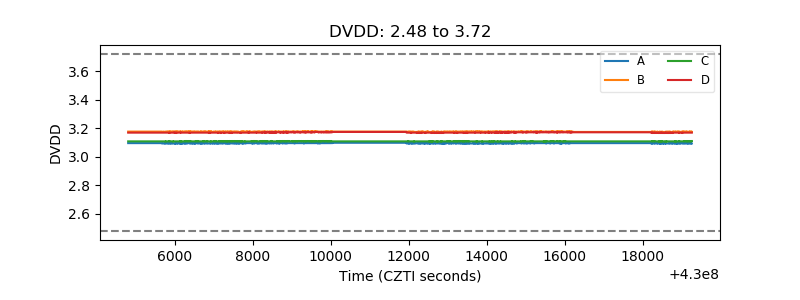 |
| Temperature 1 | 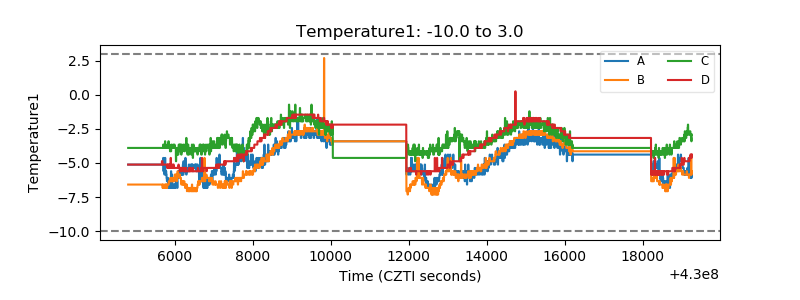 |
| Veto HV Monitor | 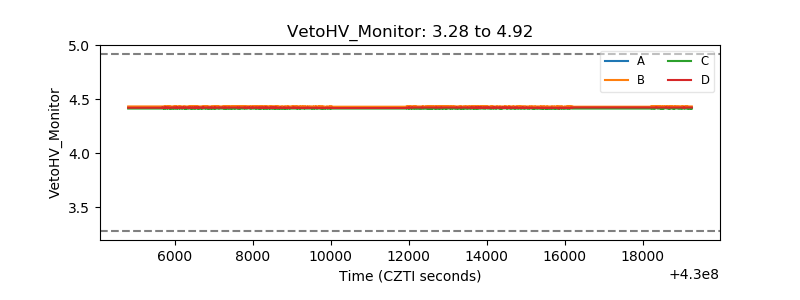 |
| Veto LLD | 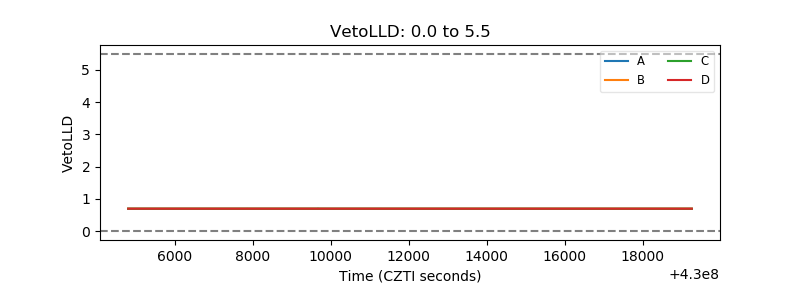 |
| Alpha Counter | 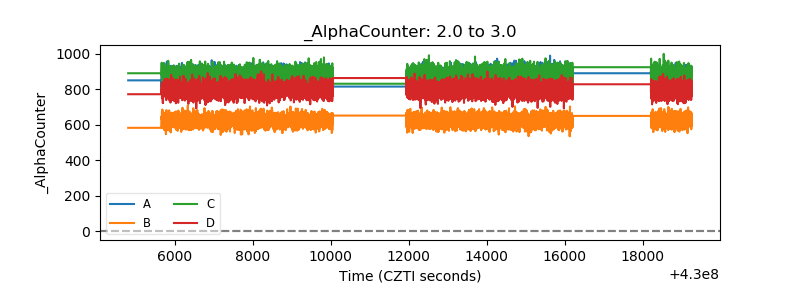 |
| _CPM_Rate | 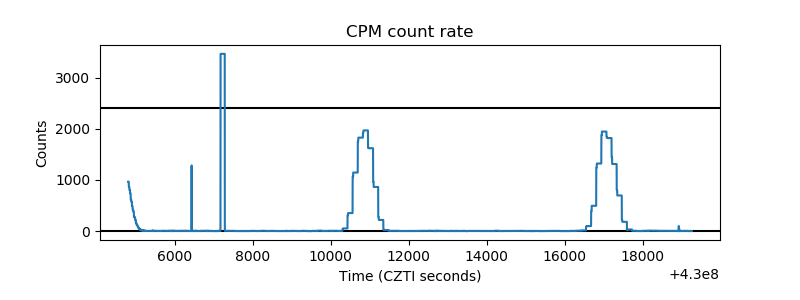 |
| CZT Counter | 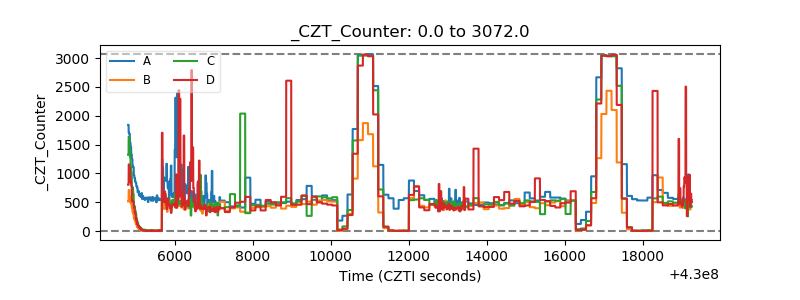 |
| +2.5 Volts monitor | 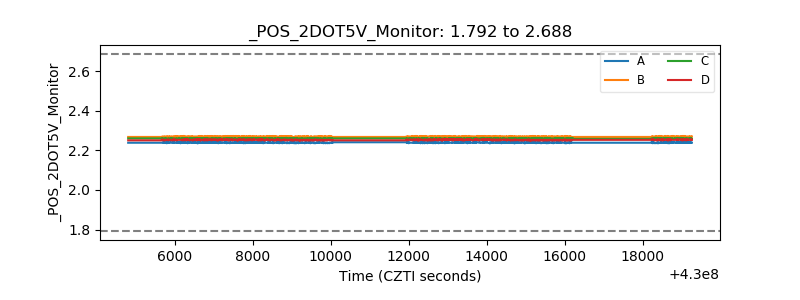 |
| +5 Volts monitor | 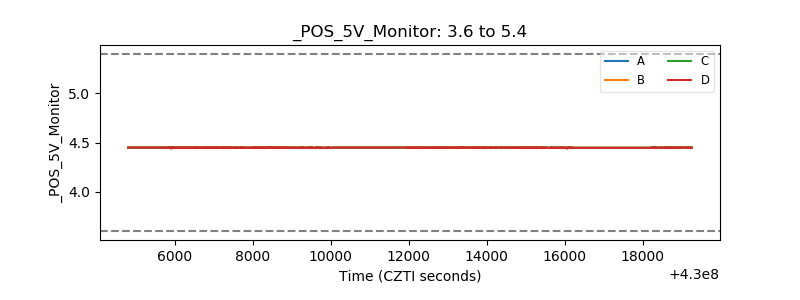 |
| _ROLL_ROT | 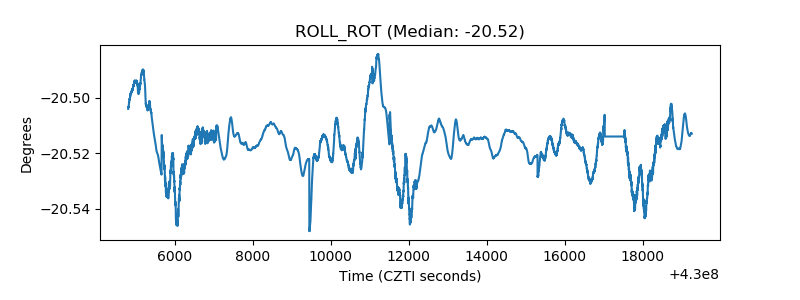 |
| _Roll_DEC | 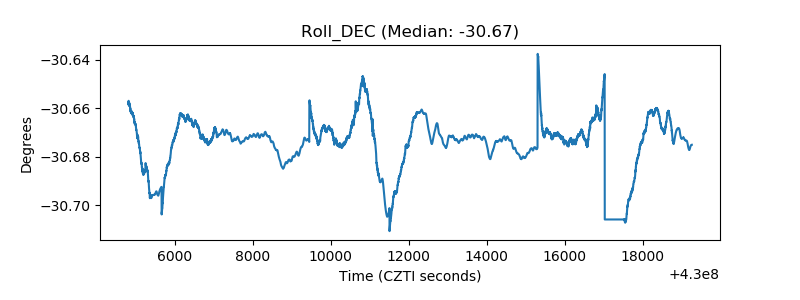 |
| _Roll_RA |  |
| Veto Counter | 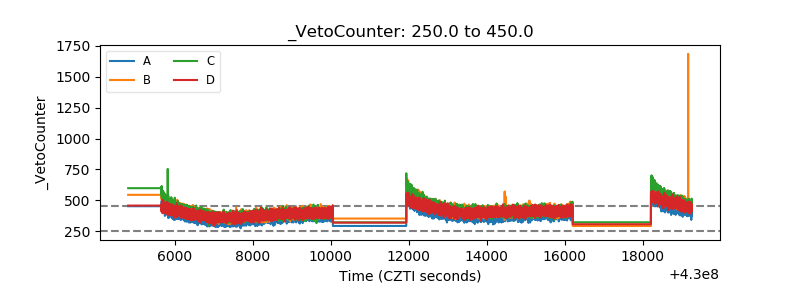 |