| Param | Original file | Final file |
|---|---|---|
| Filename | modeM0/AS1A05_174T01_9000005820_42648cztM0_level2.fits | modeM0/AS1A05_174T01_9000005820_42648cztM0_level2_quad_clean.evt |
| Size (bytes) | 309,988,800 | 90,394,560 |
| Size | 295.6 MB | 86.2 MB |
| Events in quadrant A | 2,834,438 | 608,834 |
| Events in quadrant B | 2,381,604 | 627,377 |
| Events in quadrant C | 2,557,854 | 609,712 |
| Events in quadrant D | 3,314,813 | 543,843 |
| Mode M9 | |||
|---|---|---|---|
| Quadrant | BADHDUFLAG | Total packets | Discarded packets |
| A | 0 | 32 | 0 |
| B | 0 | 33 | 0 |
| C | 0 | 33 | 0 |
| D | 0 | 33 | 0 |
| Mode SS | |||
|---|---|---|---|
| Quadrant | BADHDUFLAG | Total packets | Discarded packets |
| A | 0 | 102 | 0 |
| B | 0 | 102 | 0 |
| C | 0 | 102 | 0 |
| D | 0 | 102 | 0 |
| Mode M0 | |||
|---|---|---|---|
| Quadrant | BADHDUFLAG | Total packets | Discarded packets |
| A | 0 | 11257 | 2 |
| B | 0 | 10225 | 2 |
| C | 0 | 10237 | 2 |
| D | 0 | 13098 | 2 |
| Quadrant | Total seconds | Saturated seconds | Saturation percentage |
|---|---|---|---|
| A | 4953 | 18 | 0.363416% |
| B | 4953 | 46 | 0.928730% |
| C | 4953 | 8 | 0.161518% |
| D | 4953 | 171 | 3.452453% |
Noise dominated data is calculated using 1-second bins in cleaned event files. If a bin has >2000 counts, and if more than 50% of those come from <1% of pixels, then it is considered to be noise-dominated and hence unusable.
| Quadrant | # 1 sec bins | Bins with >0 counts | Bins with >2000 counts | High rate bins dominated by noise | Noise dominated (total time) | Noise dominated (detector-on time) | Marked lightcurve |
|---|---|---|---|---|---|---|---|
| A | 7047 | 4955 | 9 | 9 | 0.13% | 0.18% | 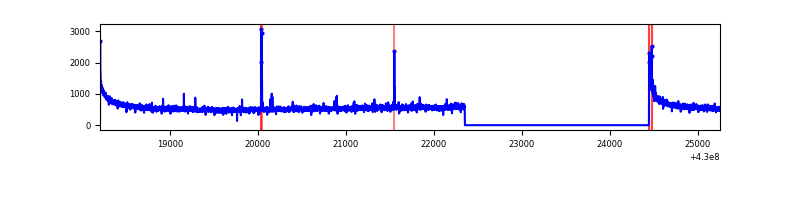 |
| B | 7047 | 4955 | 32 | 32 | 0.45% | 0.65% | 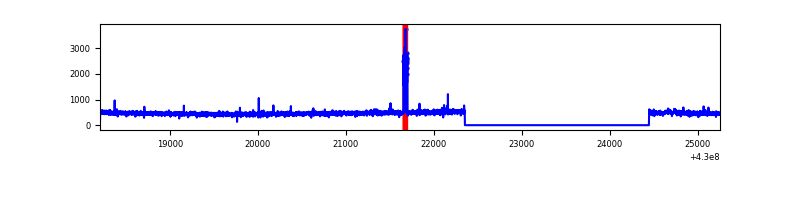 |
| C | 7047 | 4955 | 7 | 7 | 0.10% | 0.14% | 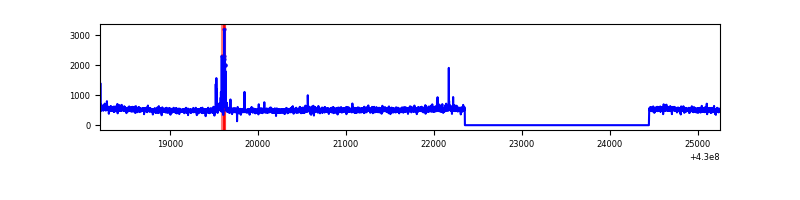 |
| D | 7047 | 4954 | 156 | 156 | 2.21% | 3.15% | 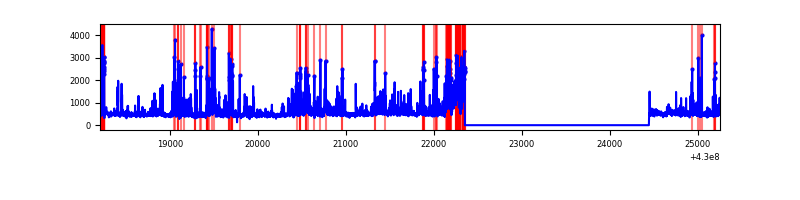 |
Top three noisy pixels from each quadrant. If the there are fewer than three noisy pixels in the level2.evt file, extra rows are filled as -1
| Pixel properties | Quadrant properties | ||||||
|---|---|---|---|---|---|---|---|
| Quadrant | DetID | PixID | Counts | Sigma | Mean | Median | Sigma |
| A | 10 | 83 | 525180 | 4341.7 | 586 | 574 | 120.8 |
| A | 7 | 3 | 32286 | 262.45 | 586 | 574 | 120.8 |
| A | 2 | 79 | 13703 | 108.66 | 586 | 574 | 120.8 |
| B | 3 | 112 | 97623 | 880.68 | 577 | 562 | 110.2 |
| B | 0 | 245 | 18760 | 165.12 | 577 | 562 | 110.2 |
| B | 12 | 111 | 13559 | 117.93 | 577 | 562 | 110.2 |
| C | 15 | 214 | 208688 | 1529.77 | 583 | 587 | 136.0 |
| C | 14 | 254 | 52683 | 382.96 | 583 | 587 | 136.0 |
| C | 3 | 233 | 17602 | 125.08 | 583 | 587 | 136.0 |
| D | 2 | 249 | 390675 | 2823.37 | 573 | 557 | 138.2 |
| D | 1 | 52 | 217851 | 1572.6 | 573 | 557 | 138.2 |
| D | 12 | 6 | 143935 | 1037.66 | 573 | 557 | 138.2 |
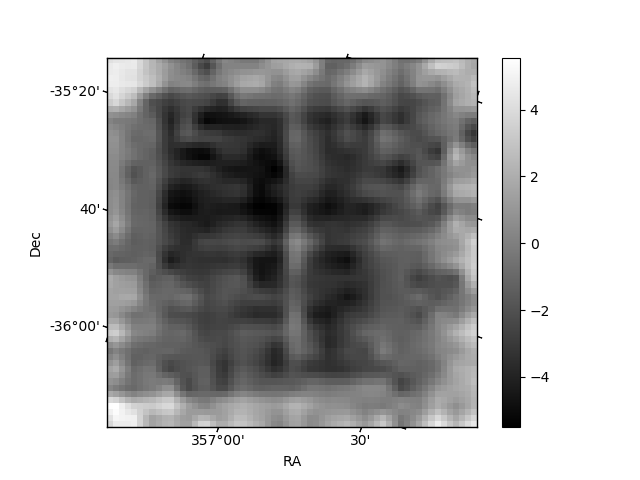
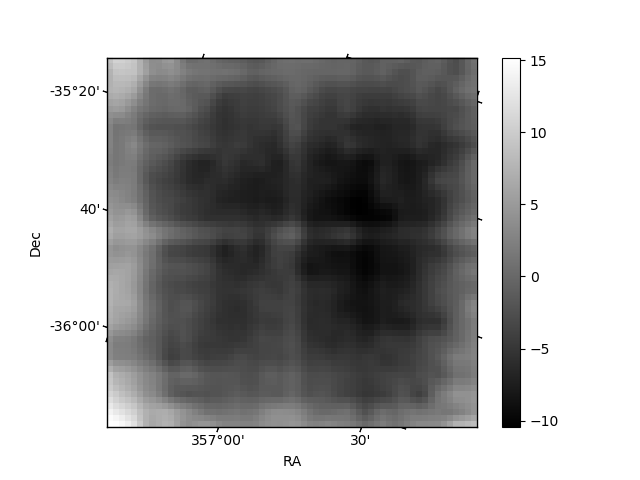
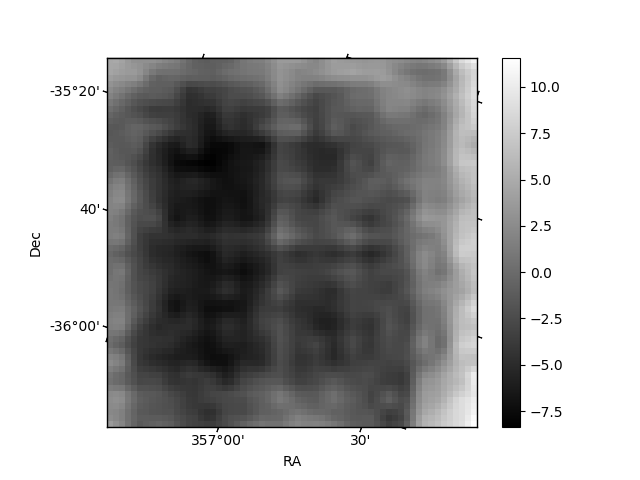
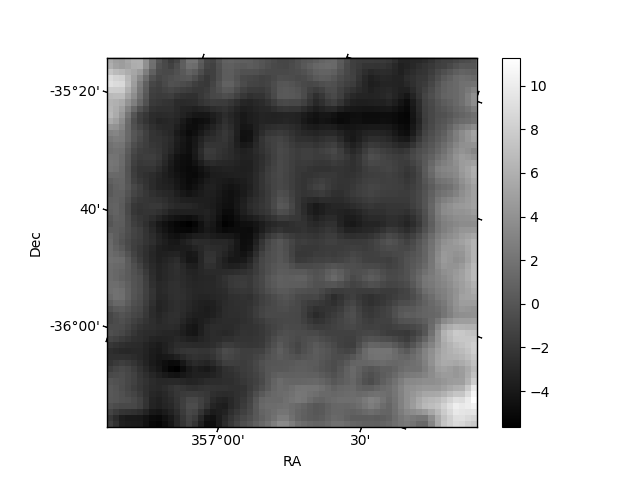
Histogram calculated using DETX and DETY for each event in the final _common_clean file
| Quadrant A | 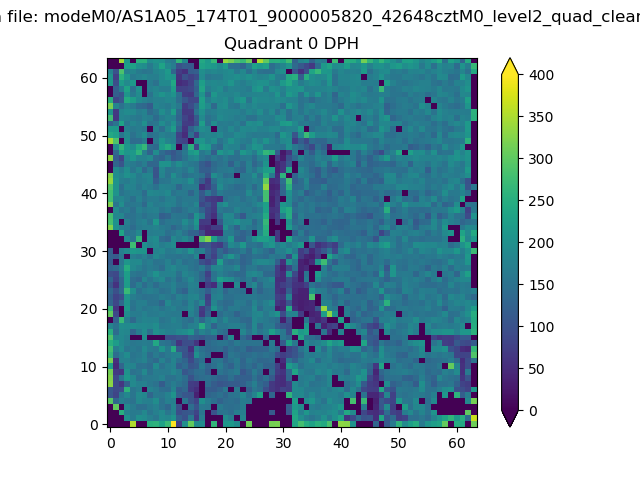 |
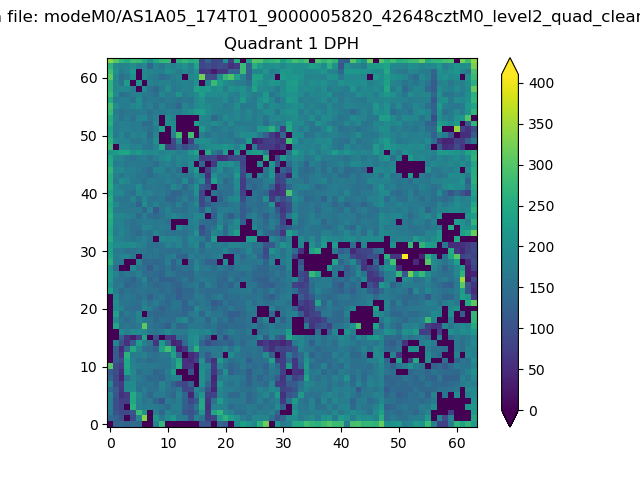 |
Quadrant B |
|---|---|---|---|
| Quadrant D | 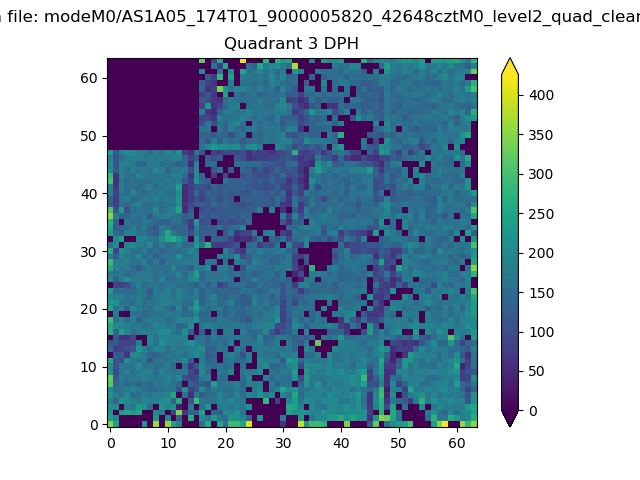 |
 |
Quadrant C |
| Plot type | Count rate plots | Images |
|---|---|---|
| Comparison with Poisson distribution Blue bars denote a histogram of data divided into 1 sec bins. Red curve is a Poisson curve with rate = median count rate of data. |
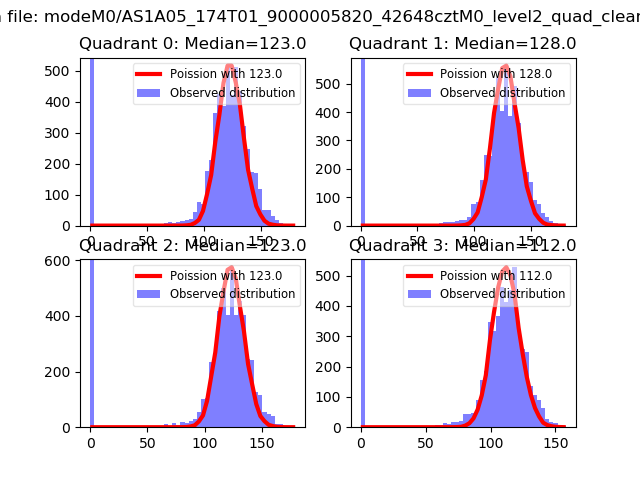 |
 |
| Quadrant-wise count rates Data is divided into 100 sec bins |
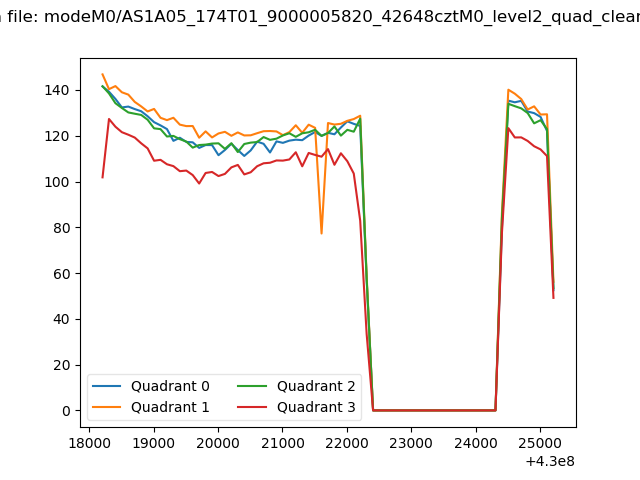 |
|
| Module-wise count rates for Quadrant A Data is divided into 100 sec bins |
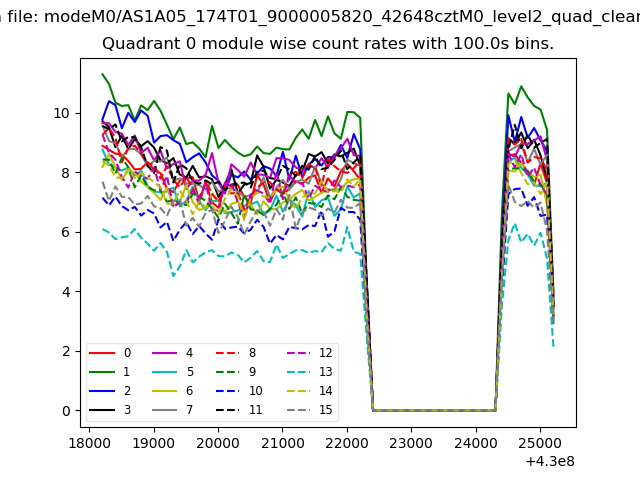 |
 |
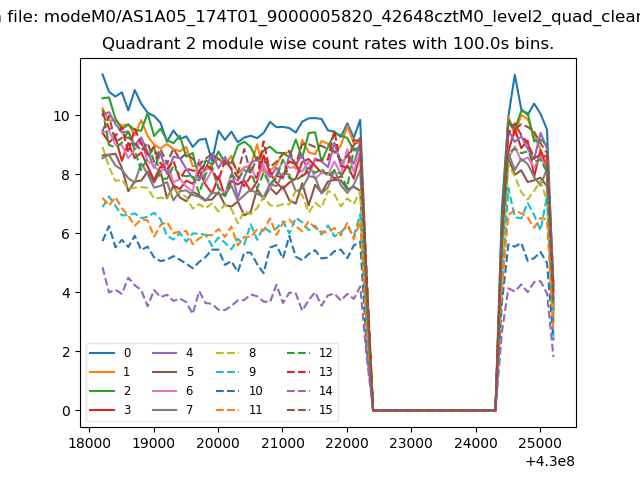
| Module-wise count rates for Quadrant B Data is divided into 100 sec bins |
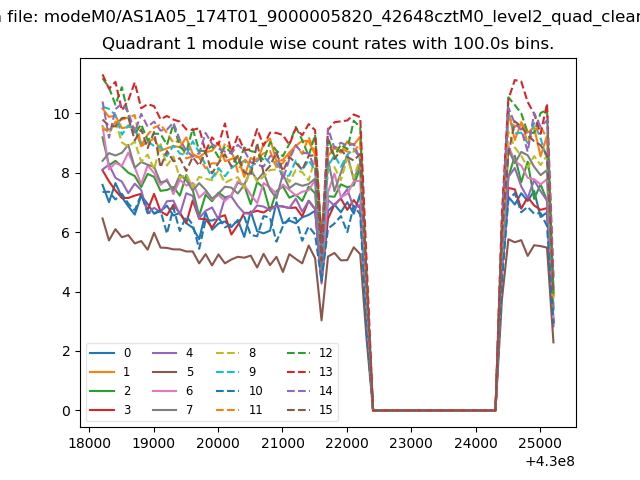 |
 |
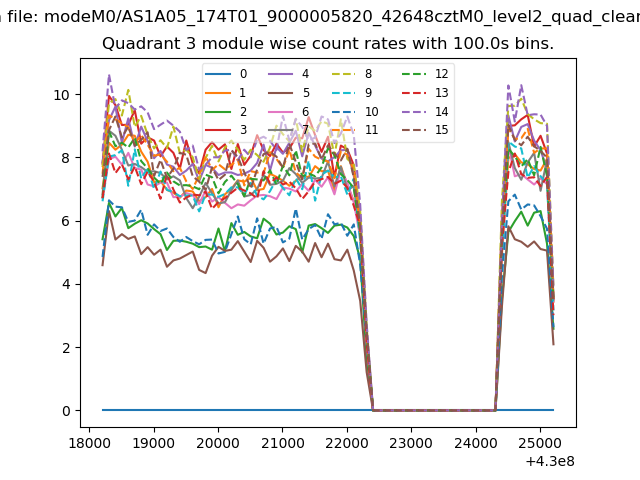
| Module-wise count rates for Quadrant C Data is divided into 100 sec bins |
 |
 |
| Module-wise count rates for Quadrant D Data is divided into 100 sec bins |
 |
 |
| Parameter | Plot |
|---|---|
| CZT HV Monitor | 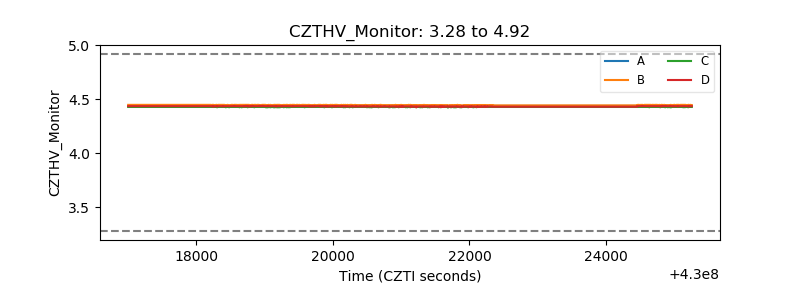 |
| D_VDD | 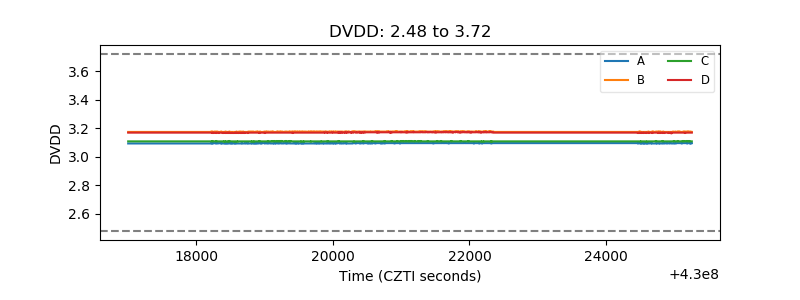 |
| Temperature 1 | 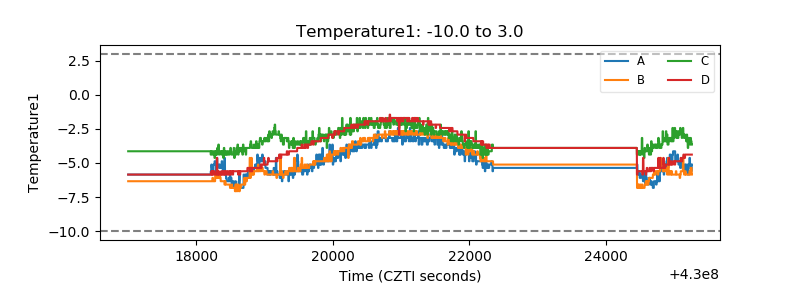 |
| Veto HV Monitor | 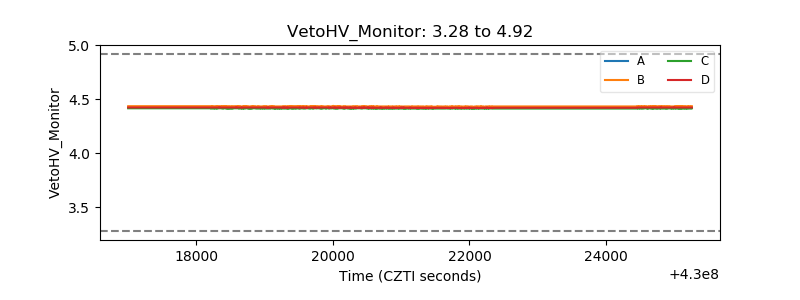 |
| Veto LLD | 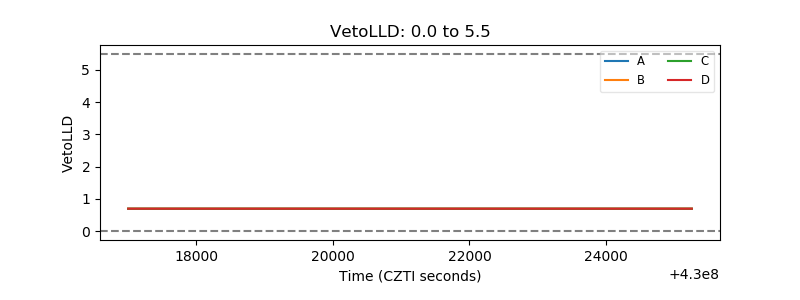 |
| Alpha Counter | 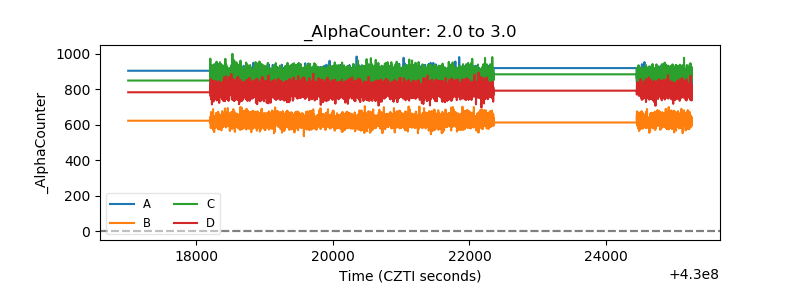 |
| _CPM_Rate | 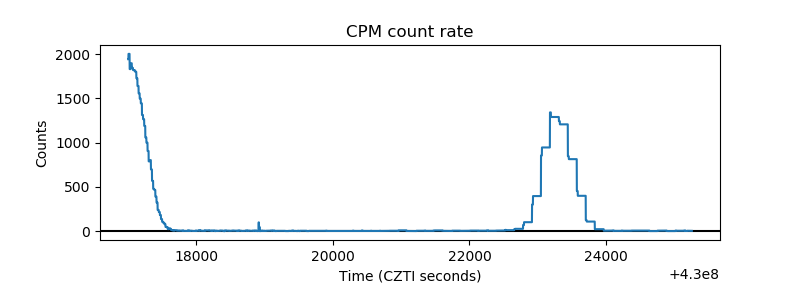 |
| CZT Counter | 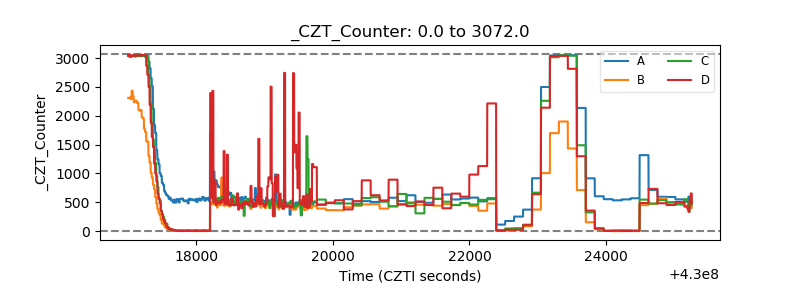 |
| +2.5 Volts monitor | 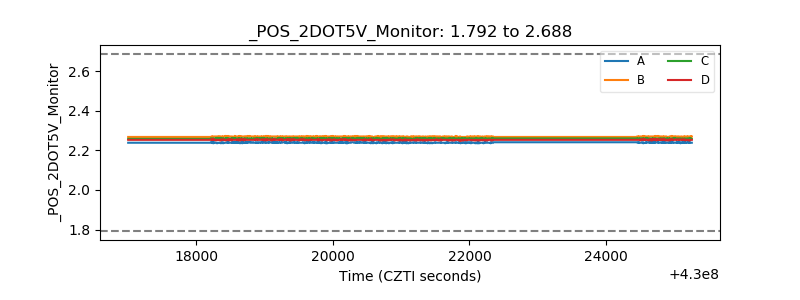 |
| +5 Volts monitor | 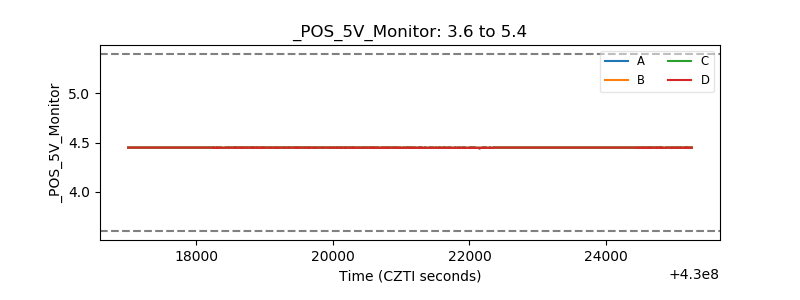 |
| _ROLL_ROT | 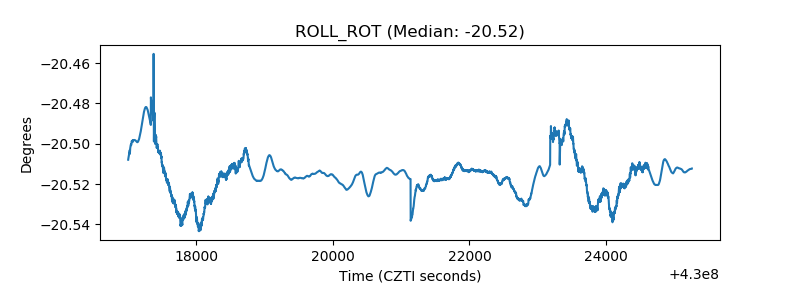 |
| _Roll_DEC | 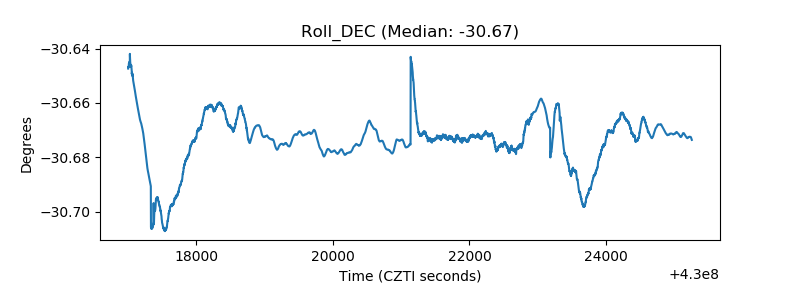 |
| _Roll_RA | 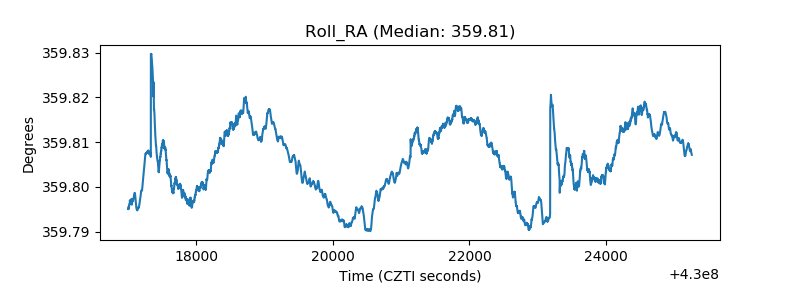 |
| Veto Counter | 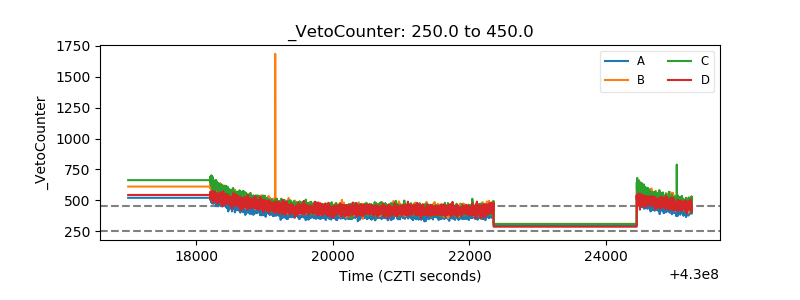 |