| Param | Original file | Final file |
|---|---|---|
| Filename | modeM0/AS1A05_174T01_9000005820_42649cztM0_level2.fits | modeM0/AS1A05_174T01_9000005820_42649cztM0_level2_quad_clean.evt |
| Size (bytes) | 303,013,440 | 88,136,640 |
| Size | 289.0 MB | 84.1 MB |
| Events in quadrant A | 2,845,345 | 592,840 |
| Events in quadrant B | 2,321,755 | 609,862 |
| Events in quadrant C | 2,487,317 | 592,076 |
| Events in quadrant D | 3,178,799 | 529,876 |
| Mode M9 | |||
|---|---|---|---|
| Quadrant | BADHDUFLAG | Total packets | Discarded packets |
| A | 0 | 28 | 0 |
| B | 0 | 29 | 0 |
| C | 0 | 29 | 0 |
| D | 0 | 29 | 0 |
| Mode SS | |||
|---|---|---|---|
| Quadrant | BADHDUFLAG | Total packets | Discarded packets |
| A | 0 | 98 | 0 |
| B | 0 | 98 | 0 |
| C | 0 | 98 | 0 |
| D | 0 | 98 | 0 |
| Mode M0 | |||
|---|---|---|---|
| Quadrant | BADHDUFLAG | Total packets | Discarded packets |
| A | 0 | 11286 | 2 |
| B | 0 | 9984 | 2 |
| C | 0 | 10079 | 2 |
| D | 0 | 12628 | 6 |
| Quadrant | Total seconds | Saturated seconds | Saturation percentage |
|---|---|---|---|
| A | 4916 | 18 | 0.366151% |
| B | 4916 | 5 | 0.101709% |
| C | 4916 | 6 | 0.122050% |
| D | 4915 | 170 | 3.458800% |
Noise dominated data is calculated using 1-second bins in cleaned event files. If a bin has >2000 counts, and if more than 50% of those come from <1% of pixels, then it is considered to be noise-dominated and hence unusable.
| Quadrant | # 1 sec bins | Bins with >0 counts | Bins with >2000 counts | High rate bins dominated by noise | Noise dominated (total time) | Noise dominated (detector-on time) | Marked lightcurve |
|---|---|---|---|---|---|---|---|
| A | 7039 | 4917 | 9 | 9 | 0.13% | 0.18% | 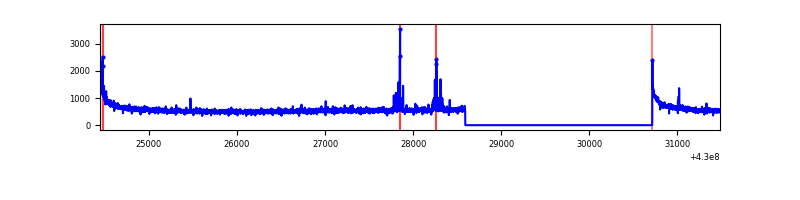 |
| B | 7039 | 4917 | 0 | 0 | 0.00% | 0.00% | 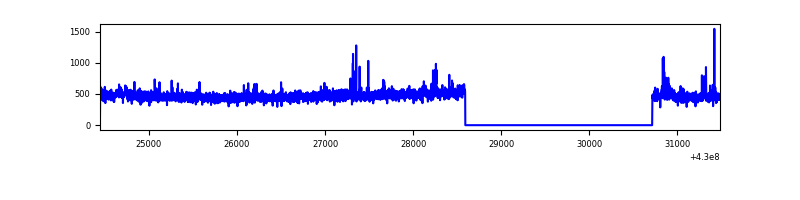 |
| C | 7039 | 4917 | 6 | 6 | 0.09% | 0.12% | 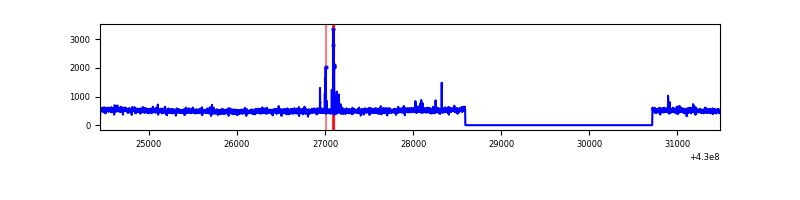 |
| D | 7038 | 4916 | 142 | 142 | 2.02% | 2.89% | 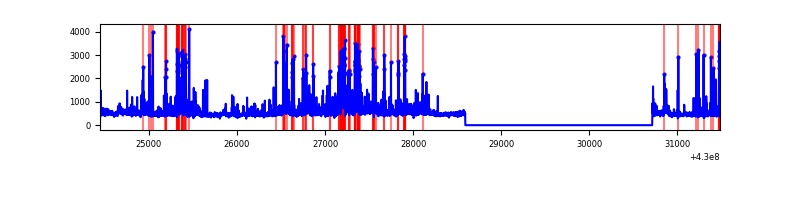 |
Top three noisy pixels from each quadrant. If the there are fewer than three noisy pixels in the level2.evt file, extra rows are filled as -1
| Pixel properties | Quadrant properties | ||||||
|---|---|---|---|---|---|---|---|
| Quadrant | DetID | PixID | Counts | Sigma | Mean | Median | Sigma |
| A | 10 | 83 | 531007 | 4450.03 | 578 | 566 | 119.2 |
| A | 10 | 255 | 60872 | 505.93 | 578 | 566 | 119.2 |
| A | 7 | 3 | 12291 | 98.36 | 578 | 566 | 119.2 |
| B | 0 | 245 | 28771 | 257.14 | 570 | 556 | 109.7 |
| B | 3 | 112 | 24231 | 215.76 | 570 | 556 | 109.7 |
| B | 0 | 168 | 13646 | 119.3 | 570 | 556 | 109.7 |
| C | 15 | 214 | 206392 | 1552.99 | 570 | 574 | 132.5 |
| C | 5 | 250 | 34261 | 254.18 | 570 | 574 | 132.5 |
| C | 14 | 254 | 11977 | 86.04 | 570 | 574 | 132.5 |
| D | 1 | 52 | 377014 | 2758.4 | 564 | 549 | 136.5 |
| D | 2 | 249 | 247419 | 1808.84 | 564 | 549 | 136.5 |
| D | 13 | 249 | 195305 | 1427.0 | 564 | 549 | 136.5 |
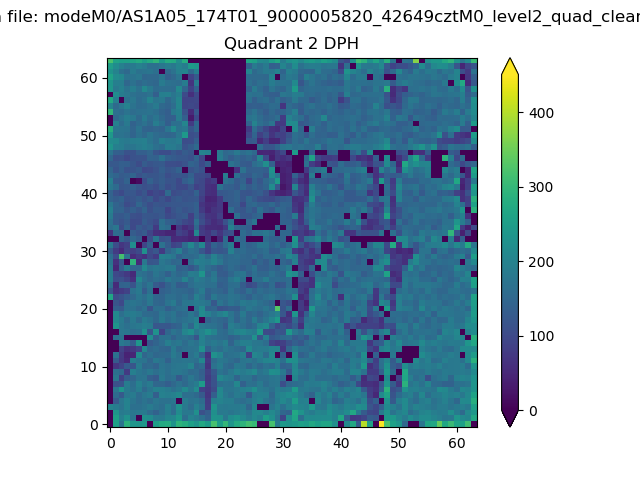
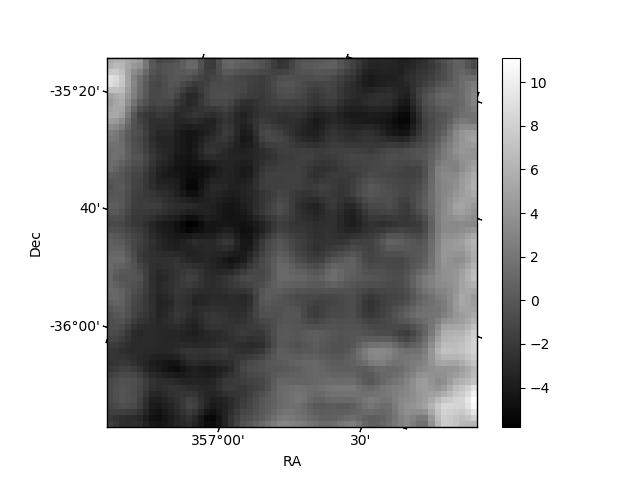
Histogram calculated using DETX and DETY for each event in the final _common_clean file
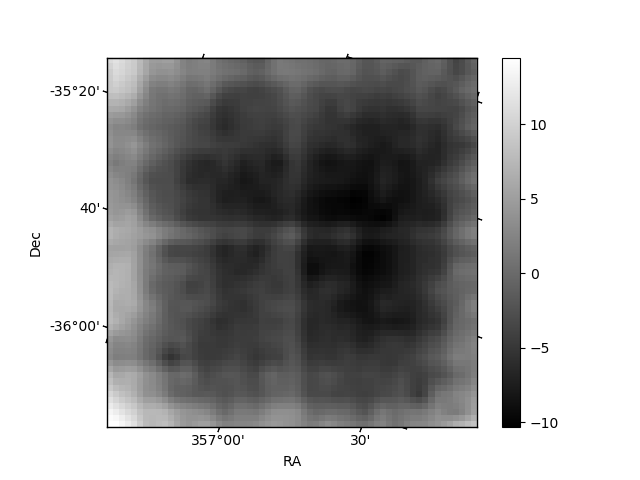
| Quadrant A | 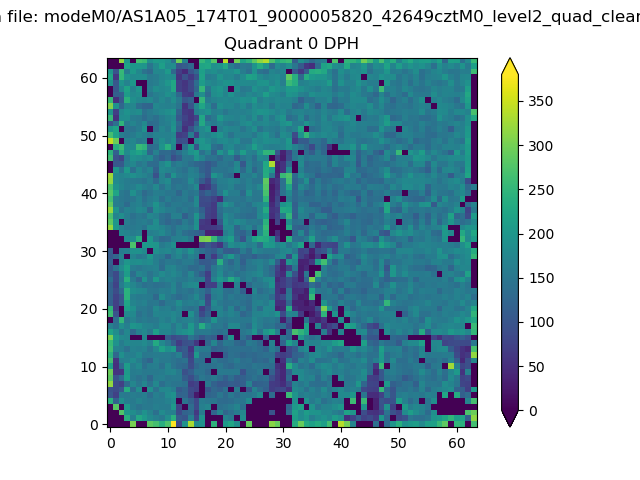 |
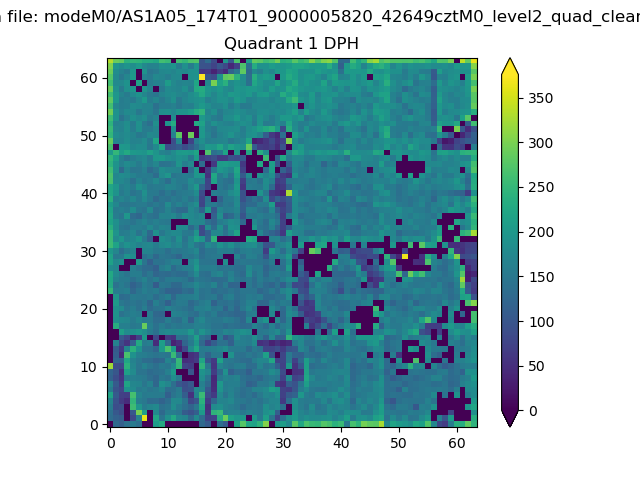 |
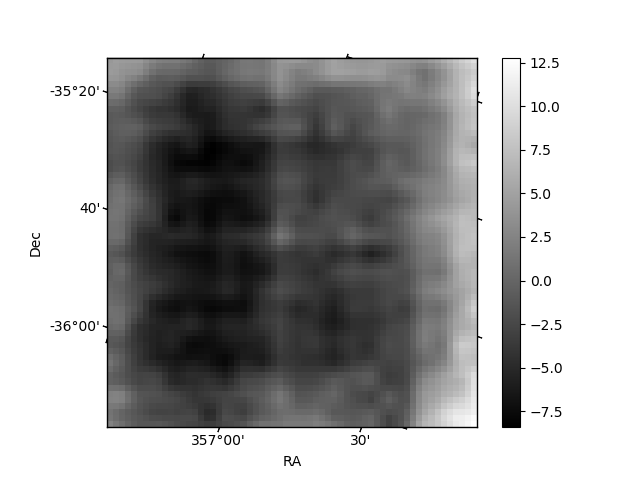
Quadrant B |
|---|---|---|---|
| Quadrant D | 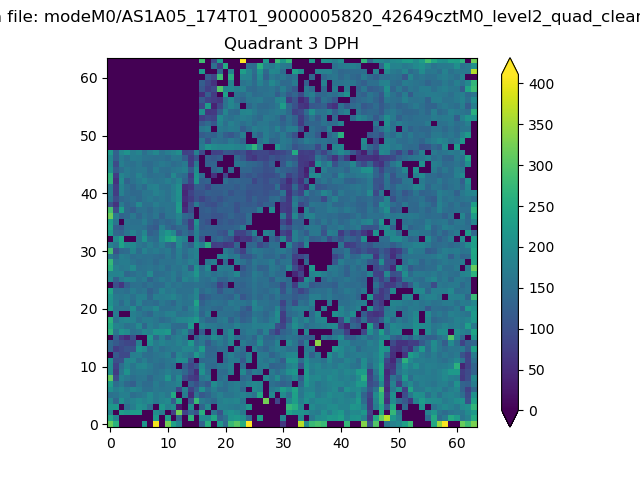 |
 |
Quadrant C |
| Plot type | Count rate plots | Images |
|---|---|---|
| Comparison with Poisson distribution Blue bars denote a histogram of data divided into 1 sec bins. Red curve is a Poisson curve with rate = median count rate of data. |
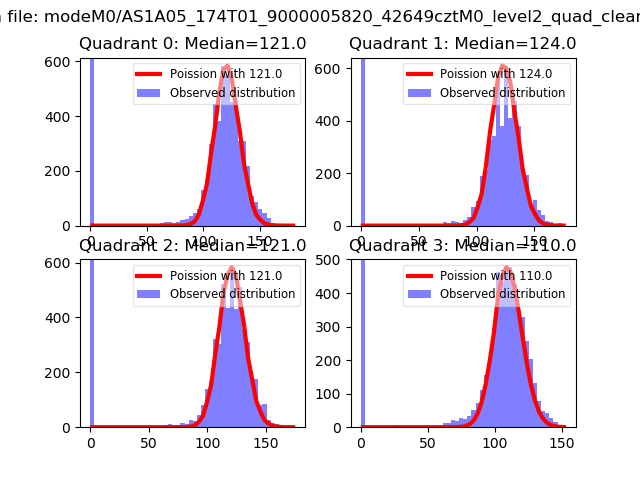 |
 |
| Quadrant-wise count rates Data is divided into 100 sec bins |
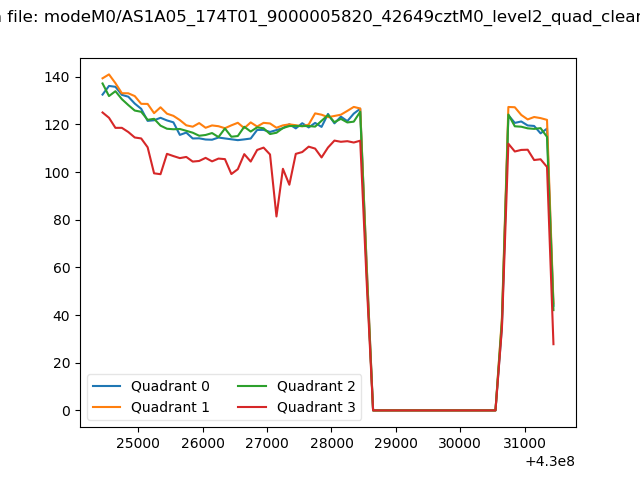 |
|
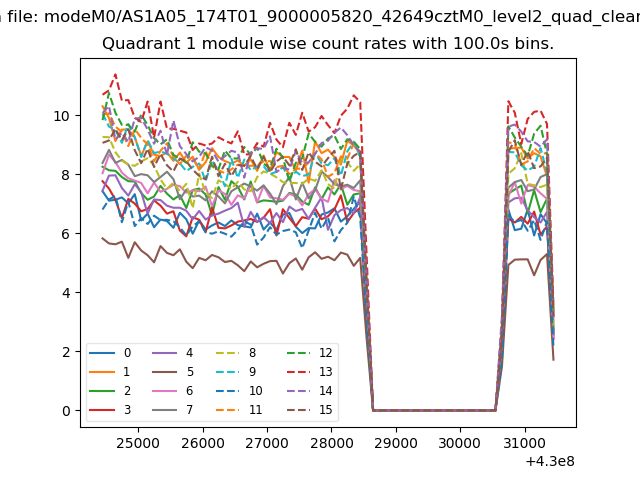
| Module-wise count rates for Quadrant A Data is divided into 100 sec bins |
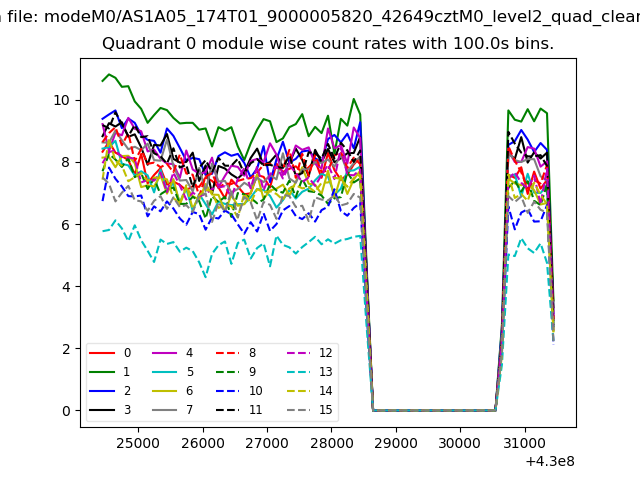 |
 |
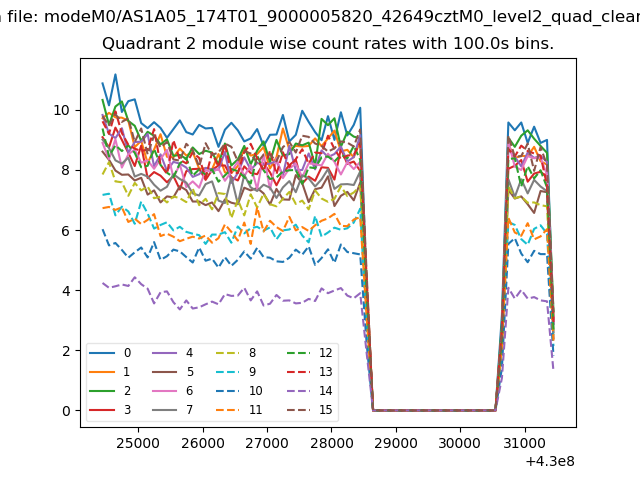
| Module-wise count rates for Quadrant B Data is divided into 100 sec bins |
 |
 |
| Module-wise count rates for Quadrant C Data is divided into 100 sec bins |
 |
 |
| Module-wise count rates for Quadrant D Data is divided into 100 sec bins |
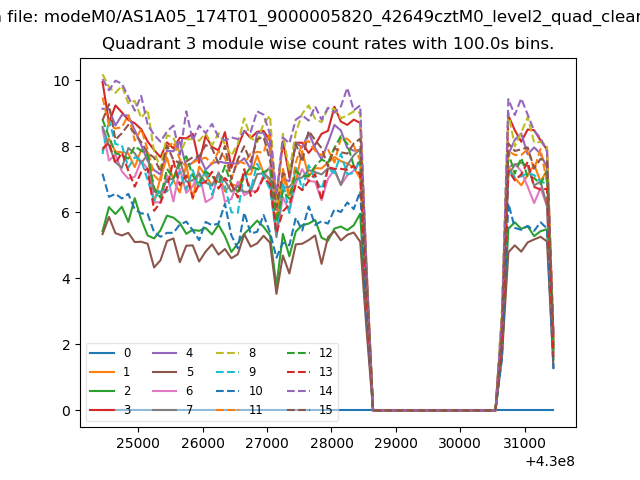 |
 |
| Parameter | Plot |
|---|---|
| CZT HV Monitor | 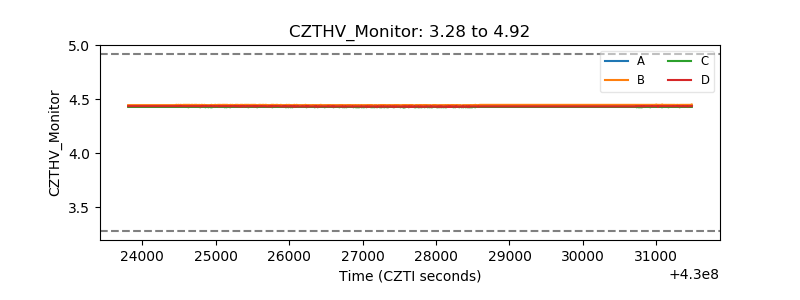 |
| D_VDD | 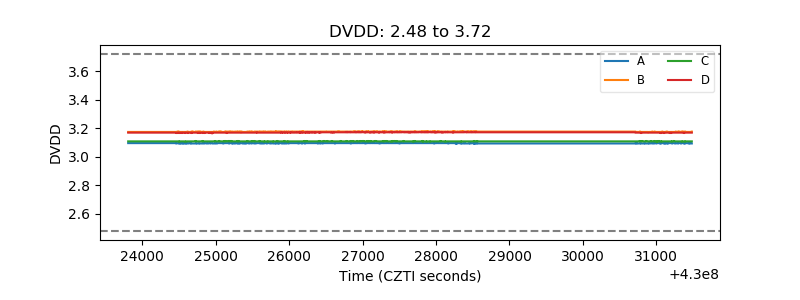 |
| Temperature 1 | 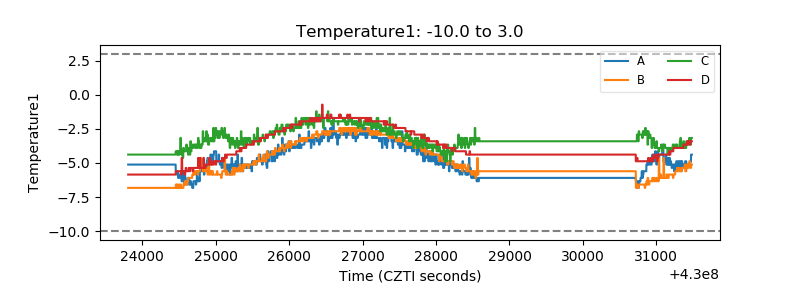 |
| Veto HV Monitor |  |
| Veto LLD | 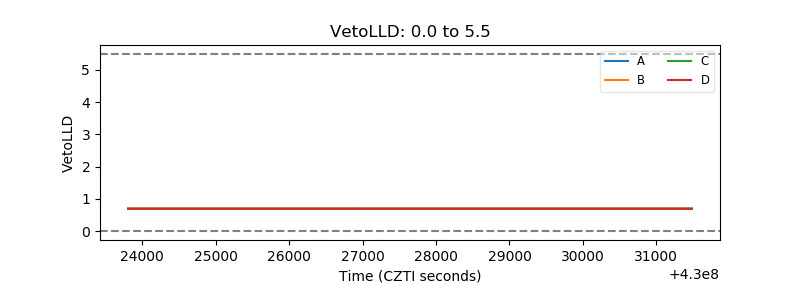 |
| Alpha Counter | 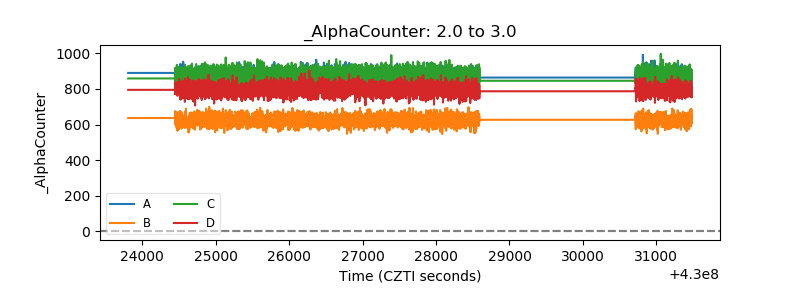 |
| _CPM_Rate | 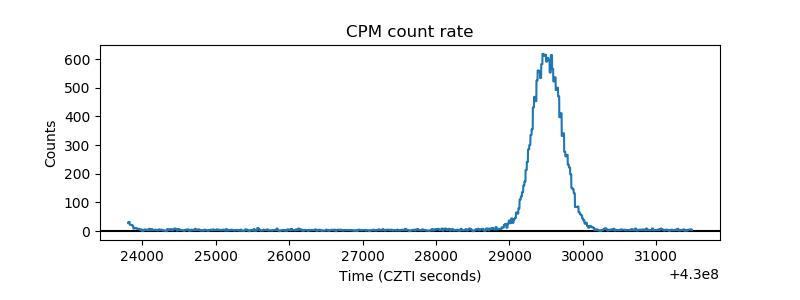 |
| CZT Counter | 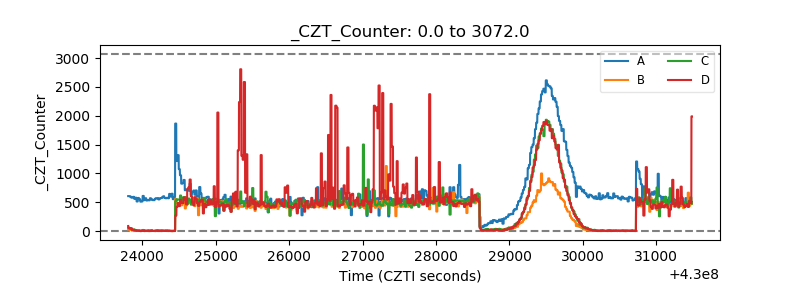 |
| +2.5 Volts monitor | 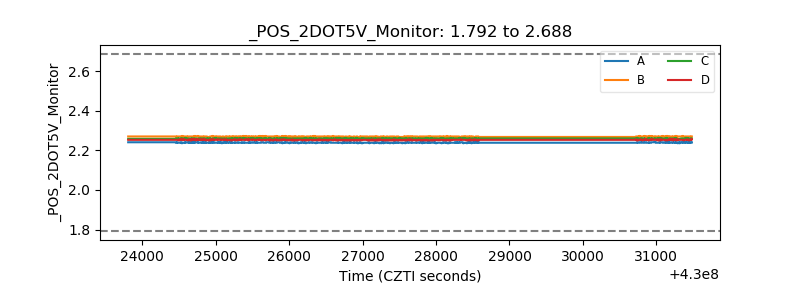 |
| +5 Volts monitor | 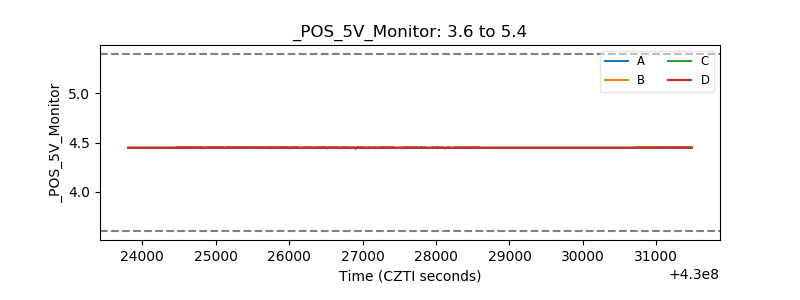 |
| _ROLL_ROT | 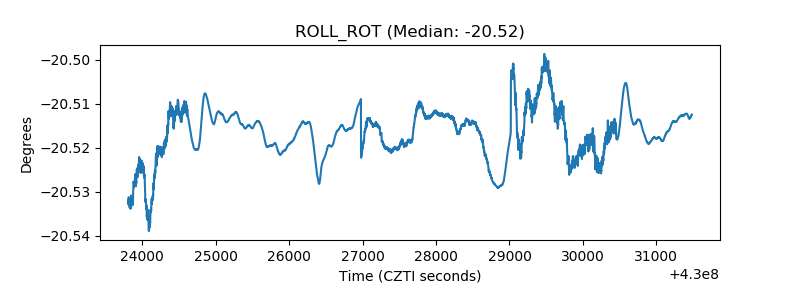 |
| _Roll_DEC |  |
| _Roll_RA | 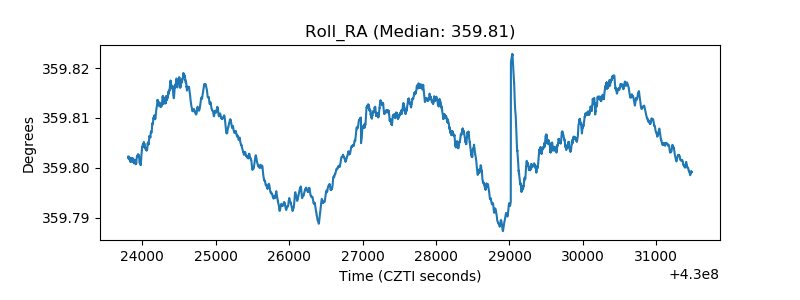 |
| Veto Counter | 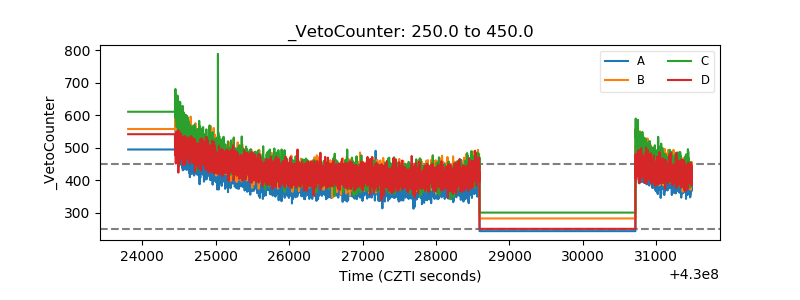 |