| Param | Original file | Final file |
|---|---|---|
| Filename | modeM0/AS1A05_174T01_9000005820_42651cztM0_level2.fits | modeM0/AS1A05_174T01_9000005820_42651cztM0_level2_quad_clean.evt |
| Size (bytes) | 302,535,360 | 87,382,080 |
| Size | 288.5 MB | 83.3 MB |
| Events in quadrant A | 2,808,655 | 581,192 |
| Events in quadrant B | 2,478,013 | 593,881 |
| Events in quadrant C | 2,500,733 | 577,361 |
| Events in quadrant D | 3,004,487 | 528,250 |
| Mode M9 | |||
|---|---|---|---|
| Quadrant | BADHDUFLAG | Total packets | Discarded packets |
| A | 0 | 40 | 0 |
| B | 0 | 40 | 0 |
| C | 0 | 40 | 0 |
| D | 0 | 39 | 0 |
| Mode SS | |||
|---|---|---|---|
| Quadrant | BADHDUFLAG | Total packets | Discarded packets |
| A | 0 | 108 | 0 |
| B | 0 | 108 | 0 |
| C | 0 | 108 | 0 |
| D | 0 | 108 | 0 |
| Mode M0 | |||
|---|---|---|---|
| Quadrant | BADHDUFLAG | Total packets | Discarded packets |
| A | 0 | 11301 | 27 |
| B | 0 | 10840 | 5 |
| C | 0 | 10536 | 6 |
| D | 0 | 12538 | 6 |
| Quadrant | Total seconds | Saturated seconds | Saturation percentage |
|---|---|---|---|
| A | 5215 | 8 | 0.153404% |
| B | 5220 | 24 | 0.459770% |
| C | 5218 | 2 | 0.038329% |
| D | 5219 | 98 | 1.877754% |
Noise dominated data is calculated using 1-second bins in cleaned event files. If a bin has >2000 counts, and if more than 50% of those come from <1% of pixels, then it is considered to be noise-dominated and hence unusable.
| Quadrant | # 1 sec bins | Bins with >0 counts | Bins with >2000 counts | High rate bins dominated by noise | Noise dominated (total time) | Noise dominated (detector-on time) | Marked lightcurve |
|---|---|---|---|---|---|---|---|
| A | 9199 | 5224 | 2 | 2 | 0.02% | 0.04% | 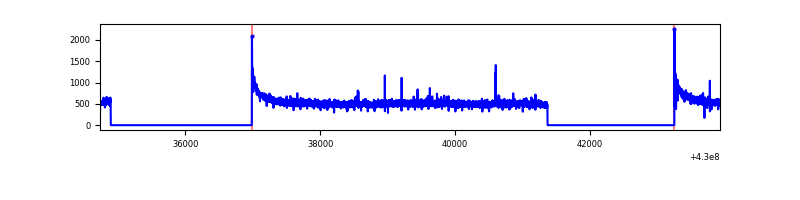 |
| B | 9200 | 5225 | 13 | 13 | 0.14% | 0.25% | 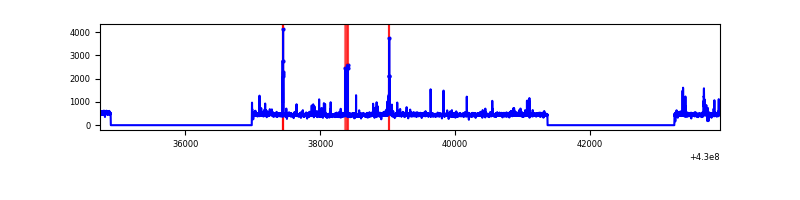 |
| C | 9199 | 5223 | 0 | 0 | 0.00% | 0.00% | 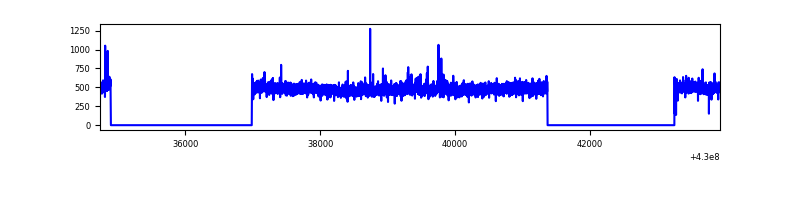 |
| D | 9199 | 5223 | 93 | 93 | 1.01% | 1.78% | 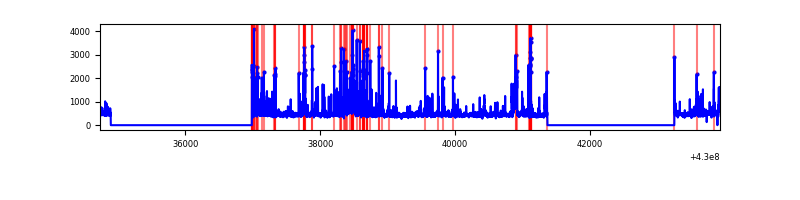 |
Top three noisy pixels from each quadrant. If the there are fewer than three noisy pixels in the level2.evt file, extra rows are filled as -1
| Pixel properties | Quadrant properties | ||||||
|---|---|---|---|---|---|---|---|
| Quadrant | DetID | PixID | Counts | Sigma | Mean | Median | Sigma |
| A | 10 | 83 | 526017 | 4303.12 | 586 | 572 | 122.1 |
| A | 7 | 3 | 7314 | 55.21 | 586 | 572 | 122.1 |
| A | 13 | 254 | 6989 | 52.55 | 586 | 572 | 122.1 |
| B | 0 | 229 | 53542 | 464.29 | 581 | 565 | 114.1 |
| B | 3 | 112 | 52601 | 456.04 | 581 | 565 | 114.1 |
| B | 0 | 245 | 30100 | 258.84 | 581 | 565 | 114.1 |
| C | 15 | 214 | 217462 | 1608.62 | 576 | 579 | 134.8 |
| C | 3 | 233 | 18364 | 131.91 | 576 | 579 | 134.8 |
| C | 15 | 111 | 8839 | 61.26 | 576 | 579 | 134.8 |
| D | 2 | 249 | 286264 | 2032.84 | 571 | 554 | 140.5 |
| D | 12 | 6 | 123137 | 872.18 | 571 | 554 | 140.5 |
| D | 13 | 249 | 117622 | 832.94 | 571 | 554 | 140.5 |
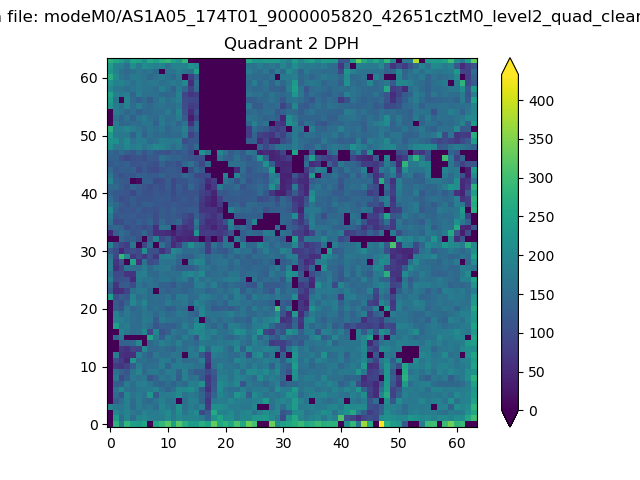
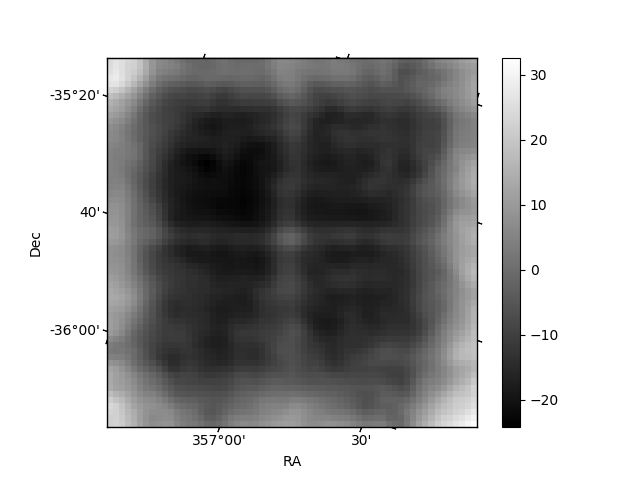
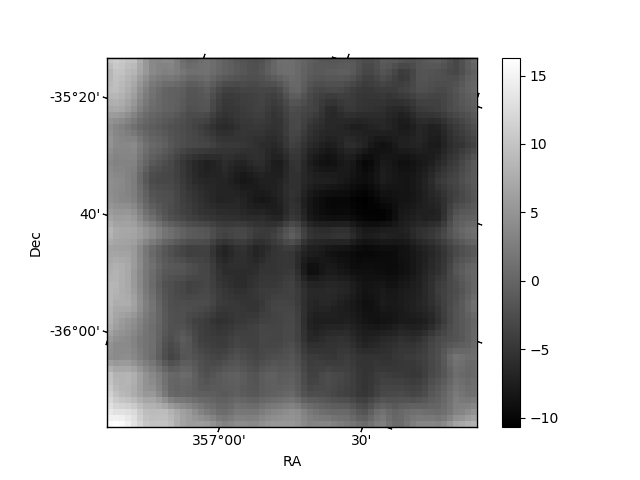
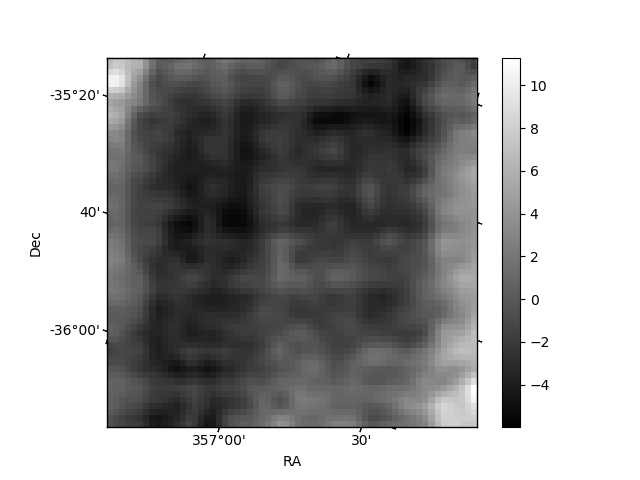
Histogram calculated using DETX and DETY for each event in the final _common_clean file
| Quadrant A | 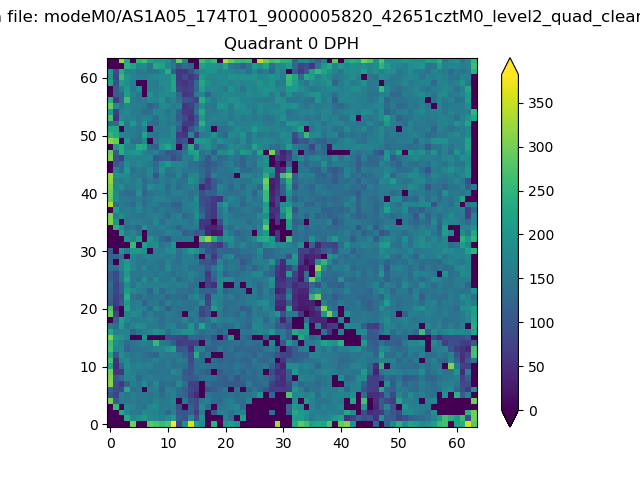 |
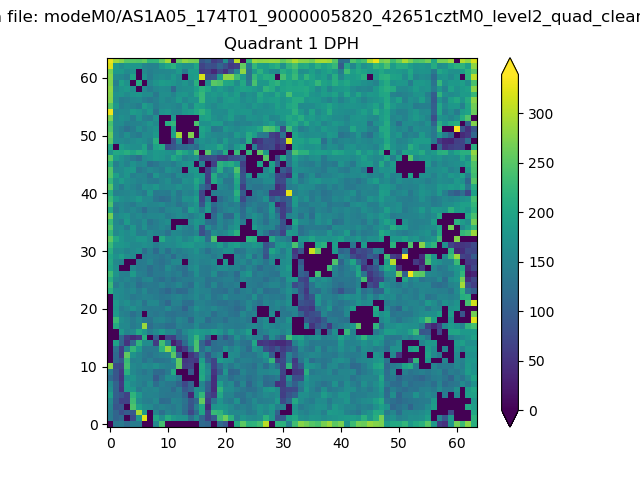 |
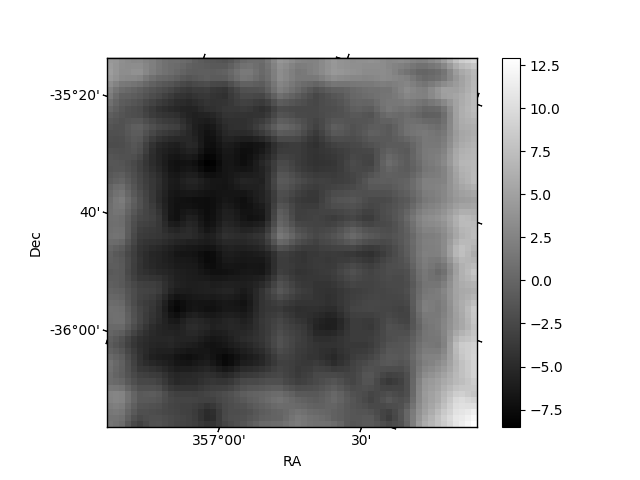
Quadrant B |
|---|---|---|---|
| Quadrant D | 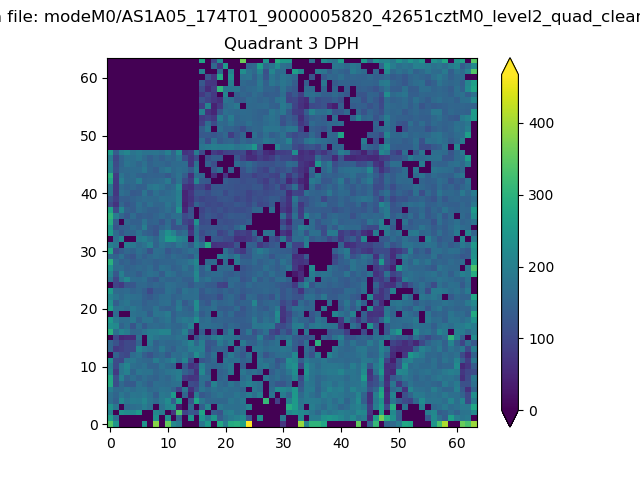 |
 |
Quadrant C |
| Plot type | Count rate plots | Images |
|---|---|---|
| Comparison with Poisson distribution Blue bars denote a histogram of data divided into 1 sec bins. Red curve is a Poisson curve with rate = median count rate of data. |
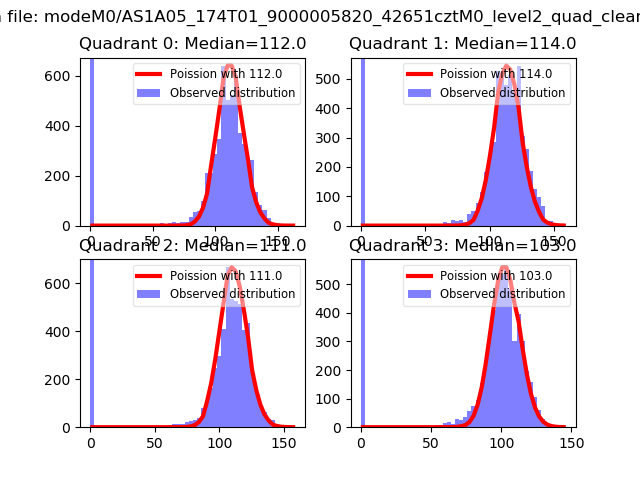 |
 |
| Quadrant-wise count rates Data is divided into 100 sec bins |
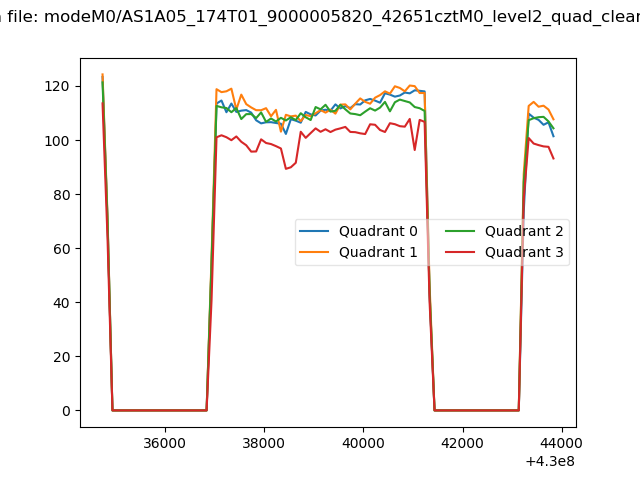 |
|
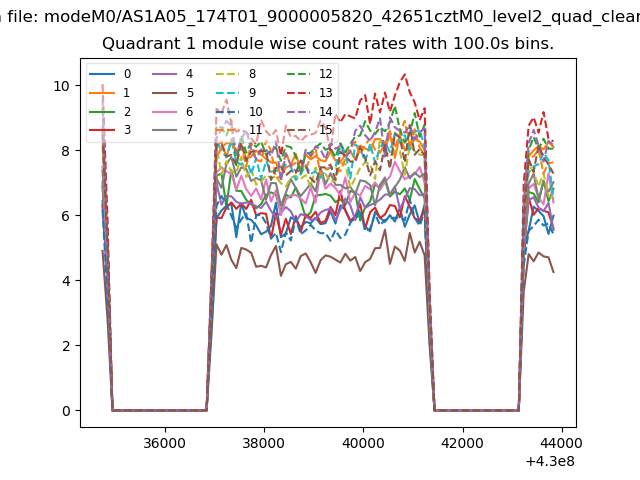
| Module-wise count rates for Quadrant A Data is divided into 100 sec bins |
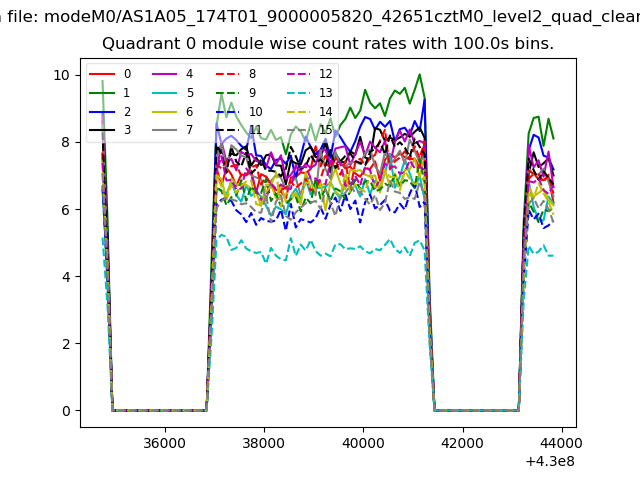 |
 |
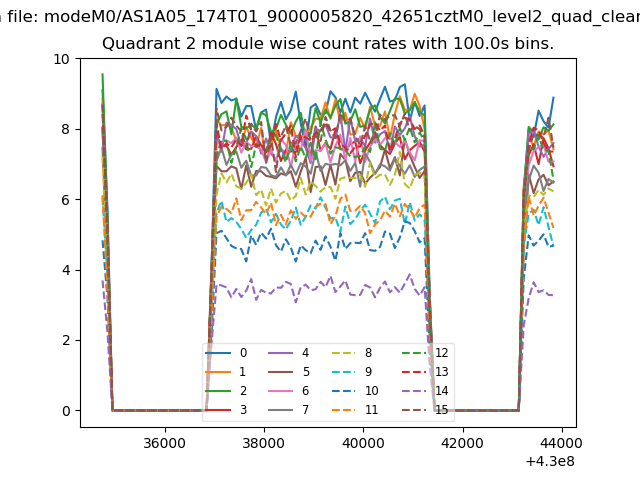
| Module-wise count rates for Quadrant B Data is divided into 100 sec bins |
 |
 |
| Module-wise count rates for Quadrant C Data is divided into 100 sec bins |
 |
 |
| Module-wise count rates for Quadrant D Data is divided into 100 sec bins |
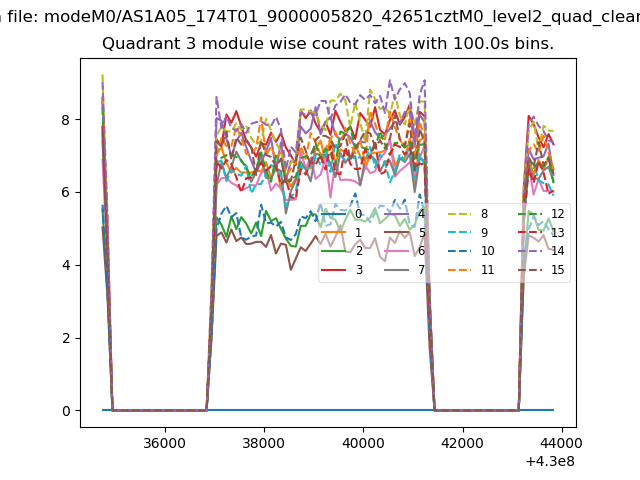 |
 |
| Parameter | Plot |
|---|---|
| CZT HV Monitor | 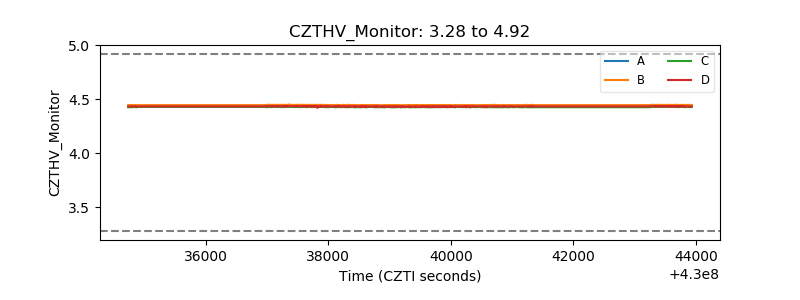 |
| D_VDD | 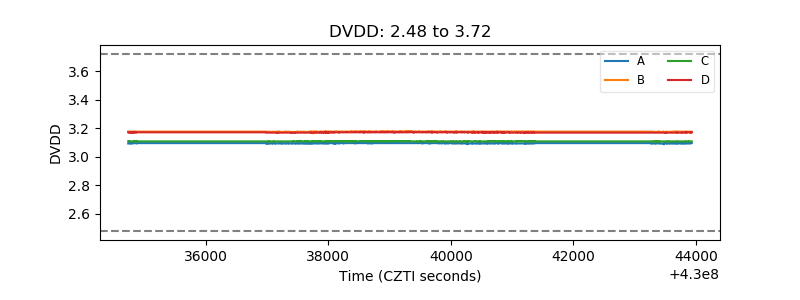 |
| Temperature 1 | 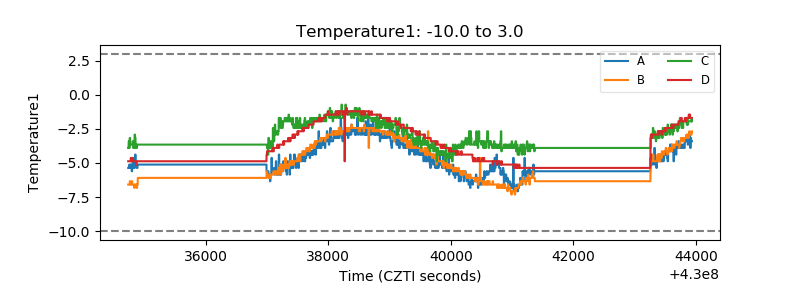 |
| Veto HV Monitor | 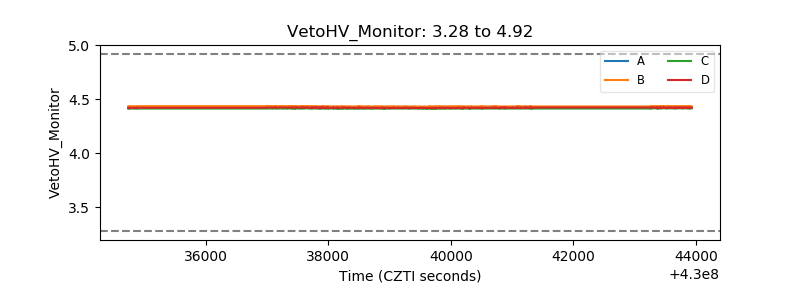 |
| Veto LLD | 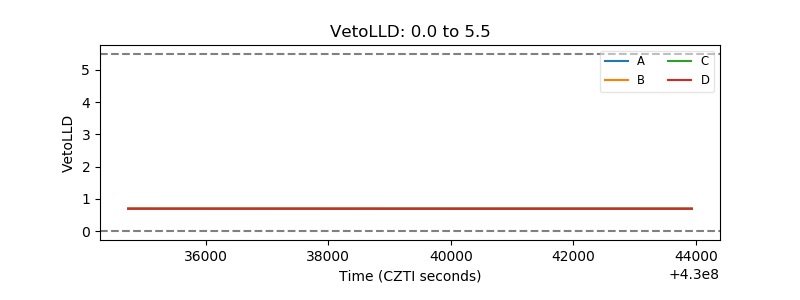 |
| Alpha Counter | 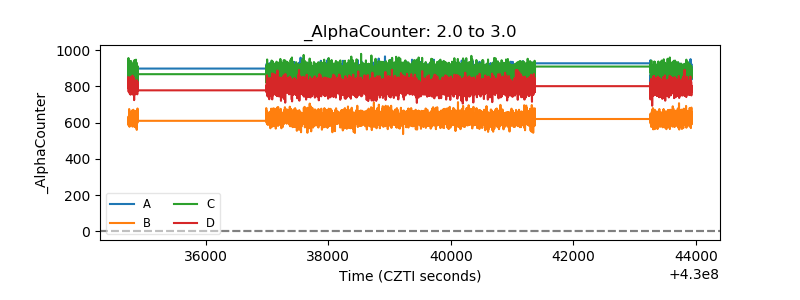 |
| _CPM_Rate | 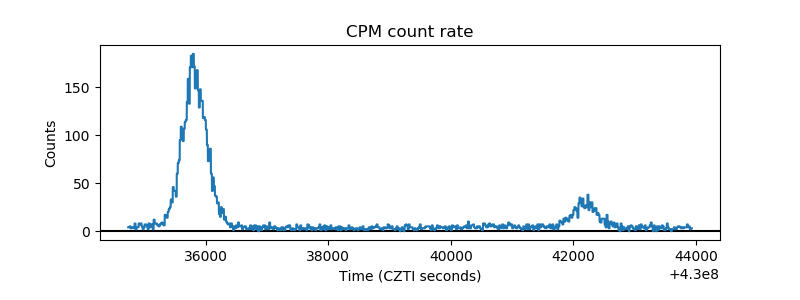 |
| CZT Counter | 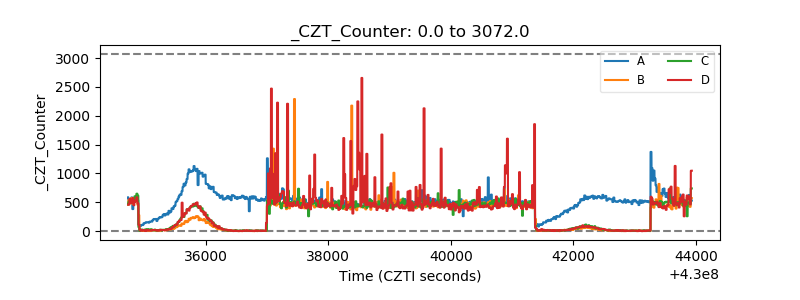 |
| +2.5 Volts monitor | 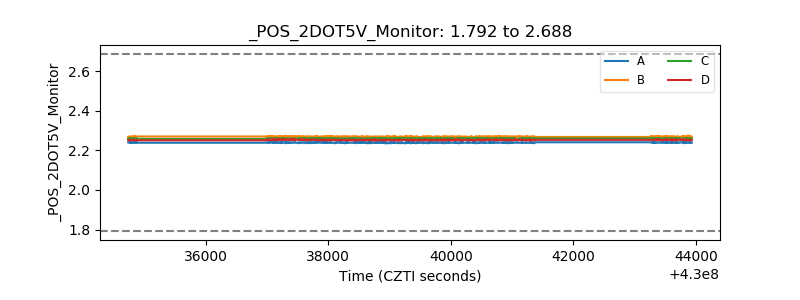 |
| +5 Volts monitor |  |
| _ROLL_ROT | 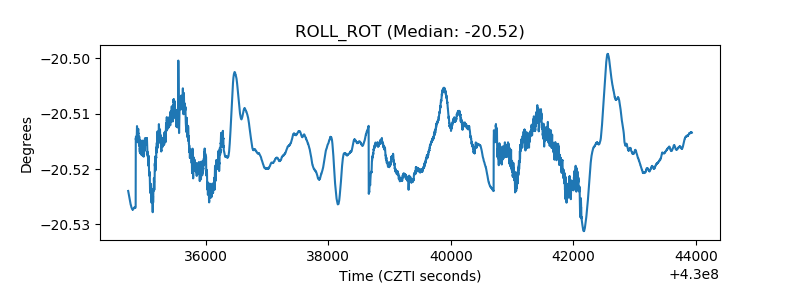 |
| _Roll_DEC | 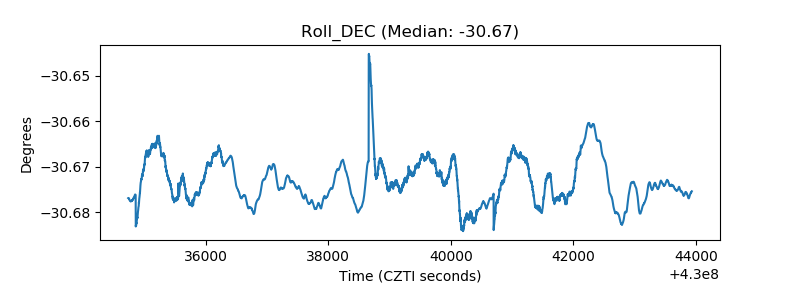 |
| _Roll_RA | 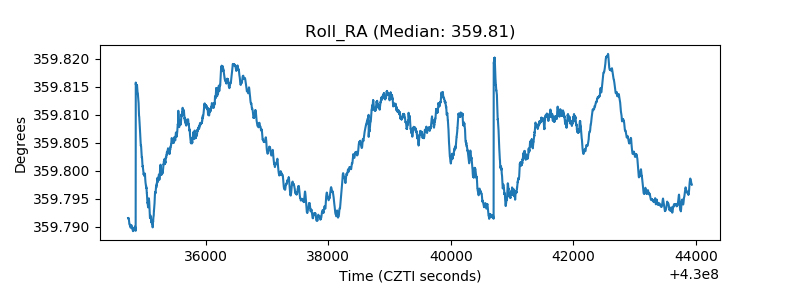 |
| Veto Counter | 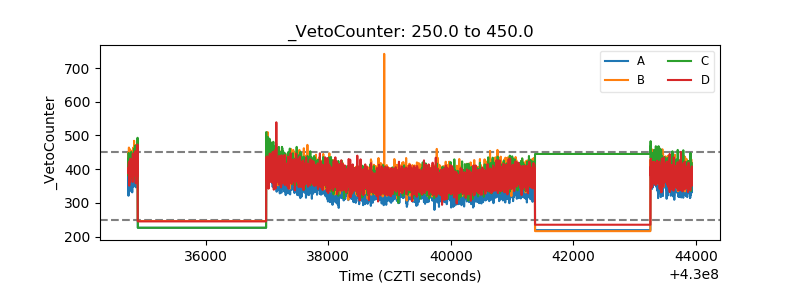 |