| Param | Original file | Final file |
|---|---|---|
| Filename | modeM0/AS1A05_174T01_9000005820_42652cztM0_level2.fits | modeM0/AS1A05_174T01_9000005820_42652cztM0_level2_quad_clean.evt |
| Size (bytes) | 377,000,640 | 88,758,720 |
| Size | 359.5 MB | 84.6 MB |
| Events in quadrant A | 2,950,308 | 603,836 |
| Events in quadrant B | 2,867,651 | 609,427 |
| Events in quadrant C | 2,727,330 | 601,030 |
| Events in quadrant D | 4,977,759 | 484,962 |
| Mode M9 | |||
|---|---|---|---|
| Quadrant | BADHDUFLAG | Total packets | Discarded packets |
| A | 0 | 20 | 0 |
| B | 0 | 21 | 0 |
| C | 0 | 21 | 0 |
| D | 0 | 21 | 0 |
| Mode SS | |||
|---|---|---|---|
| Quadrant | BADHDUFLAG | Total packets | Discarded packets |
| A | 0 | 114 | 0 |
| B | 0 | 114 | 0 |
| C | 0 | 114 | 0 |
| D | 0 | 114 | 0 |
| Mode M0 | |||
|---|---|---|---|
| Quadrant | BADHDUFLAG | Total packets | Discarded packets |
| A | 0 | 11985 | 2 |
| B | 0 | 12281 | 2 |
| C | 0 | 11496 | 2 |
| D | 0 | 18648 | 2 |
| Quadrant | Total seconds | Saturated seconds | Saturation percentage |
|---|---|---|---|
| A | 5548 | 7 | 0.126172% |
| B | 5548 | 129 | 2.325162% |
| C | 5548 | 30 | 0.540735% |
| D | 5548 | 807 | 14.545782% |
Noise dominated data is calculated using 1-second bins in cleaned event files. If a bin has >2000 counts, and if more than 50% of those come from <1% of pixels, then it is considered to be noise-dominated and hence unusable.
| Quadrant | # 1 sec bins | Bins with >0 counts | Bins with >2000 counts | High rate bins dominated by noise | Noise dominated (total time) | Noise dominated (detector-on time) | Marked lightcurve |
|---|---|---|---|---|---|---|---|
| A | 7071 | 5549 | 2 | 2 | 0.03% | 0.04% | 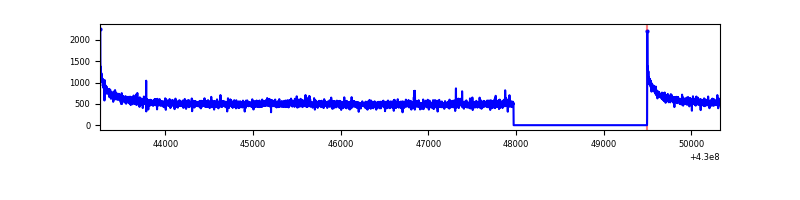 |
| B | 7071 | 5549 | 103 | 103 | 1.46% | 1.86% | 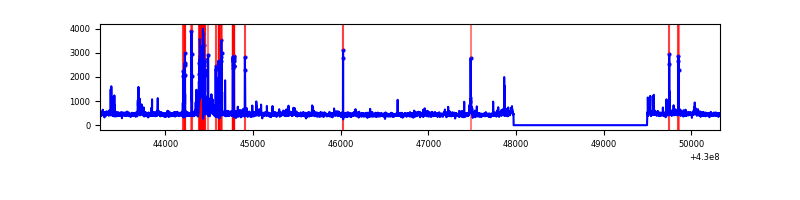 |
| C | 7071 | 5549 | 24 | 24 | 0.34% | 0.43% | 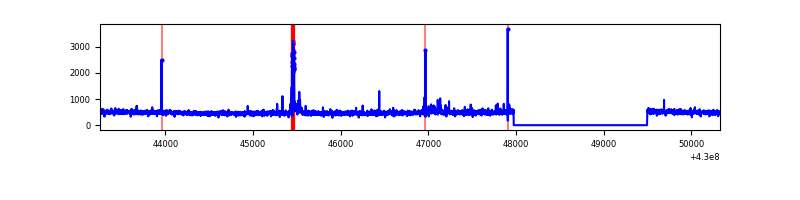 |
| D | 7071 | 5549 | 777 | 777 | 10.99% | 14.00% | 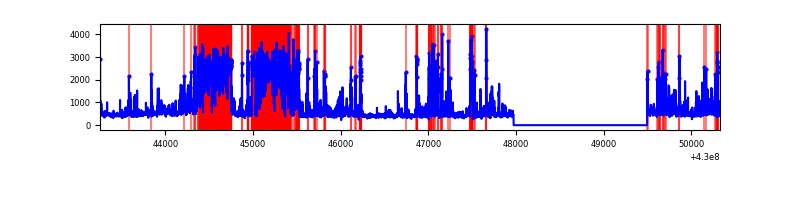 |
Top three noisy pixels from each quadrant. If the there are fewer than three noisy pixels in the level2.evt file, extra rows are filled as -1
| Pixel properties | Quadrant properties | ||||||
|---|---|---|---|---|---|---|---|
| Quadrant | DetID | PixID | Counts | Sigma | Mean | Median | Sigma |
| A | 10 | 83 | 559871 | 4407.44 | 613 | 600 | 126.9 |
| A | 7 | 3 | 13490 | 101.58 | 613 | 600 | 126.9 |
| A | 13 | 254 | 7686 | 55.84 | 613 | 600 | 126.9 |
| B | 10 | 246 | 240880 | 2062.65 | 600 | 583 | 116.5 |
| B | 0 | 229 | 189126 | 1618.41 | 600 | 583 | 116.5 |
| B | 3 | 112 | 38701 | 327.2 | 600 | 583 | 116.5 |
| C | 15 | 214 | 230808 | 1635.81 | 601 | 604 | 140.7 |
| C | 14 | 254 | 86968 | 613.69 | 601 | 604 | 140.7 |
| C | 15 | 111 | 36370 | 254.15 | 601 | 604 | 140.7 |
| D | 12 | 233 | 1924987 | 13937.15 | 563 | 548 | 138.1 |
| D | 12 | 6 | 214424 | 1548.93 | 563 | 548 | 138.1 |
| D | 2 | 249 | 203462 | 1469.54 | 563 | 548 | 138.1 |
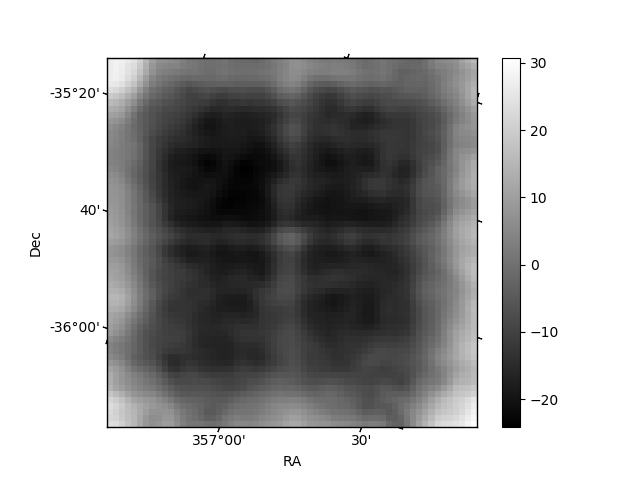
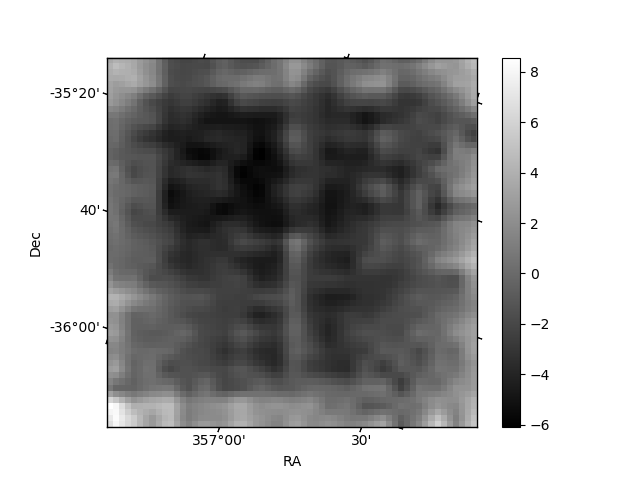
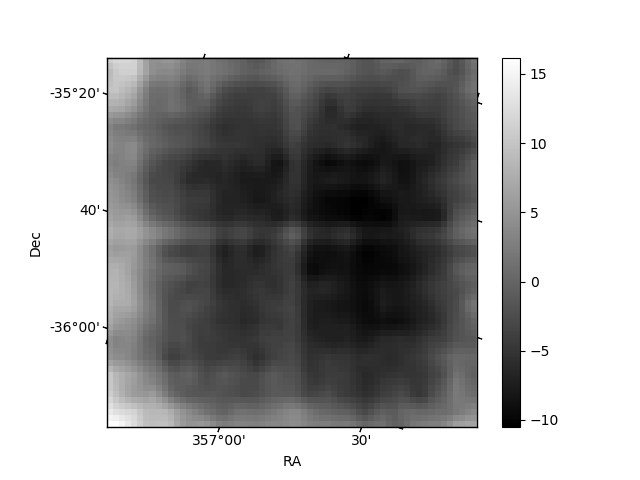
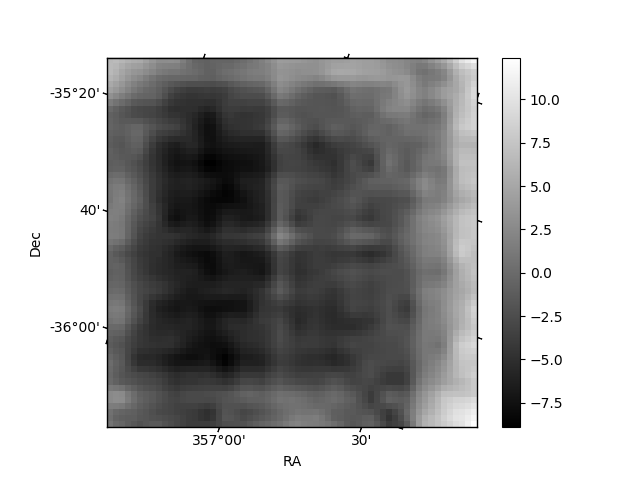
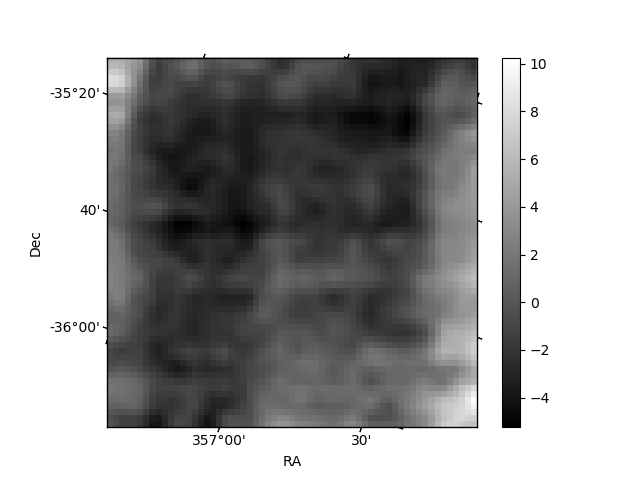
Histogram calculated using DETX and DETY for each event in the final _common_clean file
| Quadrant A | 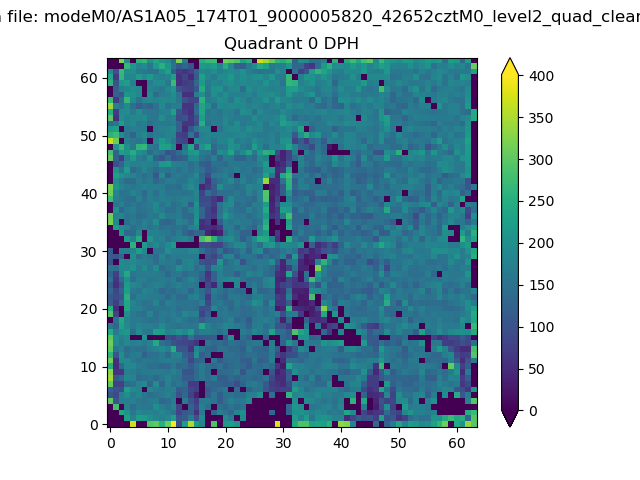 |
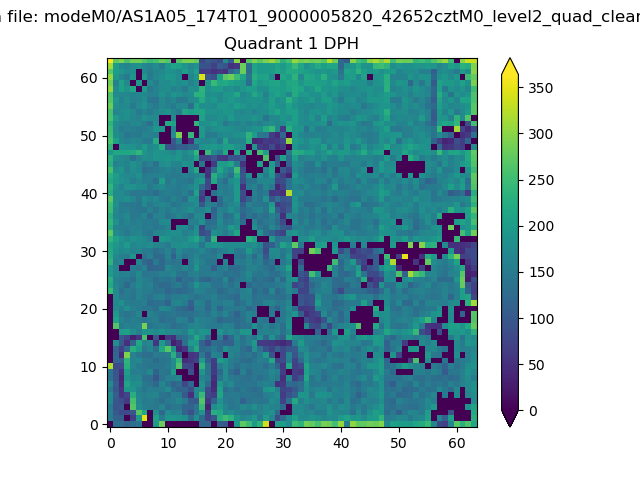 |
Quadrant B |
|---|---|---|---|
| Quadrant D | 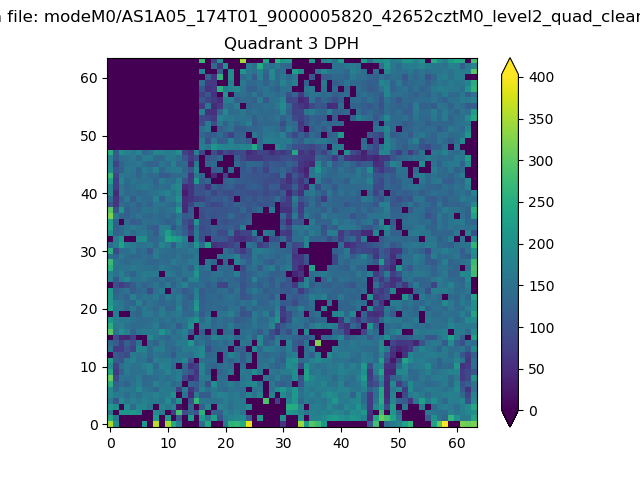 |
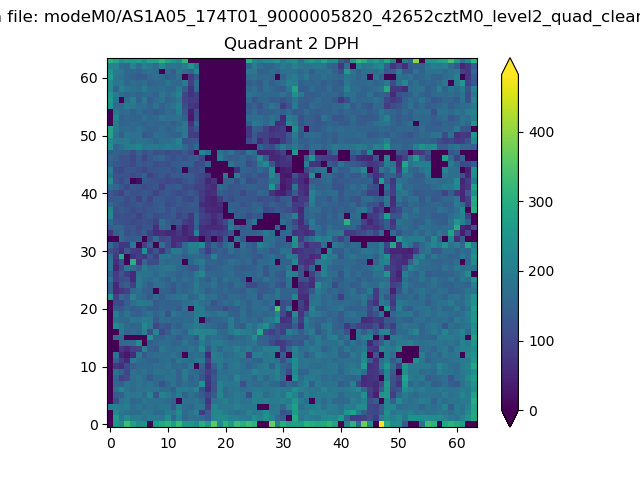 |
Quadrant C |
| Plot type | Count rate plots | Images |
|---|---|---|
| Comparison with Poisson distribution Blue bars denote a histogram of data divided into 1 sec bins. Red curve is a Poisson curve with rate = median count rate of data. |
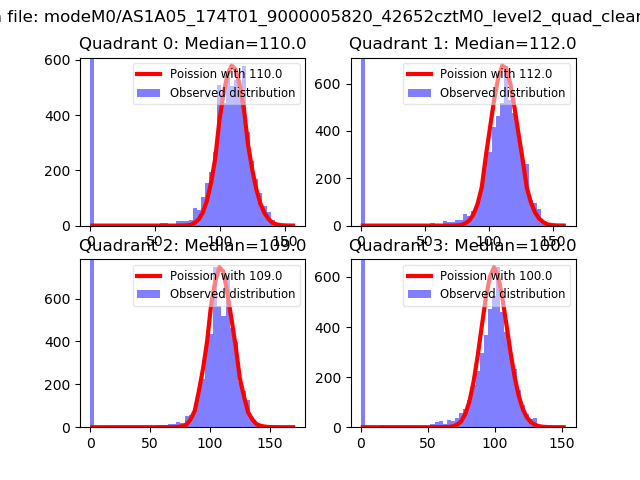 |
 |
| Quadrant-wise count rates Data is divided into 100 sec bins |
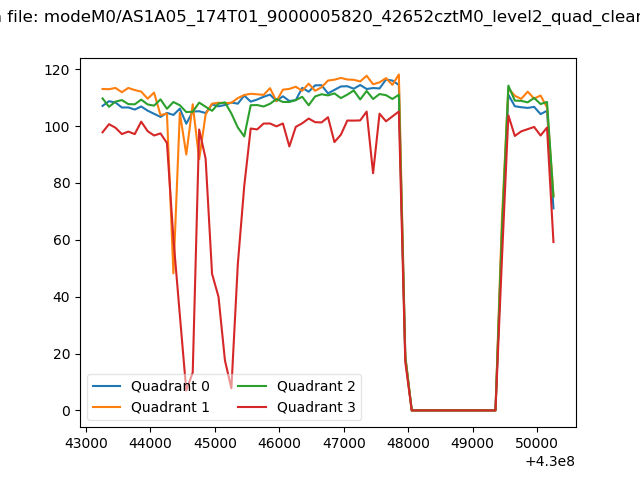 |
|
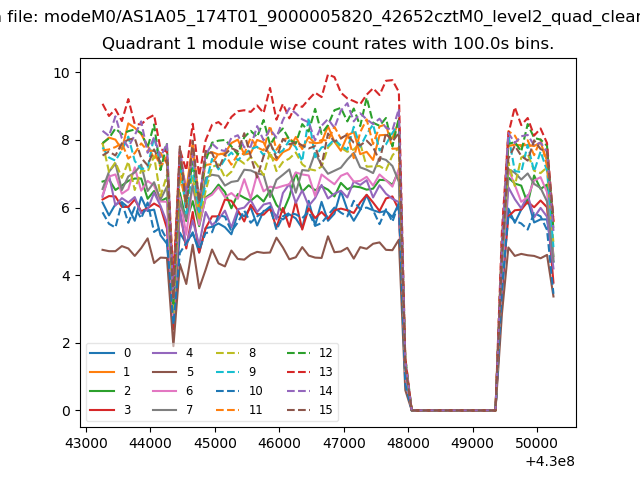
| Module-wise count rates for Quadrant A Data is divided into 100 sec bins |
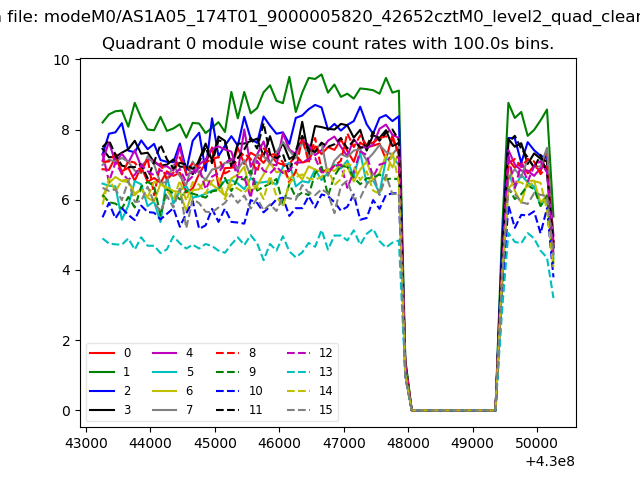 |
 |
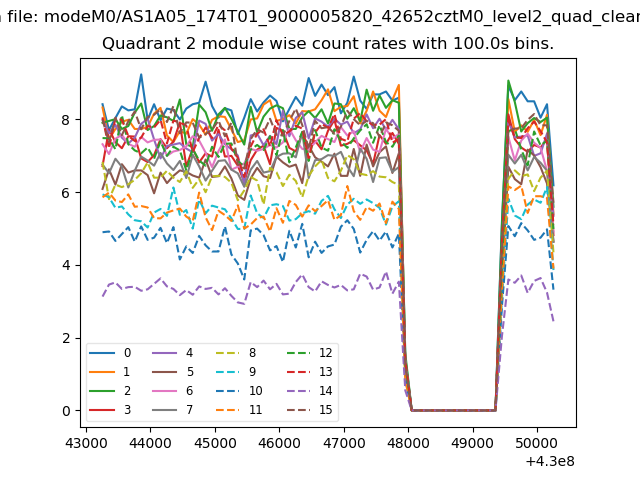
| Module-wise count rates for Quadrant B Data is divided into 100 sec bins |
 |
 |
| Module-wise count rates for Quadrant C Data is divided into 100 sec bins |
 |
 |
| Module-wise count rates for Quadrant D Data is divided into 100 sec bins |
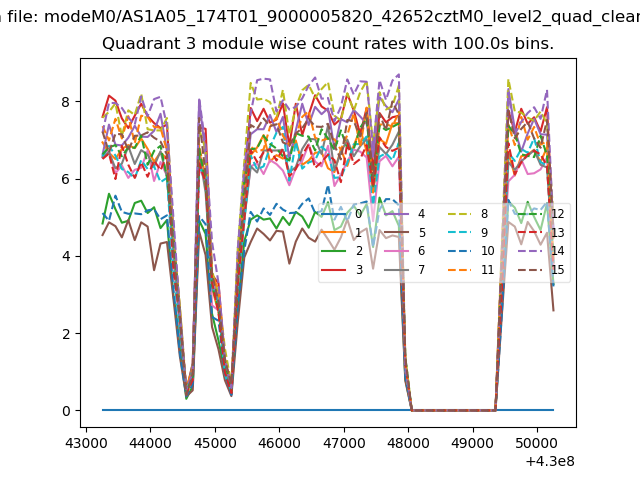 |
 |
| Parameter | Plot |
|---|---|
| CZT HV Monitor | 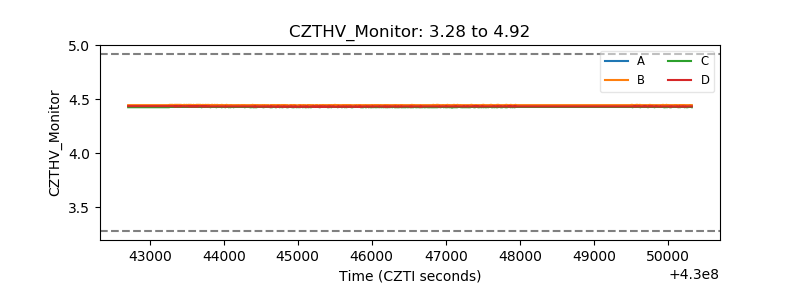 |
| D_VDD | 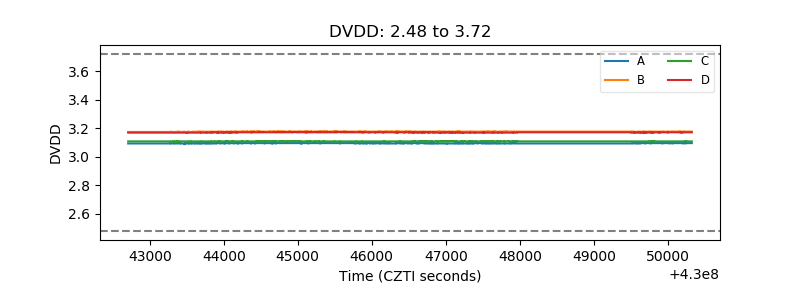 |
| Temperature 1 | 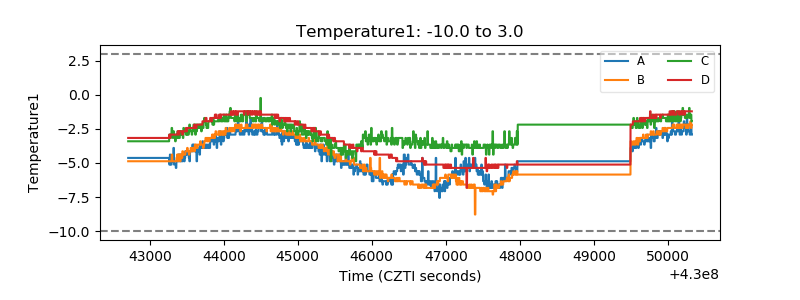 |
| Veto HV Monitor | 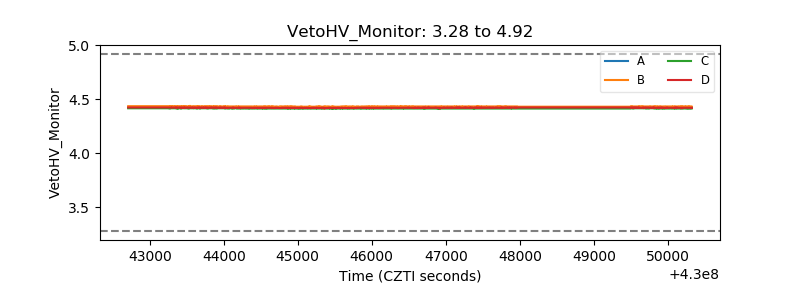 |
| Veto LLD | 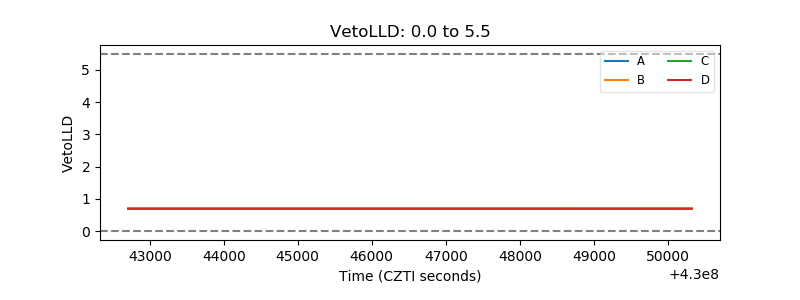 |
| Alpha Counter | 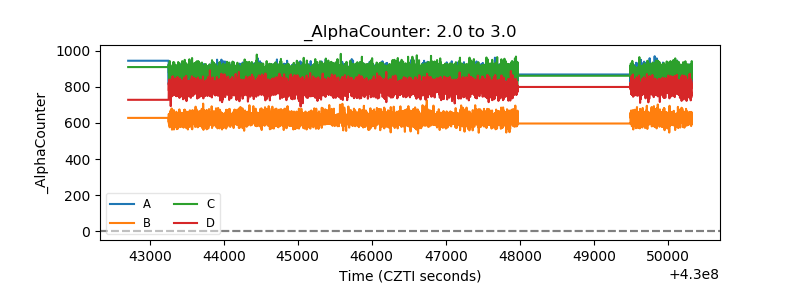 |
| _CPM_Rate | 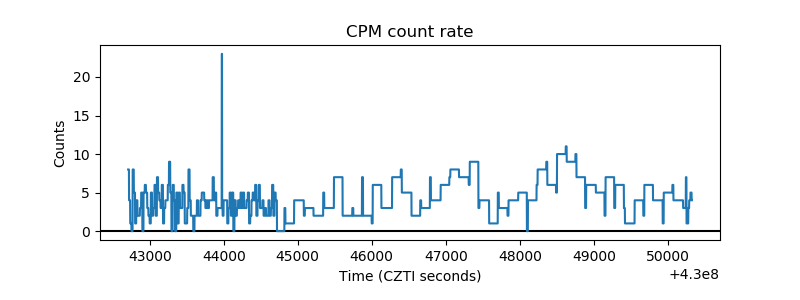 |
| CZT Counter | 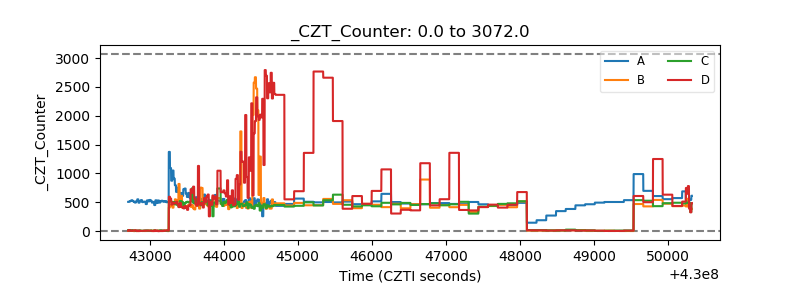 |
| +2.5 Volts monitor | 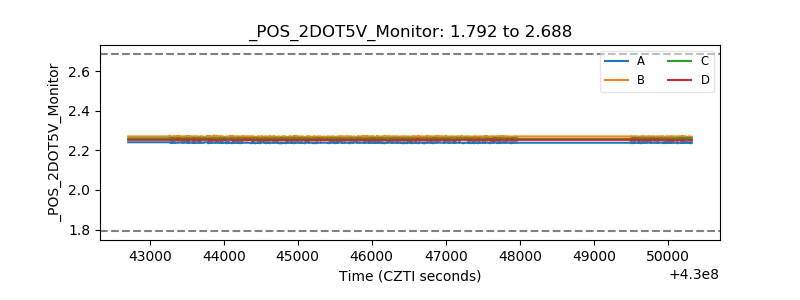 |
| +5 Volts monitor | 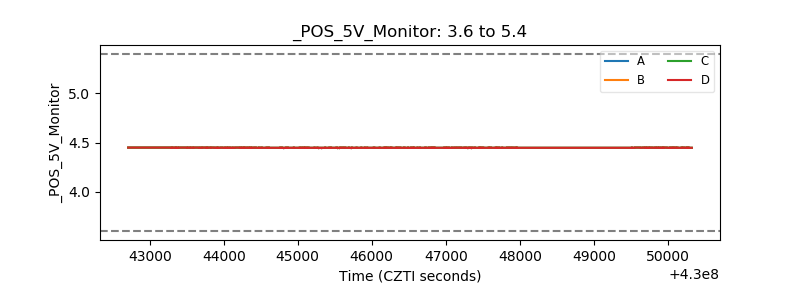 |
| _ROLL_ROT | 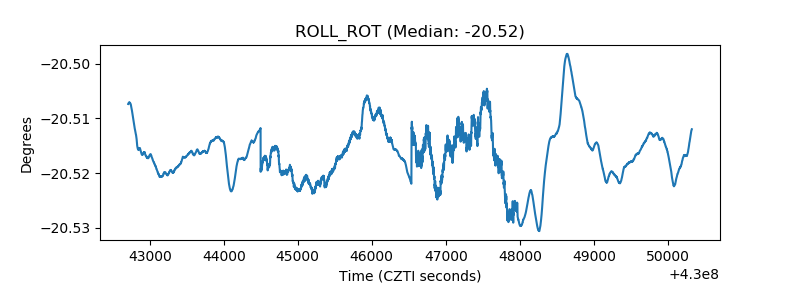 |
| _Roll_DEC | 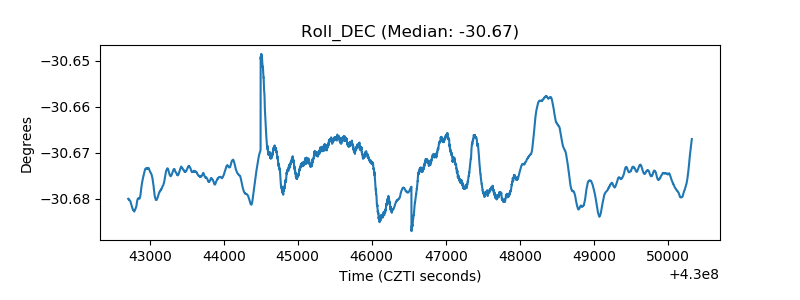 |
| _Roll_RA | 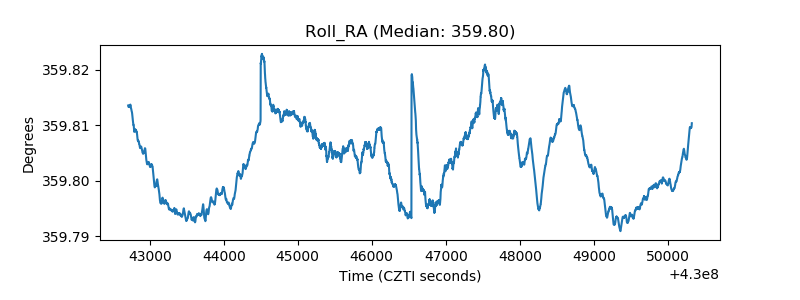 |
| Veto Counter | 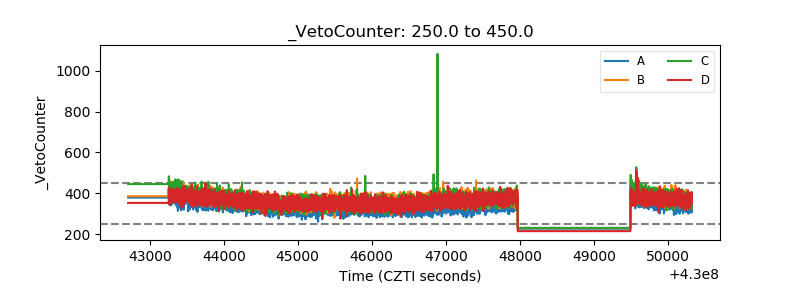 |