| Param | Original file | Final file |
|---|---|---|
| Filename | modeM0/AS1A05_174T01_9000005820_42653cztM0_level2.fits | modeM0/AS1A05_174T01_9000005820_42653cztM0_level2_quad_clean.evt |
| Size (bytes) | 422,933,760 | 95,117,760 |
| Size | 403.3 MB | 90.7 MB |
| Events in quadrant A | 3,395,154 | 654,153 |
| Events in quadrant B | 3,045,155 | 659,829 |
| Events in quadrant C | 2,885,677 | 650,579 |
| Events in quadrant D | 5,856,150 | 490,345 |
| Mode M9 | |||
|---|---|---|---|
| Quadrant | BADHDUFLAG | Total packets | Discarded packets |
| A | 0 | 25 | 0 |
| B | 0 | 26 | 0 |
| C | 0 | 26 | 0 |
| D | 0 | 26 | 0 |
| Mode SS | |||
|---|---|---|---|
| Quadrant | BADHDUFLAG | Total packets | Discarded packets |
| A | 0 | 126 | 0 |
| B | 0 | 126 | 0 |
| C | 0 | 126 | 0 |
| D | 0 | 126 | 0 |
| Mode M0 | |||
|---|---|---|---|
| Quadrant | BADHDUFLAG | Total packets | Discarded packets |
| A | 0 | 13738 | 2 |
| B | 0 | 13176 | 2 |
| C | 0 | 12309 | 2 |
| D | 0 | 21584 | 2 |
| Quadrant | Total seconds | Saturated seconds | Saturation percentage |
|---|---|---|---|
| A | 6081 | 32 | 0.526229% |
| B | 6081 | 112 | 1.841802% |
| C | 6080 | 3 | 0.049342% |
| D | 6080 | 1226 | 20.164474% |
Noise dominated data is calculated using 1-second bins in cleaned event files. If a bin has >2000 counts, and if more than 50% of those come from <1% of pixels, then it is considered to be noise-dominated and hence unusable.
| Quadrant | # 1 sec bins | Bins with >0 counts | Bins with >2000 counts | High rate bins dominated by noise | Noise dominated (total time) | Noise dominated (detector-on time) | Marked lightcurve |
|---|---|---|---|---|---|---|---|
| A | 7424 | 6082 | 18 | 18 | 0.24% | 0.30% | 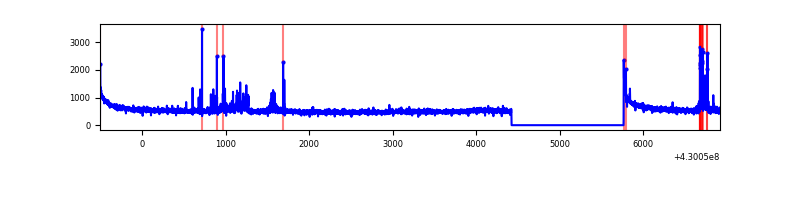 |
| B | 7424 | 6082 | 85 | 85 | 1.14% | 1.40% | 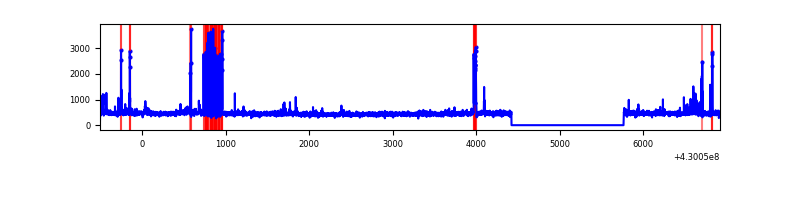 |
| C | 7423 | 6081 | 1 | 1 | 0.01% | 0.02% | 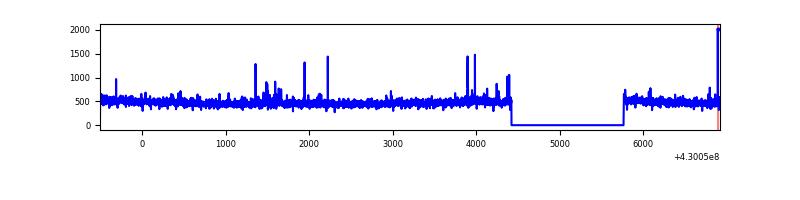 |
| D | 7423 | 6081 | 1140 | 1140 | 15.36% | 18.75% | 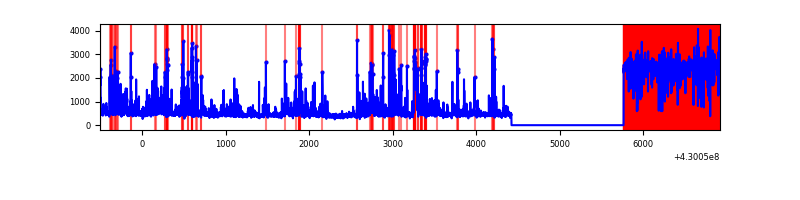 |
Top three noisy pixels from each quadrant. If the there are fewer than three noisy pixels in the level2.evt file, extra rows are filled as -1
| Pixel properties | Quadrant properties | ||||||
|---|---|---|---|---|---|---|---|
| Quadrant | DetID | PixID | Counts | Sigma | Mean | Median | Sigma |
| A | 10 | 83 | 617973 | 4418.48 | 670 | 654 | 139.7 |
| A | 13 | 248 | 172093 | 1227.08 | 670 | 654 | 139.7 |
| A | 2 | 79 | 10614 | 71.29 | 670 | 654 | 139.7 |
| B | 0 | 229 | 235632 | 1827.29 | 660 | 641 | 128.6 |
| B | 10 | 246 | 144540 | 1118.96 | 660 | 641 | 128.6 |
| B | 0 | 245 | 44944 | 344.5 | 660 | 641 | 128.6 |
| C | 15 | 214 | 249907 | 1621.68 | 658 | 663 | 153.7 |
| C | 14 | 254 | 36559 | 233.55 | 658 | 663 | 153.7 |
| C | 3 | 233 | 13622 | 84.32 | 658 | 663 | 153.7 |
| D | 12 | 233 | 2542513 | 17632.33 | 578 | 559 | 144.2 |
| D | 12 | 6 | 283781 | 1964.57 | 578 | 559 | 144.2 |
| D | 1 | 52 | 277636 | 1921.95 | 578 | 559 | 144.2 |
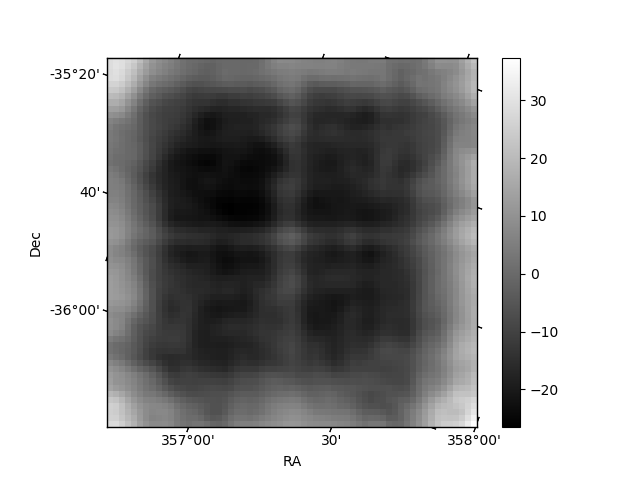
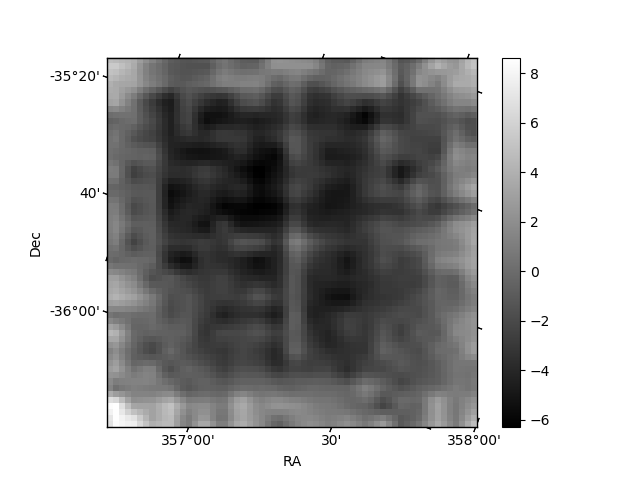
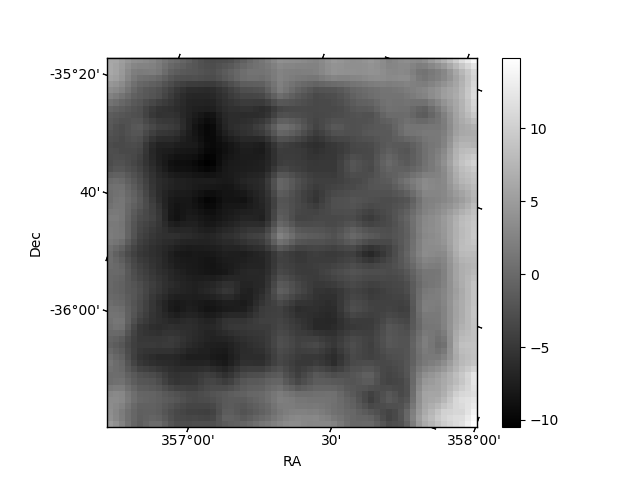
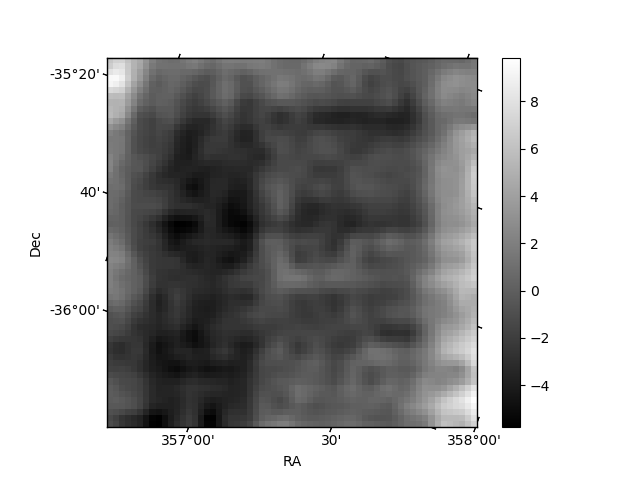
Histogram calculated using DETX and DETY for each event in the final _common_clean file
| Quadrant A | 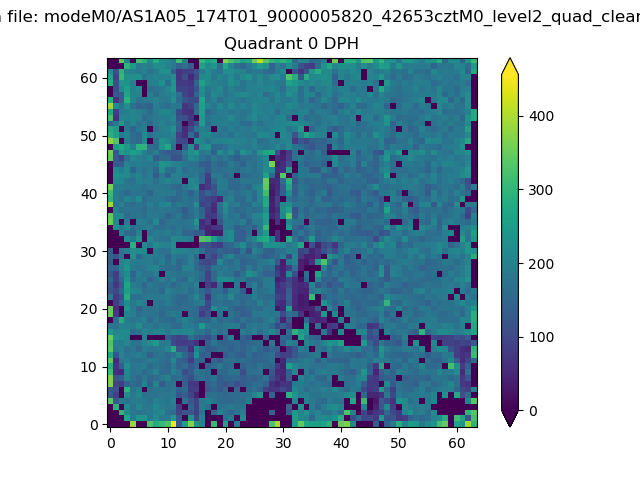 |
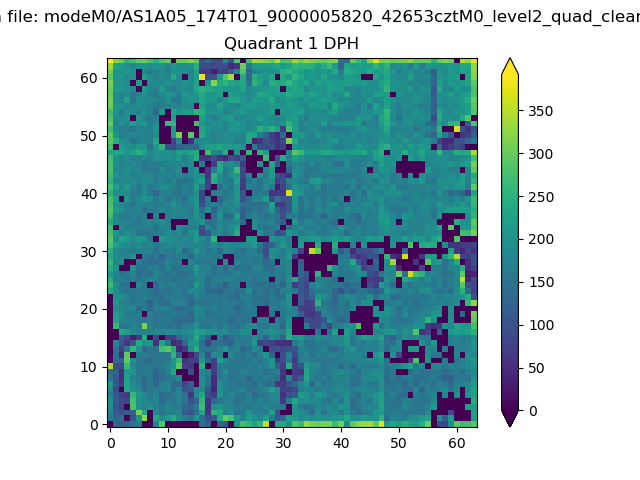 |
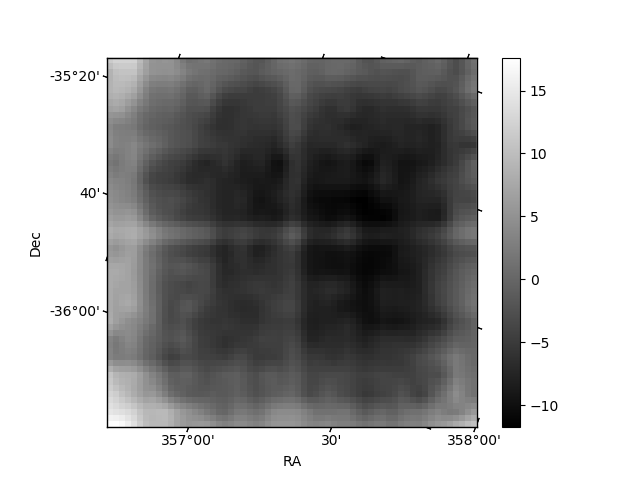
Quadrant B |
|---|---|---|---|
| Quadrant D | 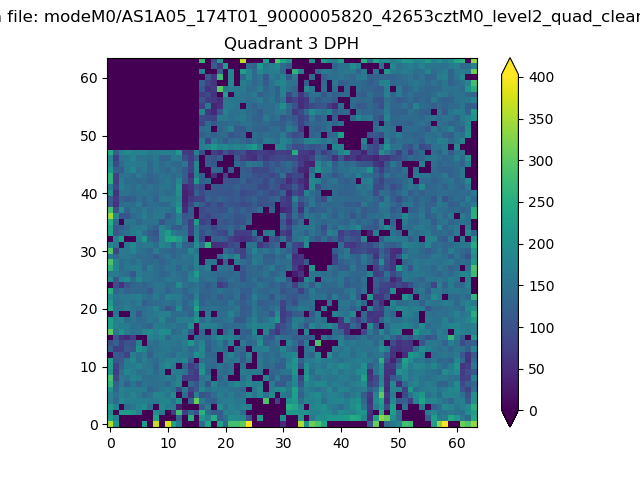 |
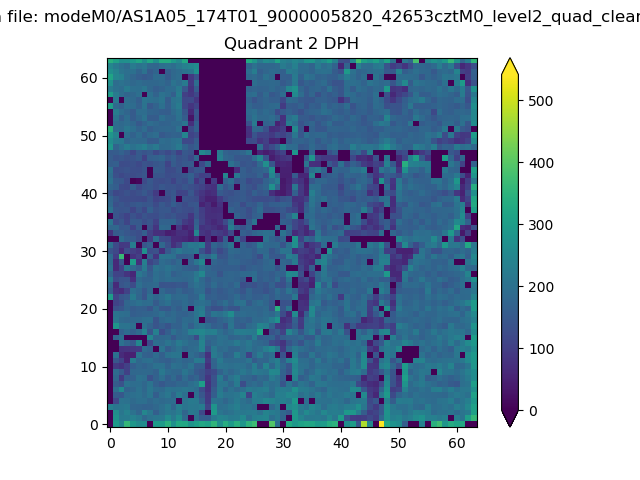 |
Quadrant C |
| Plot type | Count rate plots | Images |
|---|---|---|
| Comparison with Poisson distribution Blue bars denote a histogram of data divided into 1 sec bins. Red curve is a Poisson curve with rate = median count rate of data. |
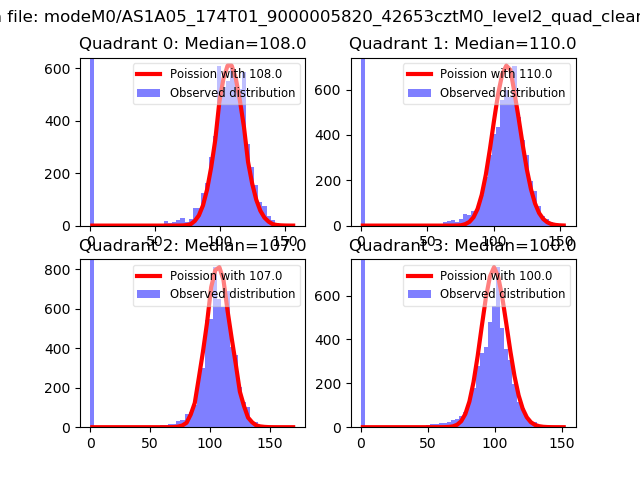 |
 |
| Quadrant-wise count rates Data is divided into 100 sec bins |
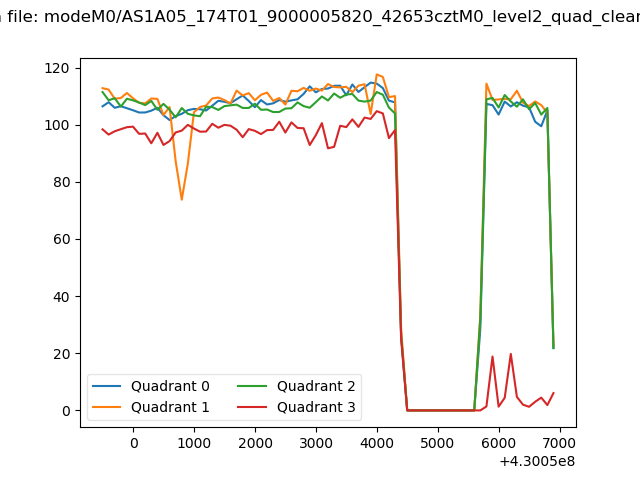 |
|
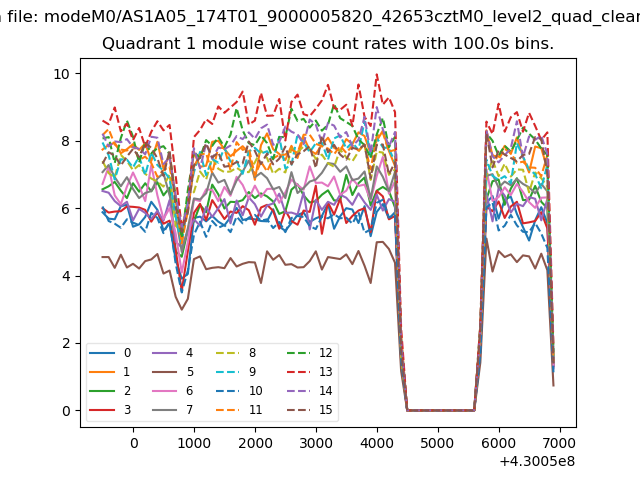
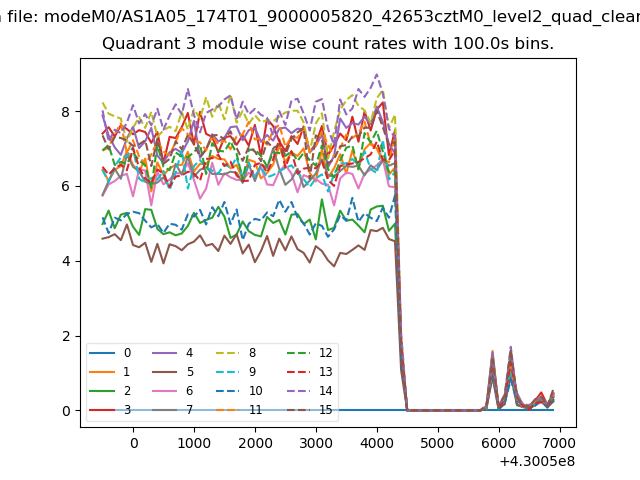
| Module-wise count rates for Quadrant A Data is divided into 100 sec bins |
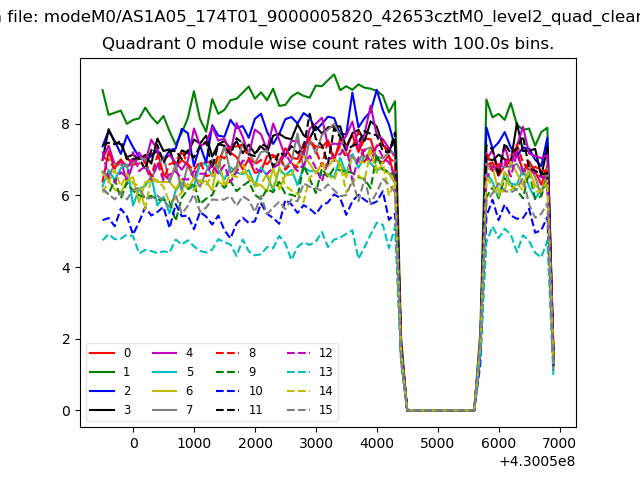 |
 |
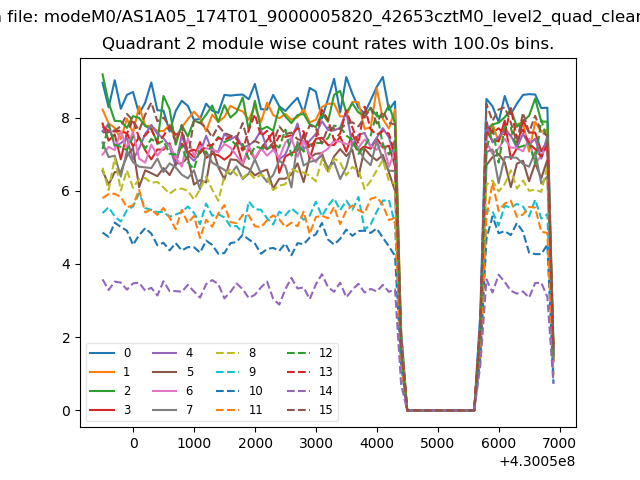
| Module-wise count rates for Quadrant B Data is divided into 100 sec bins |
 |
 |
| Module-wise count rates for Quadrant C Data is divided into 100 sec bins |
 |
 |
| Module-wise count rates for Quadrant D Data is divided into 100 sec bins |
 |
 |
| Parameter | Plot |
|---|---|
| CZT HV Monitor | 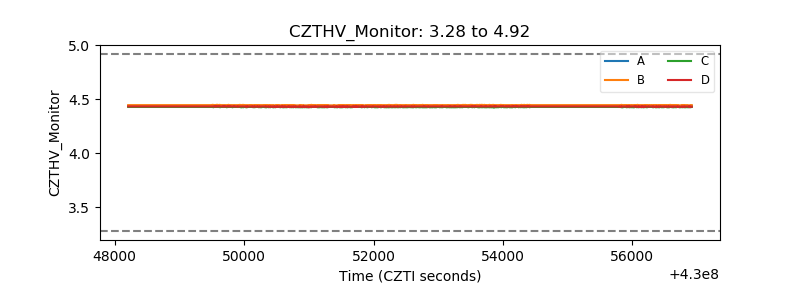 |
| D_VDD | 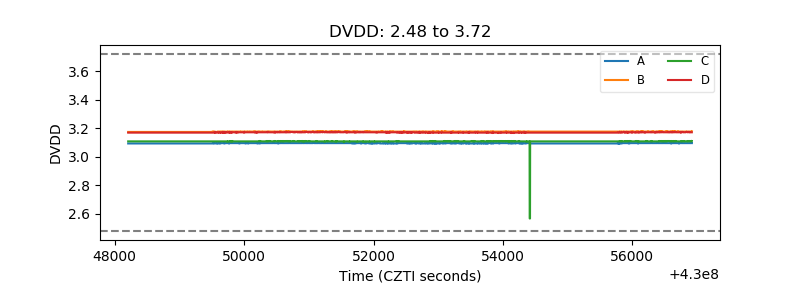 |
| Temperature 1 | 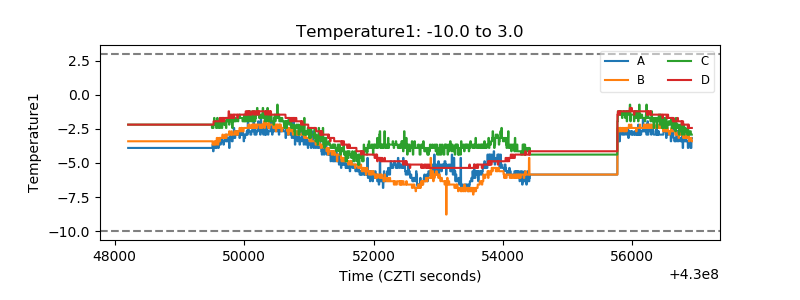 |
| Veto HV Monitor | 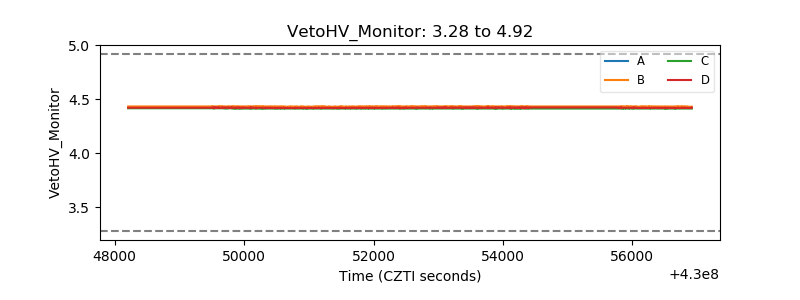 |
| Veto LLD | 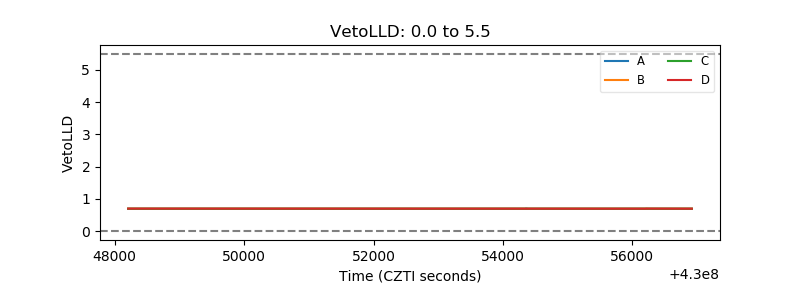 |
| Alpha Counter | 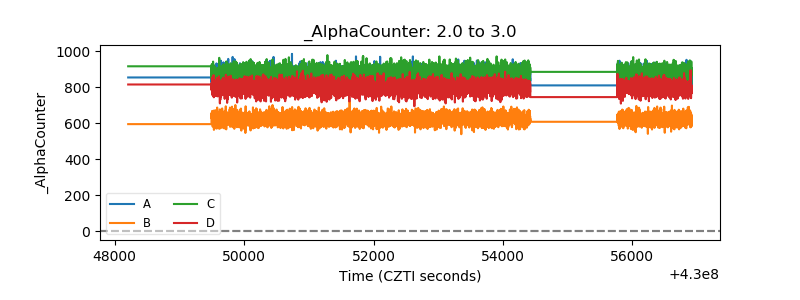 |
| _CPM_Rate | 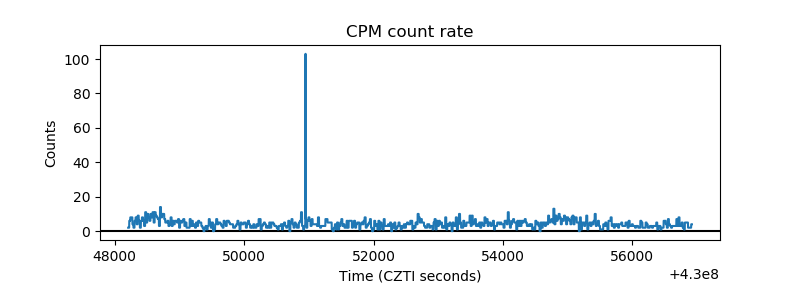 |
| CZT Counter | 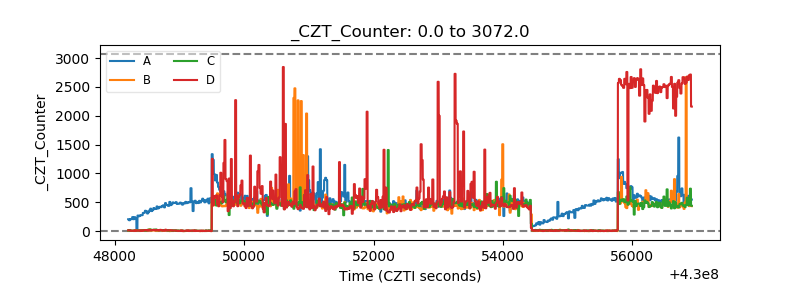 |
| +2.5 Volts monitor | 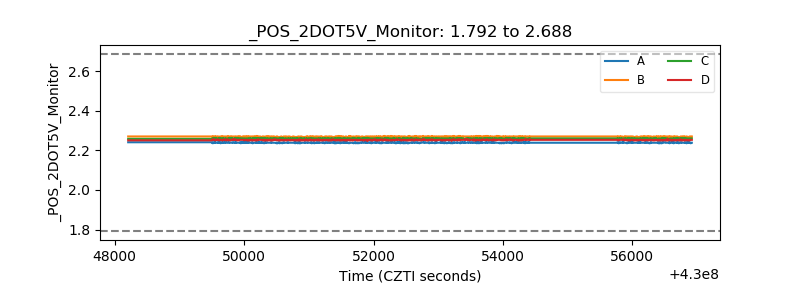 |
| +5 Volts monitor | 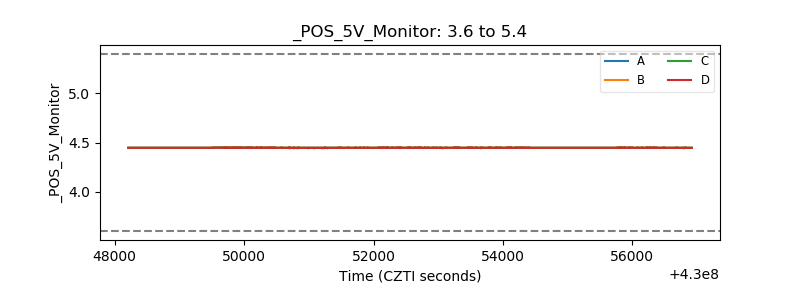 |
| _ROLL_ROT | 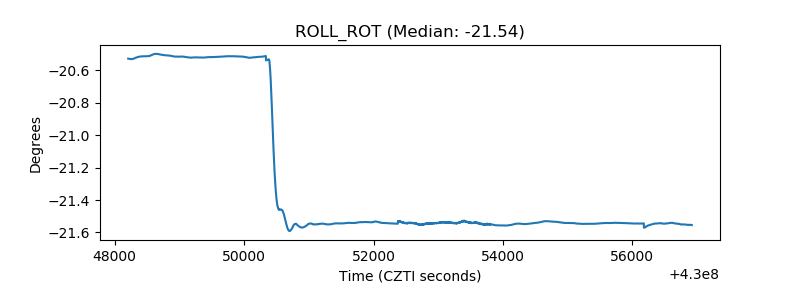 |
| _Roll_DEC | 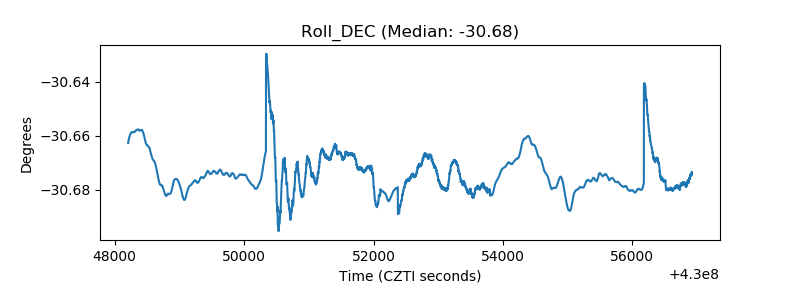 |
| _Roll_RA | 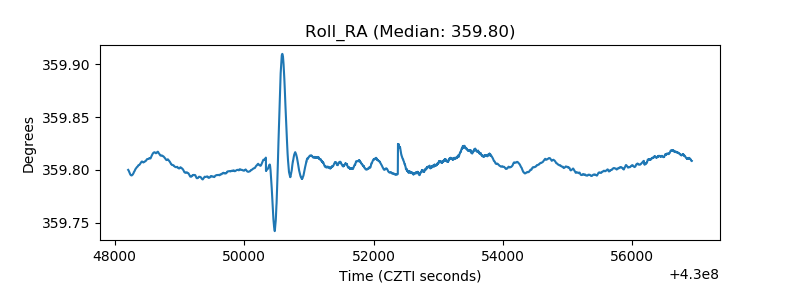 |
| Veto Counter | 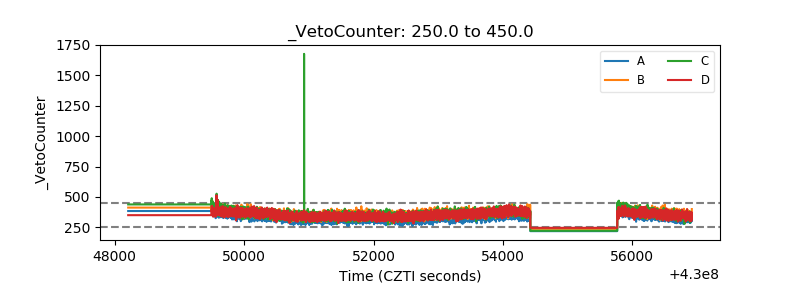 |