| Param | Original file | Final file |
|---|---|---|
| Filename | modeM0/AS1A05_174T01_9000005820_42656cztM0_level2.fits | modeM0/AS1A05_174T01_9000005820_42656cztM0_level2_quad_clean.evt |
| Size (bytes) | 780,045,120 | 166,331,520 |
| Size | 743.9 MB | 158.6 MB |
| Events in quadrant A | 6,041,376 | 1,154,366 |
| Events in quadrant B | 5,743,616 | 1,167,022 |
| Events in quadrant C | 5,125,677 | 1,144,287 |
| Events in quadrant D | 11,129,705 | 825,140 |
| Mode M9 | |||
|---|---|---|---|
| Quadrant | BADHDUFLAG | Total packets | Discarded packets |
| A | 0 | 34 | 0 |
| B | 0 | 35 | 0 |
| C | 0 | 35 | 0 |
| D | 0 | 35 | 0 |
| Mode SS | |||
|---|---|---|---|
| Quadrant | BADHDUFLAG | Total packets | Discarded packets |
| A | 0 | 220 | 0 |
| B | 0 | 220 | 0 |
| C | 0 | 220 | 0 |
| D | 0 | 220 | 0 |
| Mode M0 | |||
|---|---|---|---|
| Quadrant | BADHDUFLAG | Total packets | Discarded packets |
| A | 0 | 24568 | 3 |
| B | 0 | 24507 | 3 |
| C | 0 | 21943 | 3 |
| D | 0 | 40494 | 3 |
| Quadrant | Total seconds | Saturated seconds | Saturation percentage |
|---|---|---|---|
| A | 10759 | 90 | 0.836509% |
| B | 10759 | 203 | 1.886792% |
| C | 10759 | 17 | 0.158007% |
| D | 10759 | 2345 | 21.795706% |
Noise dominated data is calculated using 1-second bins in cleaned event files. If a bin has >2000 counts, and if more than 50% of those come from <1% of pixels, then it is considered to be noise-dominated and hence unusable.
| Quadrant | # 1 sec bins | Bins with >0 counts | Bins with >2000 counts | High rate bins dominated by noise | Noise dominated (total time) | Noise dominated (detector-on time) | Marked lightcurve |
|---|---|---|---|---|---|---|---|
| A | 13385 | 10761 | 45 | 45 | 0.34% | 0.42% | 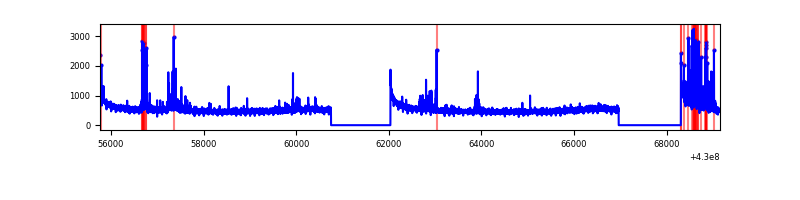 |
| B | 13385 | 10761 | 130 | 130 | 0.97% | 1.21% | 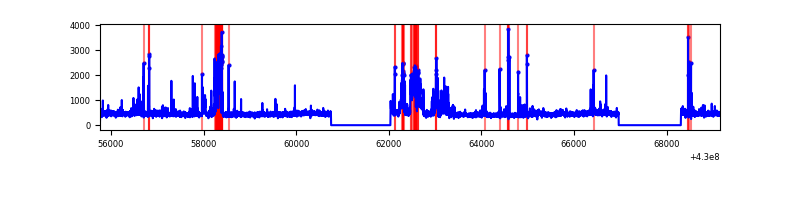 |
| C | 13385 | 10761 | 14 | 14 | 0.10% | 0.13% | 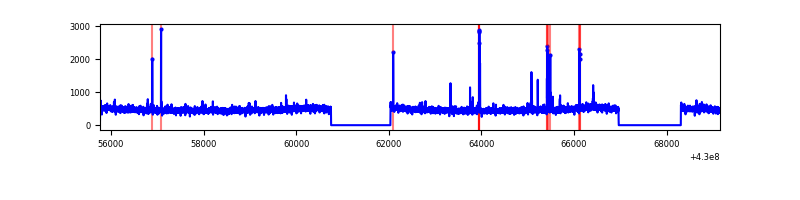 |
| D | 13385 | 10761 | 2175 | 2175 | 16.25% | 20.21% | 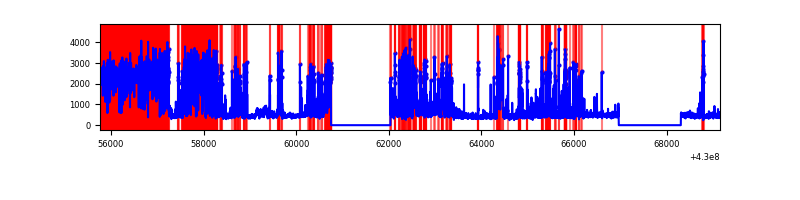 |
Top three noisy pixels from each quadrant. If the there are fewer than three noisy pixels in the level2.evt file, extra rows are filled as -1
| Pixel properties | Quadrant properties | ||||||
|---|---|---|---|---|---|---|---|
| Quadrant | DetID | PixID | Counts | Sigma | Mean | Median | Sigma |
| A | 10 | 83 | 1012975 | 4171.04 | 1176 | 1147 | 242.6 |
| A | 13 | 248 | 419301 | 1723.75 | 1176 | 1147 | 242.6 |
| A | 2 | 79 | 23091 | 90.46 | 1176 | 1147 | 242.6 |
| B | 10 | 246 | 927584 | 4094.07 | 1166 | 1132 | 226.3 |
| B | 0 | 245 | 103783 | 453.62 | 1166 | 1132 | 226.3 |
| B | 3 | 112 | 67760 | 294.43 | 1166 | 1132 | 226.3 |
| C | 15 | 214 | 441151 | 1625.73 | 1160 | 1167 | 270.6 |
| C | 14 | 254 | 91611 | 334.19 | 1160 | 1167 | 270.6 |
| C | 9 | 54 | 39534 | 141.77 | 1160 | 1167 | 270.6 |
| D | 12 | 233 | 5122660 | 20298.23 | 1021 | 990 | 252.3 |
| D | 2 | 249 | 996588 | 3945.76 | 1021 | 990 | 252.3 |
| D | 12 | 6 | 474791 | 1877.77 | 1021 | 990 | 252.3 |
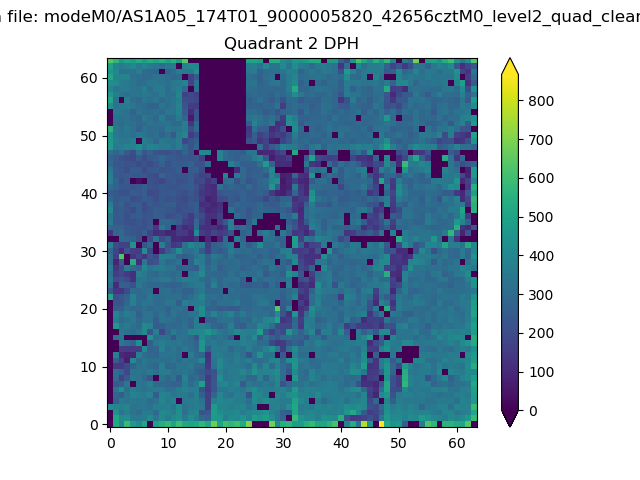
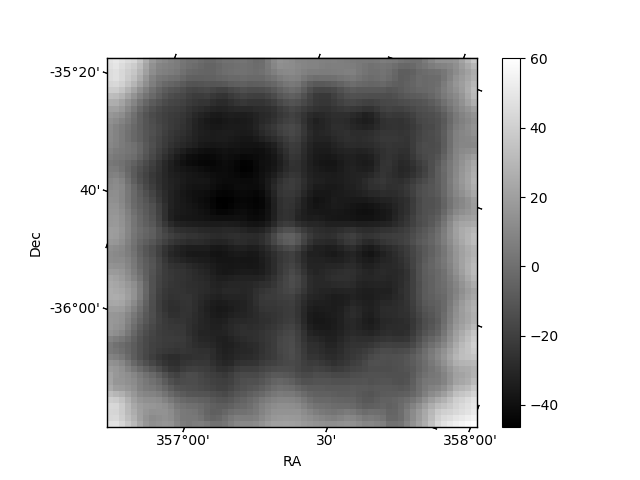
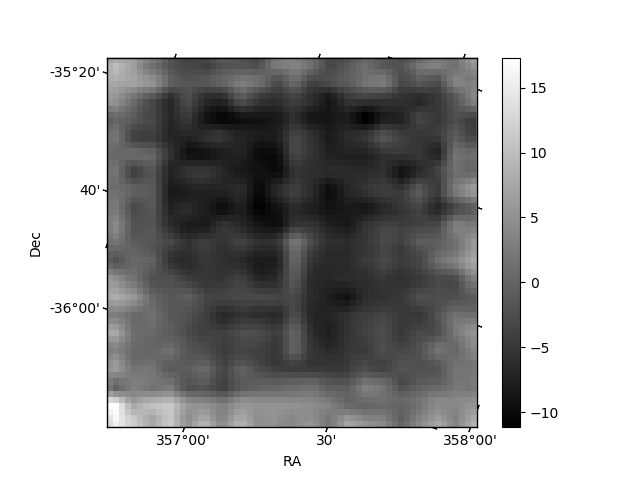
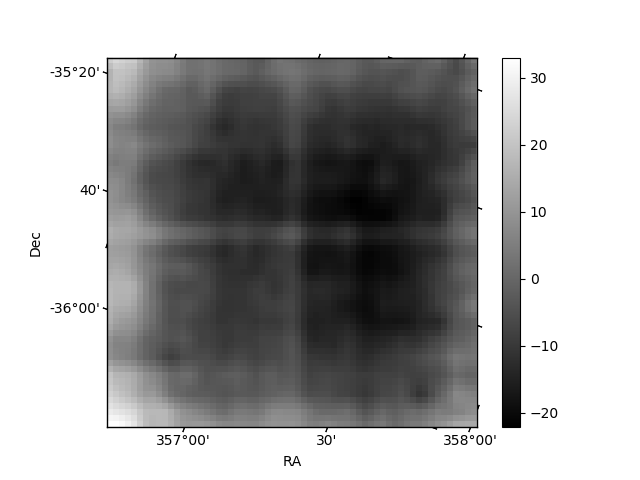
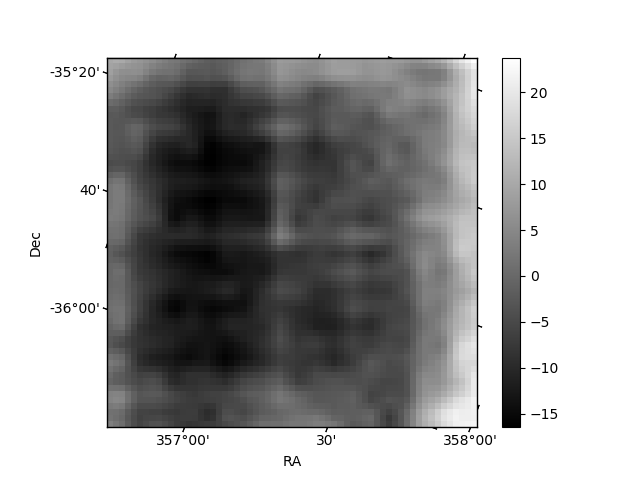
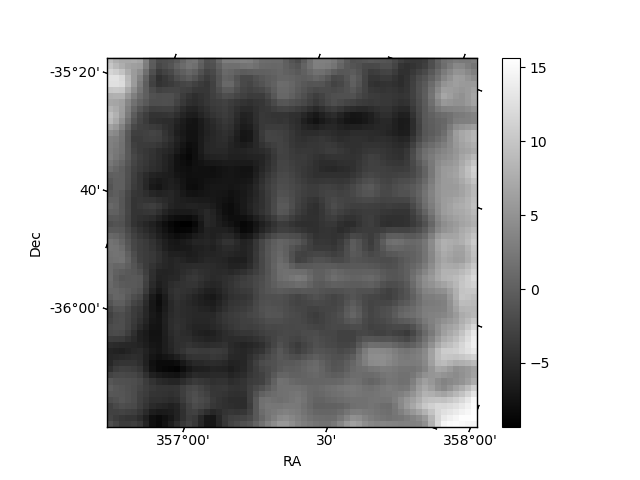
Histogram calculated using DETX and DETY for each event in the final _common_clean file
| Quadrant A | 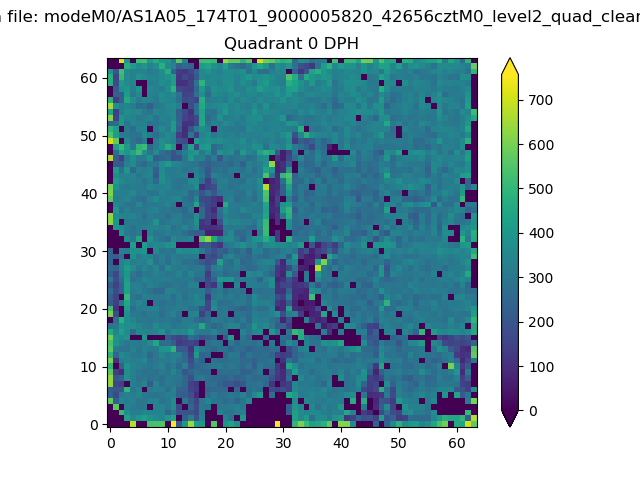 |
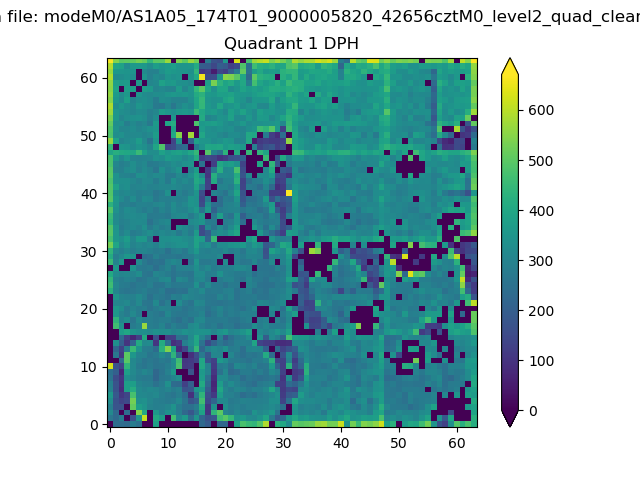 |
Quadrant B |
|---|---|---|---|
| Quadrant D | 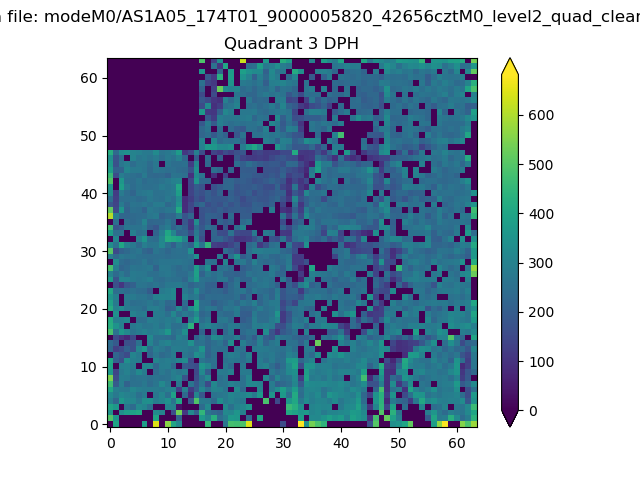 |
 |
Quadrant C |
| Plot type | Count rate plots | Images |
|---|---|---|
| Comparison with Poisson distribution Blue bars denote a histogram of data divided into 1 sec bins. Red curve is a Poisson curve with rate = median count rate of data. |
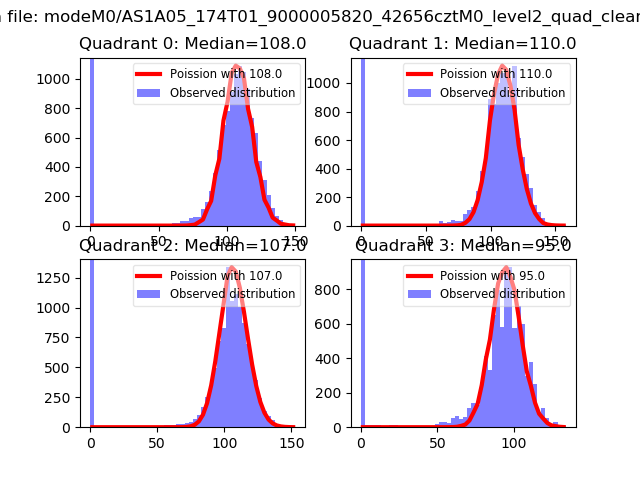 |
 |
| Quadrant-wise count rates Data is divided into 100 sec bins |
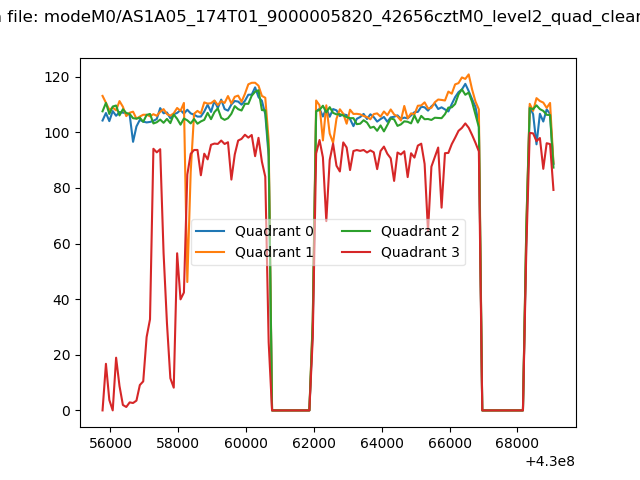 |
|
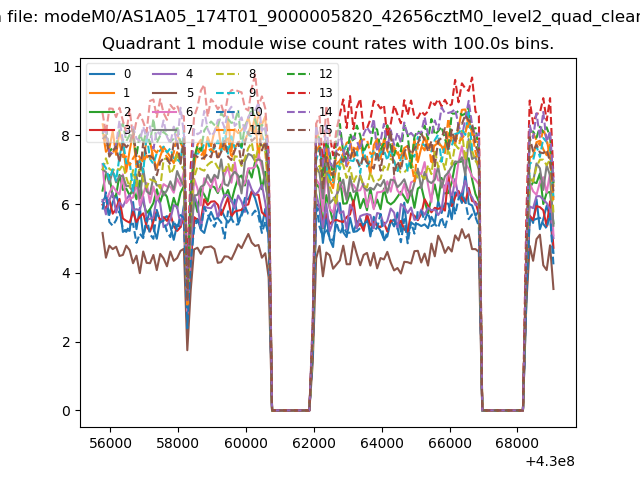
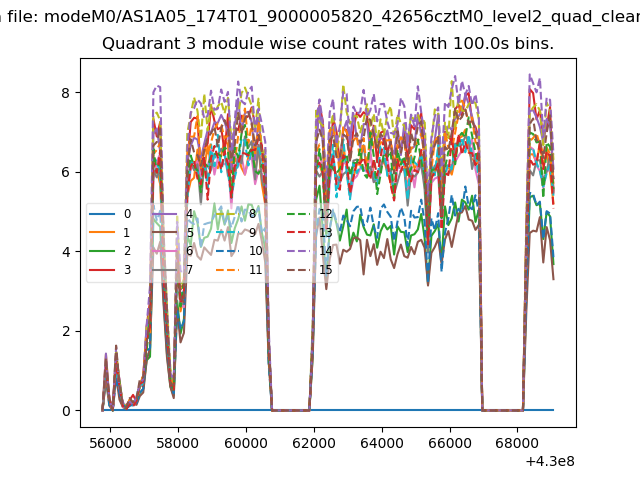
| Module-wise count rates for Quadrant A Data is divided into 100 sec bins |
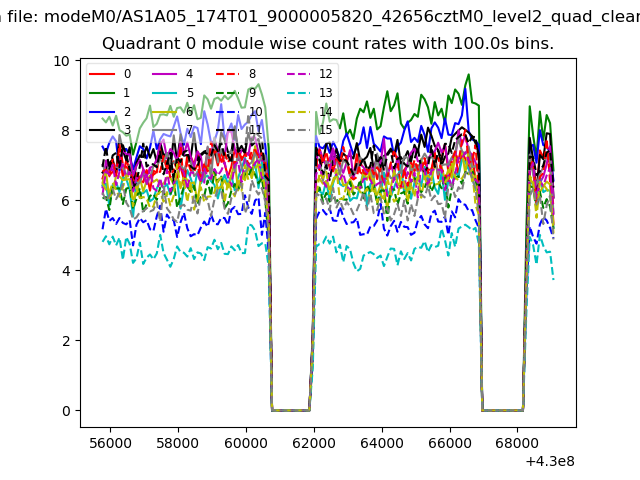 |
 |
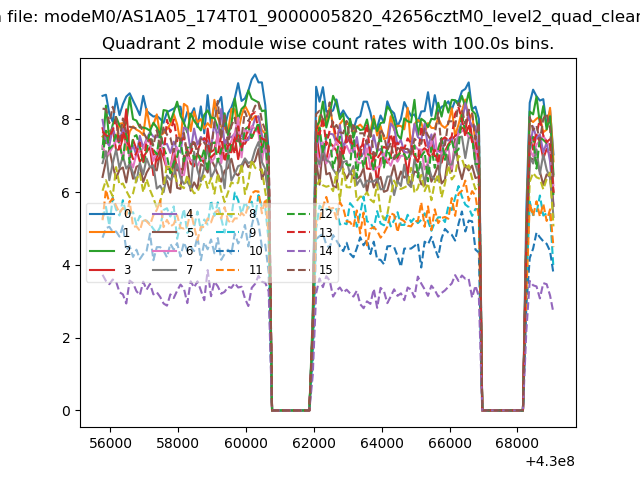
| Module-wise count rates for Quadrant B Data is divided into 100 sec bins |
 |
 |
| Module-wise count rates for Quadrant C Data is divided into 100 sec bins |
 |
 |
| Module-wise count rates for Quadrant D Data is divided into 100 sec bins |
 |
 |
| Parameter | Plot |
|---|---|
| CZT HV Monitor |  |
| D_VDD | 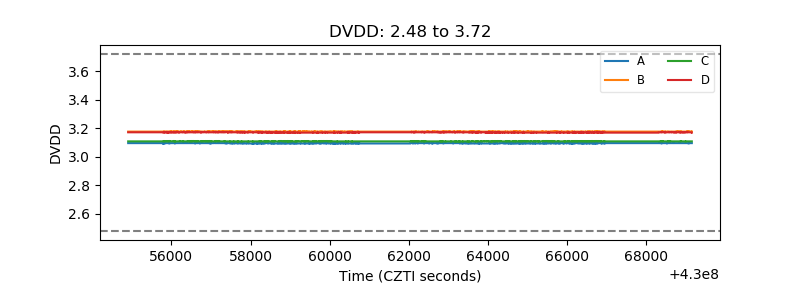 |
| Temperature 1 | 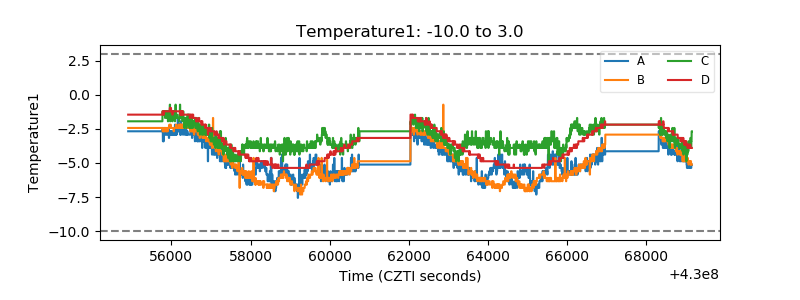 |
| Veto HV Monitor | 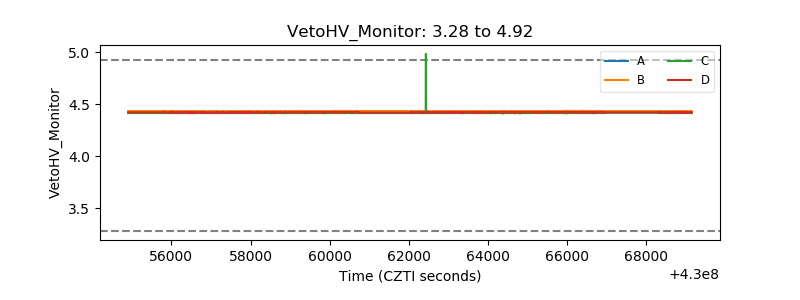 |
| Veto LLD | 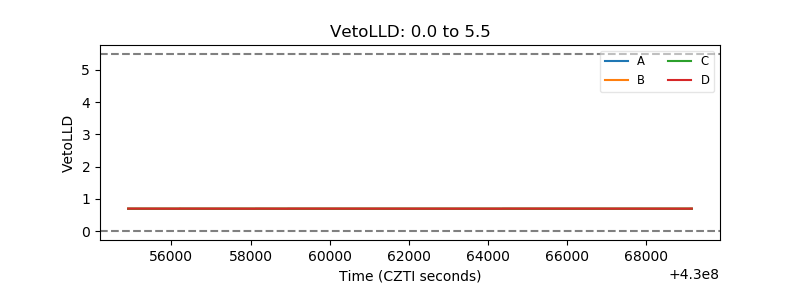 |
| Alpha Counter | 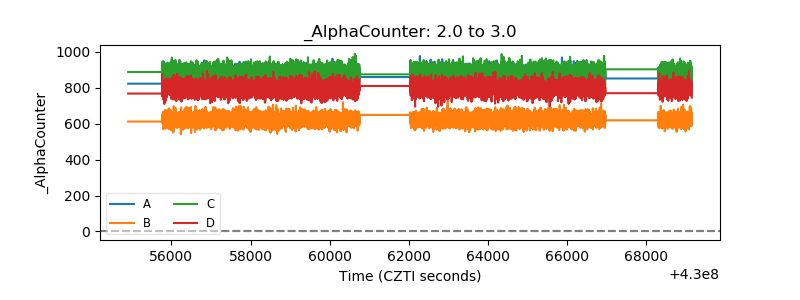 |
| _CPM_Rate | 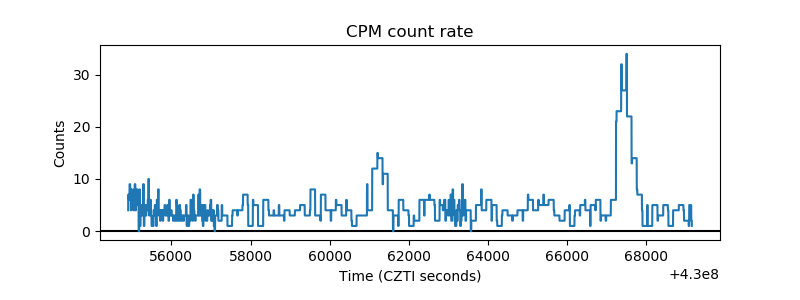 |
| CZT Counter | 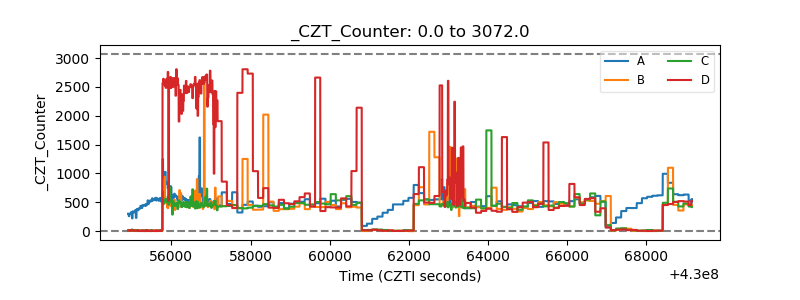 |
| +2.5 Volts monitor | 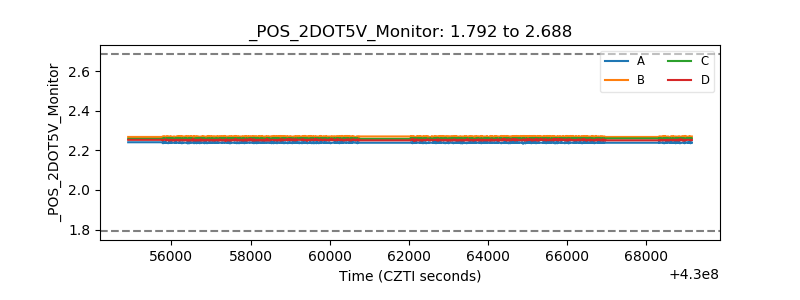 |
| +5 Volts monitor | 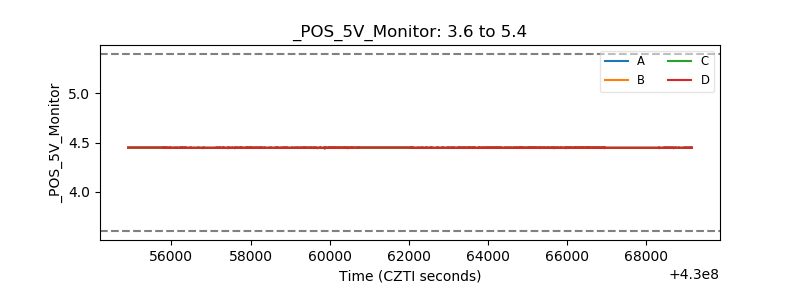 |
| _ROLL_ROT | 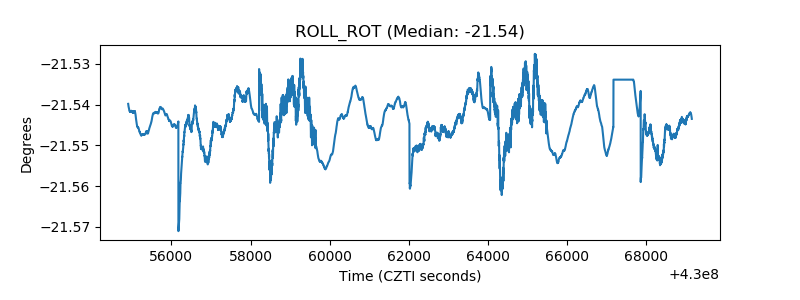 |
| _Roll_DEC | 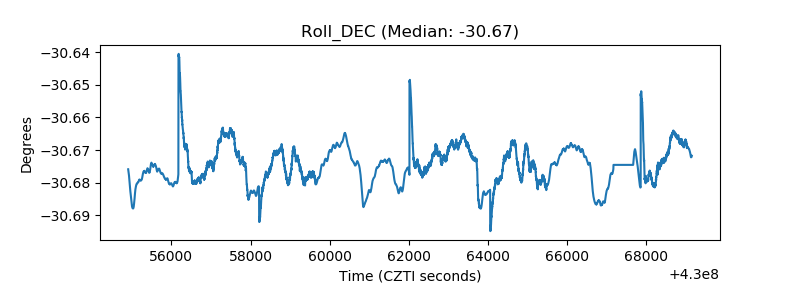 |
| _Roll_RA | 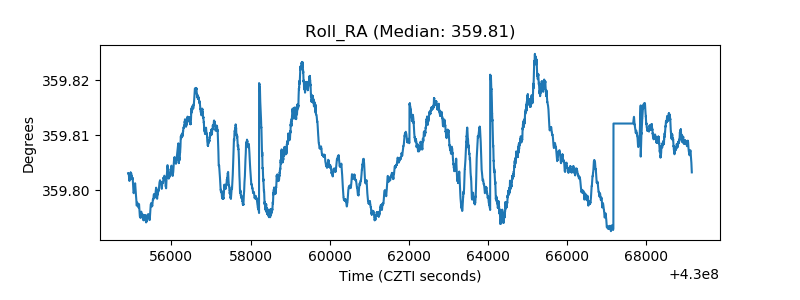 |
| Veto Counter | 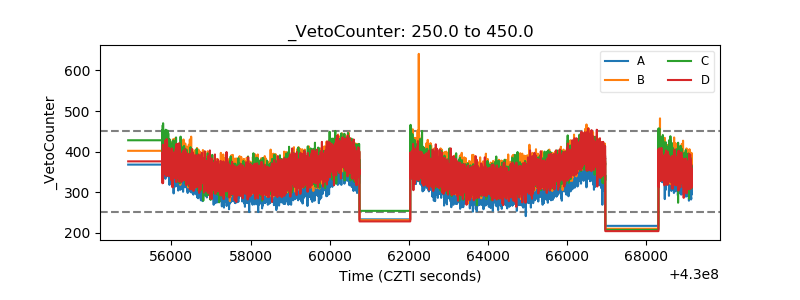 |