| Param | Original file | Final file |
|---|---|---|
| Filename | modeM0/AS1A05_013T01_9000005822_42656cztM0_level2.fits | modeM0/AS1A05_013T01_9000005822_42656cztM0_level2_quad_clean.evt |
| Size (bytes) | 229,095,360 | 62,703,360 |
| Size | 218.5 MB | 59.8 MB |
| Events in quadrant A | 2,014,660 | 422,422 |
| Events in quadrant B | 1,989,281 | 425,282 |
| Events in quadrant C | 1,853,607 | 404,790 |
| Events in quadrant D | 2,323,883 | 375,717 |
| Mode M0 | |||
|---|---|---|---|
| Quadrant | BADHDUFLAG | Total packets | Discarded packets |
| A | 0 | 8209 | 1 |
| B | 0 | 8462 | 1 |
| C | 0 | 7886 | 1 |
| D | 0 | 9604 | 1 |
| Mode M9 | |||
|---|---|---|---|
| Quadrant | BADHDUFLAG | Total packets | Discarded packets |
| A | 0 | 14 | 0 |
| B | 0 | 14 | 0 |
| C | 0 | 14 | 0 |
| D | 0 | 14 | 0 |
| Mode SS | |||
|---|---|---|---|
| Quadrant | BADHDUFLAG | Total packets | Discarded packets |
| A | 0 | 80 | 0 |
| B | 0 | 80 | 0 |
| C | 0 | 80 | 0 |
| D | 0 | 80 | 0 |
| Quadrant | Total seconds | Saturated seconds | Saturation percentage |
|---|---|---|---|
| A | 3821 | 7 | 0.183198% |
| B | 3821 | 54 | 1.413243% |
| C | 3821 | 29 | 0.758964% |
| D | 3821 | 72 | 1.884323% |
Noise dominated data is calculated using 1-second bins in cleaned event files. If a bin has >2000 counts, and if more than 50% of those come from <1% of pixels, then it is considered to be noise-dominated and hence unusable.
| Quadrant | # 1 sec bins | Bins with >0 counts | Bins with >2000 counts | High rate bins dominated by noise | Noise dominated (total time) | Noise dominated (detector-on time) | Marked lightcurve |
|---|---|---|---|---|---|---|---|
| A | 5284 | 3822 | 3 | 3 | 0.06% | 0.08% | 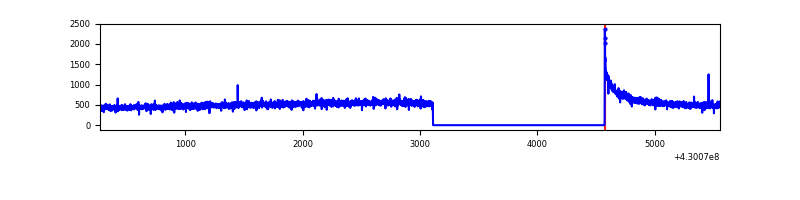 |
| B | 5284 | 3822 | 33 | 33 | 0.62% | 0.86% | 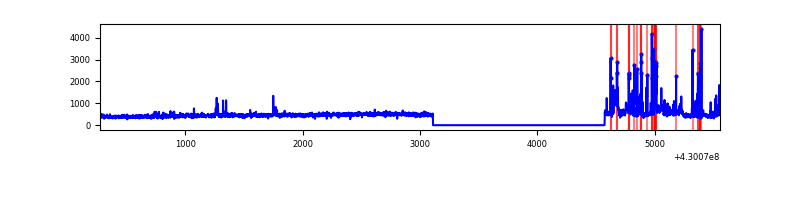 |
| C | 5284 | 3822 | 18 | 18 | 0.34% | 0.47% | 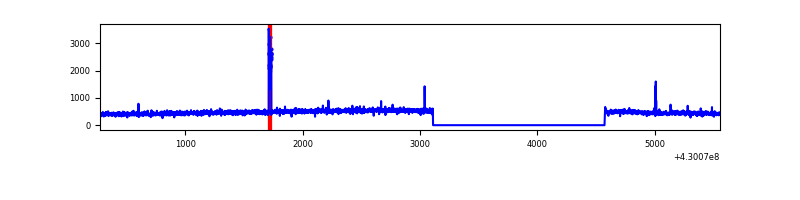 |
| D | 5284 | 3822 | 55 | 55 | 1.04% | 1.44% | 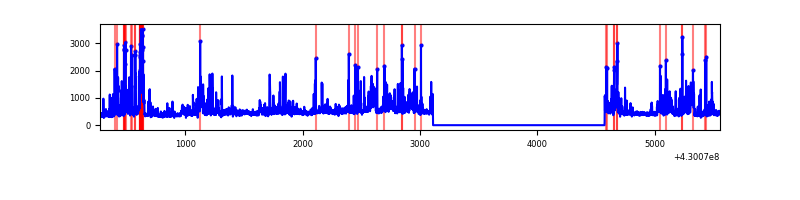 |
Top three noisy pixels from each quadrant. If the there are fewer than three noisy pixels in the level2.evt file, extra rows are filled as -1
| Pixel properties | Quadrant properties | ||||||
|---|---|---|---|---|---|---|---|
| Quadrant | DetID | PixID | Counts | Sigma | Mean | Median | Sigma |
| A | 10 | 83 | 352083 | 3927.95 | 428 | 419 | 89.5 |
| A | 3 | 137 | 4892 | 49.96 | 428 | 419 | 89.5 |
| A | 13 | 6 | 4300 | 43.35 | 428 | 419 | 89.5 |
| B | 10 | 246 | 151374 | 1785.96 | 424 | 411 | 84.5 |
| B | 0 | 229 | 102118 | 1203.24 | 424 | 411 | 84.5 |
| B | 15 | 85 | 33939 | 396.65 | 424 | 411 | 84.5 |
| C | 15 | 214 | 155869 | 1571.9 | 418 | 420 | 98.9 |
| C | 14 | 254 | 51940 | 520.97 | 418 | 420 | 98.9 |
| C | 15 | 111 | 7550 | 72.09 | 418 | 420 | 98.9 |
| D | 13 | 249 | 326698 | 3200.1 | 414 | 402 | 102.0 |
| D | 2 | 249 | 178661 | 1748.25 | 414 | 402 | 102.0 |
| D | 12 | 6 | 108784 | 1062.94 | 414 | 402 | 102.0 |
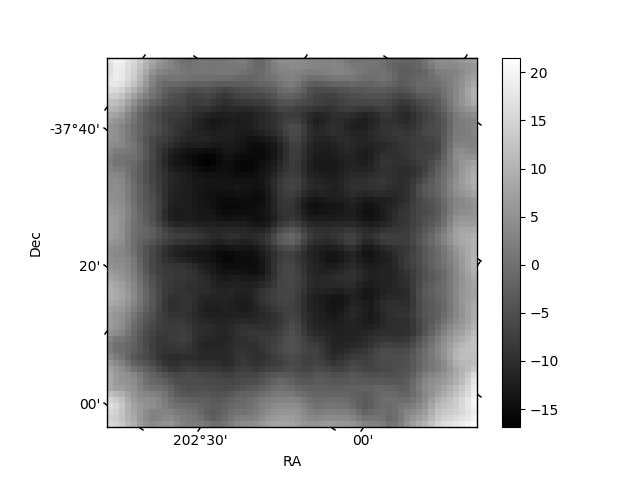
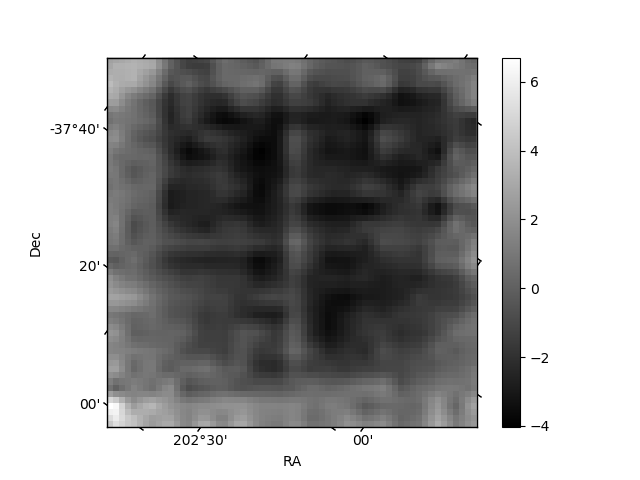
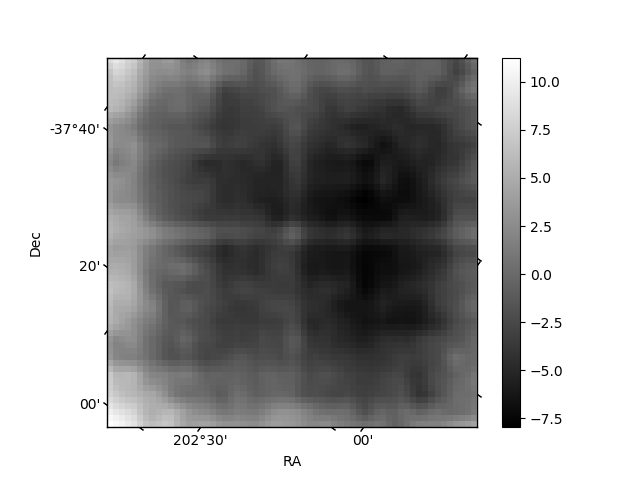
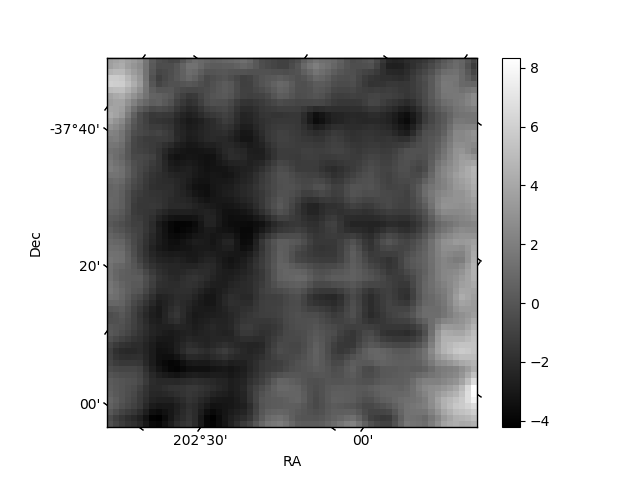
Histogram calculated using DETX and DETY for each event in the final _common_clean file
| Quadrant A | 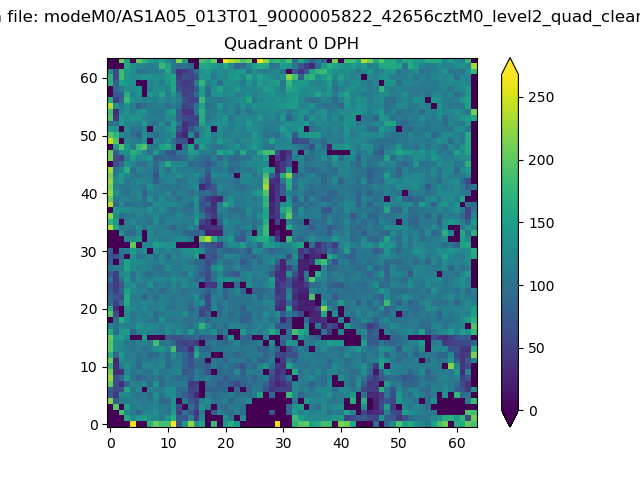 |
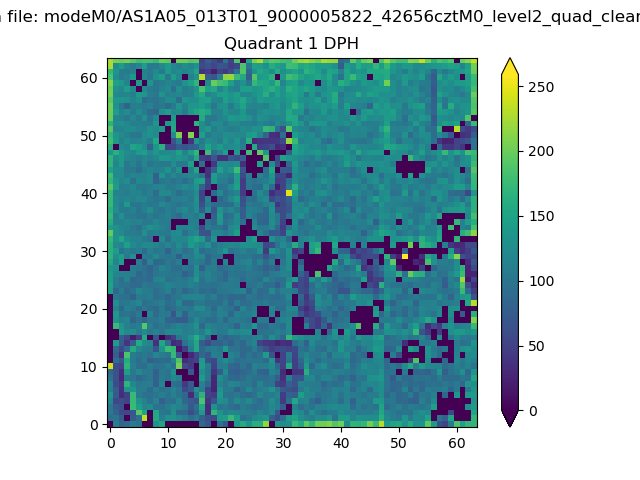 |
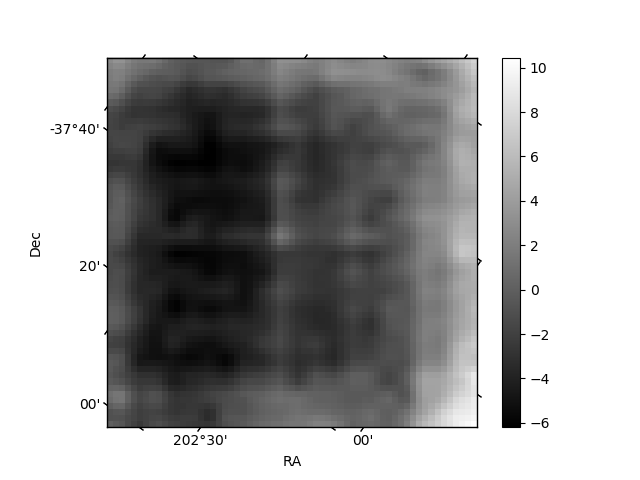
Quadrant B |
|---|---|---|---|
| Quadrant D | 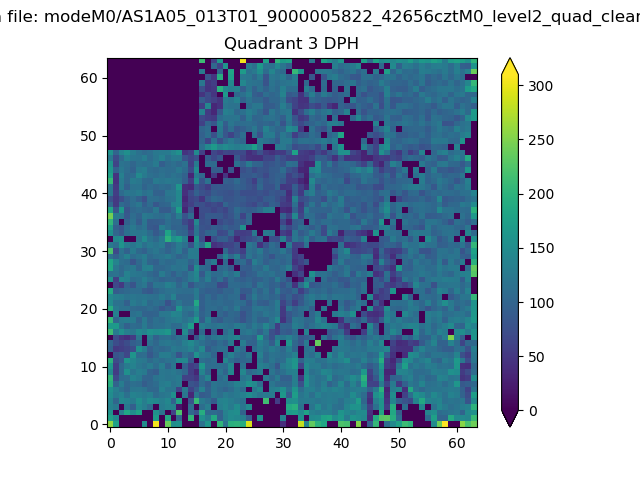 |
 |
Quadrant C |
| Plot type | Count rate plots | Images |
|---|---|---|
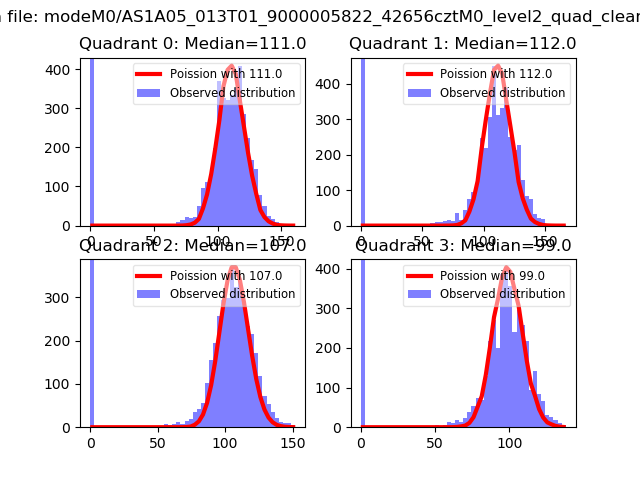
| Comparison with Poisson distribution Blue bars denote a histogram of data divided into 1 sec bins. Red curve is a Poisson curve with rate = median count rate of data. |
 |
 |
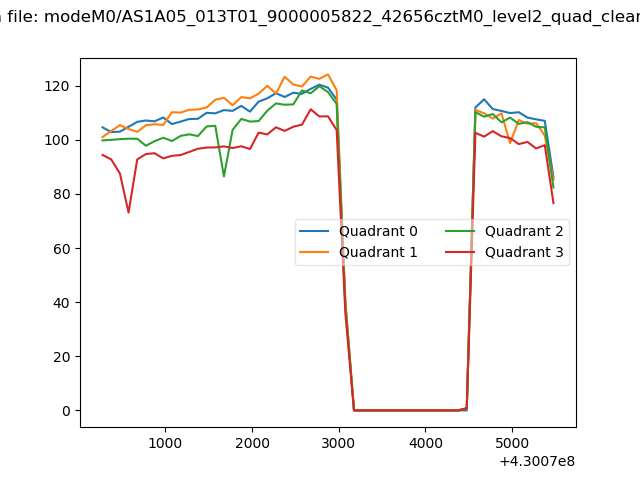
| Quadrant-wise count rates Data is divided into 100 sec bins |
 |
|
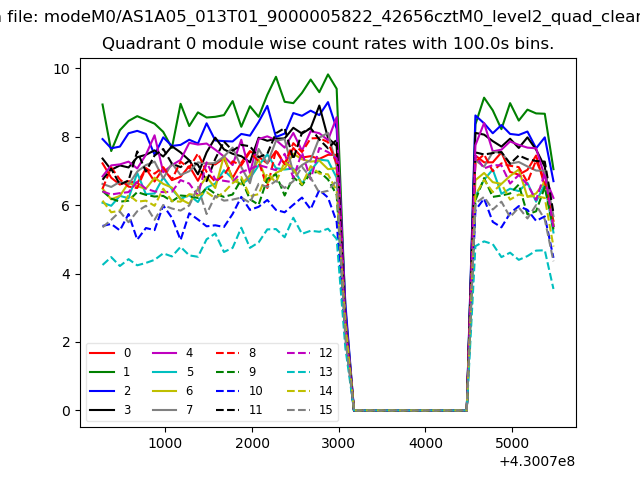
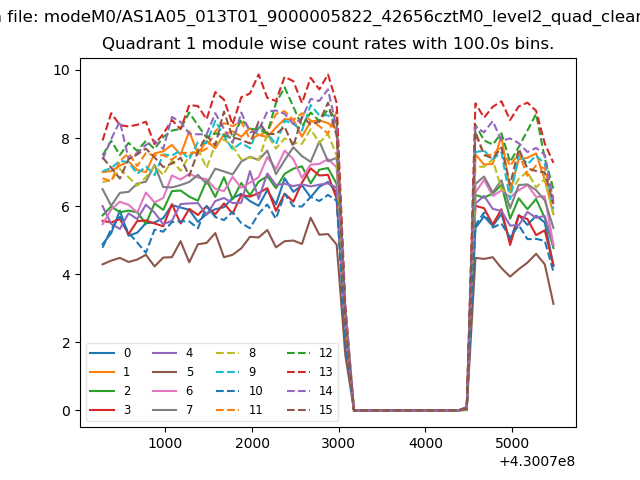
| Module-wise count rates for Quadrant A Data is divided into 100 sec bins |
 |
 |
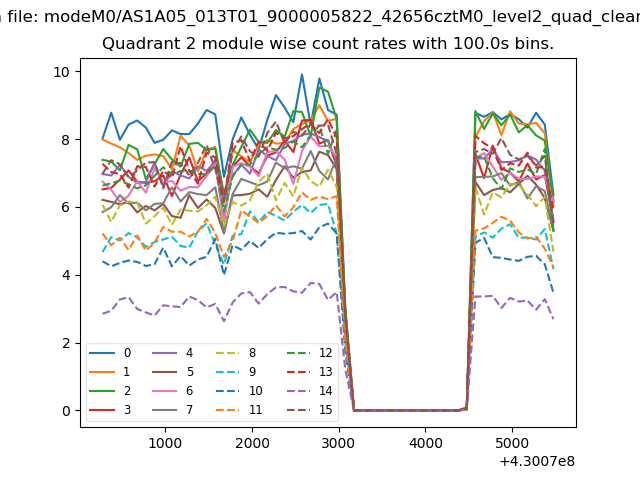
| Module-wise count rates for Quadrant B Data is divided into 100 sec bins |
 |
 |
| Module-wise count rates for Quadrant C Data is divided into 100 sec bins |
 |
 |
| Module-wise count rates for Quadrant D Data is divided into 100 sec bins |
 |
 |
| Parameter | Plot |
|---|---|
| CZT HV Monitor | 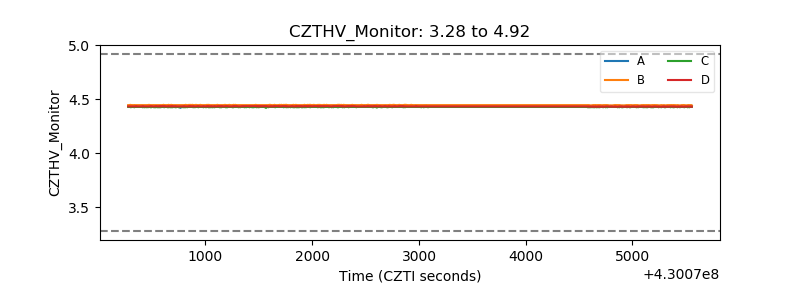 |
| D_VDD | 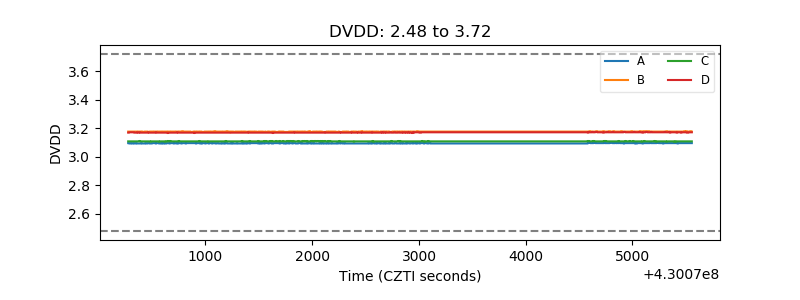 |
| Temperature 1 | 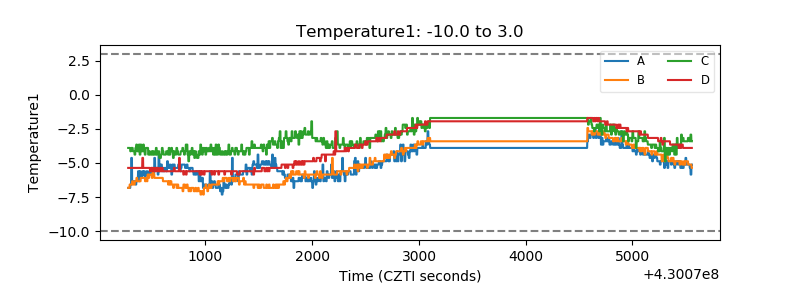 |
| Veto HV Monitor | 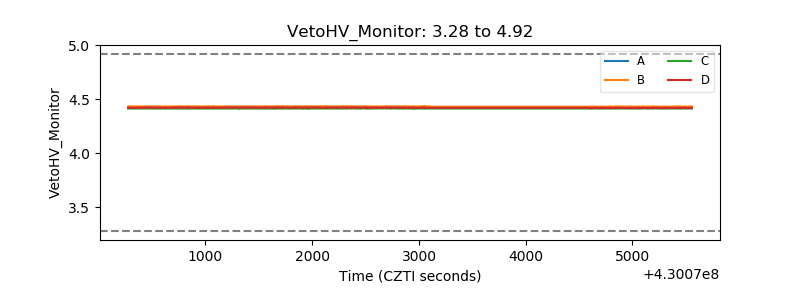 |
| Veto LLD | 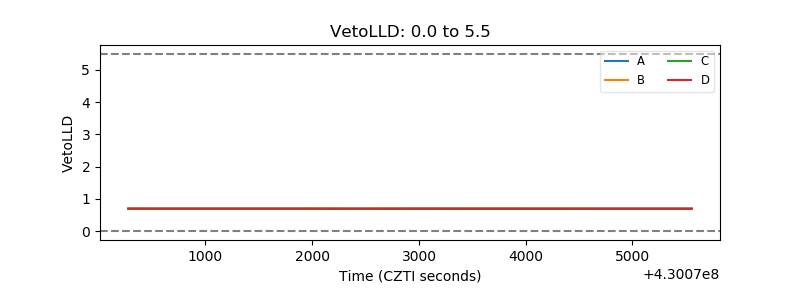 |
| Alpha Counter | 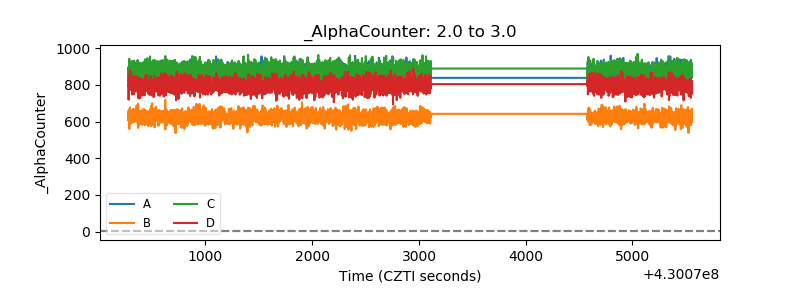 |
| _CPM_Rate | 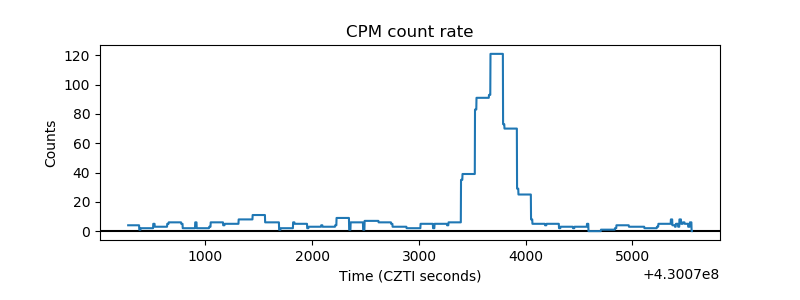 |
| CZT Counter |  |
| +2.5 Volts monitor | 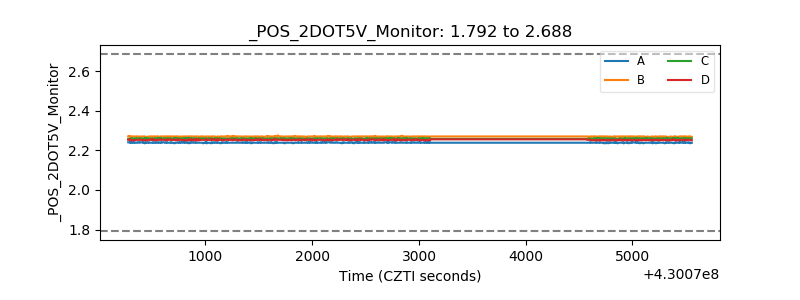 |
| +5 Volts monitor |  |
| _ROLL_ROT | 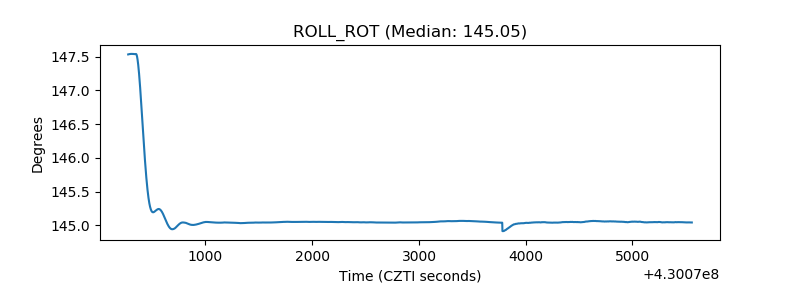 |
| _Roll_DEC | 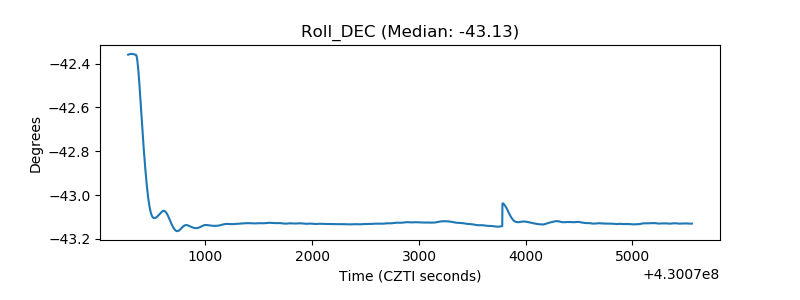 |
| _Roll_RA | 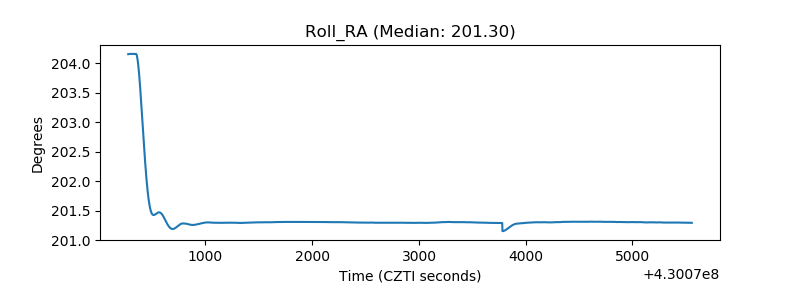 |
| Veto Counter | 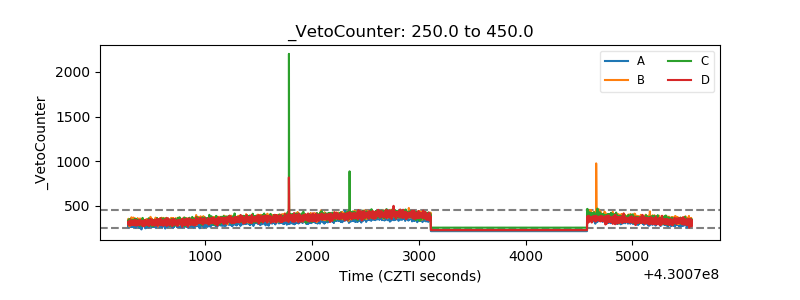 |