| Param | Original file | Final file |
|---|---|---|
| Filename | modeM0/AS1A05_013T01_9000005822_42657cztM0_level2.fits | modeM0/AS1A05_013T01_9000005822_42657cztM0_level2_quad_clean.evt |
| Size (bytes) | 357,520,320 | 90,809,280 |
| Size | 341.0 MB | 86.6 MB |
| Events in quadrant A | 2,971,706 | 615,081 |
| Events in quadrant B | 3,938,709 | 600,948 |
| Events in quadrant C | 2,629,704 | 593,339 |
| Events in quadrant D | 3,255,987 | 546,648 |
| Mode M0 | |||
|---|---|---|---|
| Quadrant | BADHDUFLAG | Total packets | Discarded packets |
| A | 0 | 12239 | 2 |
| B | 0 | 15489 | 2 |
| C | 0 | 11480 | 2 |
| D | 0 | 13732 | 2 |
| Mode M9 | |||
|---|---|---|---|
| Quadrant | BADHDUFLAG | Total packets | Discarded packets |
| A | 0 | 17 | 0 |
| B | 0 | 18 | 0 |
| C | 0 | 18 | 0 |
| D | 0 | 18 | 0 |
| Mode SS | |||
|---|---|---|---|
| Quadrant | BADHDUFLAG | Total packets | Discarded packets |
| A | 0 | 114 | 0 |
| B | 0 | 114 | 0 |
| C | 0 | 114 | 0 |
| D | 0 | 114 | 0 |
| Quadrant | Total seconds | Saturated seconds | Saturation percentage |
|---|---|---|---|
| A | 5628 | 14 | 0.248756% |
| B | 5628 | 277 | 4.921819% |
| C | 5628 | 17 | 0.302061% |
| D | 5628 | 118 | 2.096660% |
Noise dominated data is calculated using 1-second bins in cleaned event files. If a bin has >2000 counts, and if more than 50% of those come from <1% of pixels, then it is considered to be noise-dominated and hence unusable.
| Quadrant | # 1 sec bins | Bins with >0 counts | Bins with >2000 counts | High rate bins dominated by noise | Noise dominated (total time) | Noise dominated (detector-on time) | Marked lightcurve |
|---|---|---|---|---|---|---|---|
| A | 7181 | 5629 | 7 | 7 | 0.10% | 0.12% | 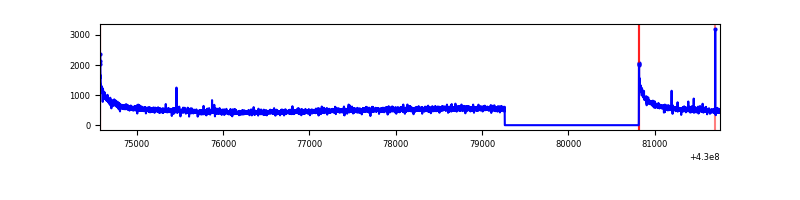 |
| B | 7181 | 5629 | 218 | 218 | 3.04% | 3.87% | 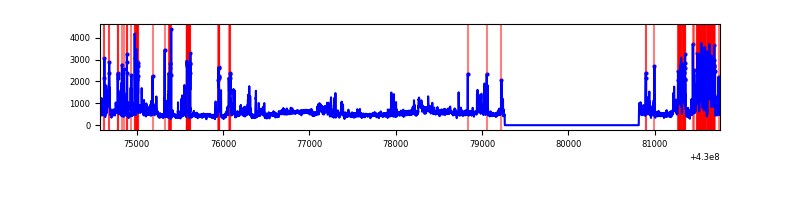 |
| C | 7181 | 5629 | 14 | 14 | 0.19% | 0.25% | 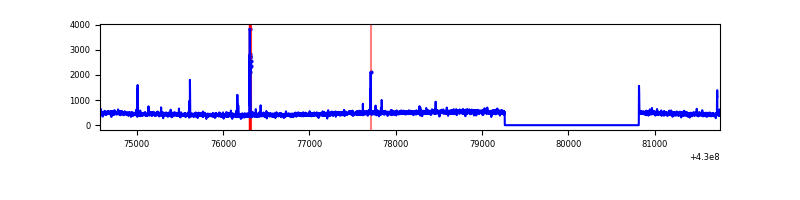 |
| D | 7181 | 5629 | 107 | 107 | 1.49% | 1.90% | 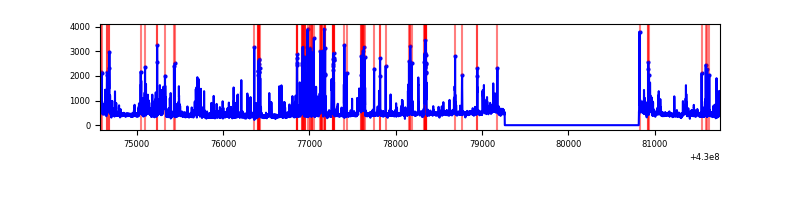 |
Top three noisy pixels from each quadrant. If the there are fewer than three noisy pixels in the level2.evt file, extra rows are filled as -1
| Pixel properties | Quadrant properties | ||||||
|---|---|---|---|---|---|---|---|
| Quadrant | DetID | PixID | Counts | Sigma | Mean | Median | Sigma |
| A | 10 | 83 | 585512 | 4587.62 | 613 | 601 | 127.5 |
| A | 13 | 248 | 7129 | 51.2 | 613 | 601 | 127.5 |
| A | 3 | 137 | 7127 | 51.19 | 613 | 601 | 127.5 |
| B | 10 | 246 | 796625 | 6730.1 | 600 | 581 | 118.3 |
| B | 0 | 229 | 627670 | 5301.68 | 600 | 581 | 118.3 |
| B | 0 | 245 | 61914 | 518.54 | 600 | 581 | 118.3 |
| C | 15 | 214 | 233389 | 1665.34 | 594 | 598 | 139.8 |
| C | 9 | 54 | 50369 | 356.05 | 594 | 598 | 139.8 |
| C | 14 | 254 | 14878 | 102.16 | 594 | 598 | 139.8 |
| D | 12 | 6 | 262541 | 1810.8 | 590 | 573 | 144.7 |
| D | 2 | 249 | 235952 | 1627.01 | 590 | 573 | 144.7 |
| D | 13 | 249 | 152111 | 1047.47 | 590 | 573 | 144.7 |
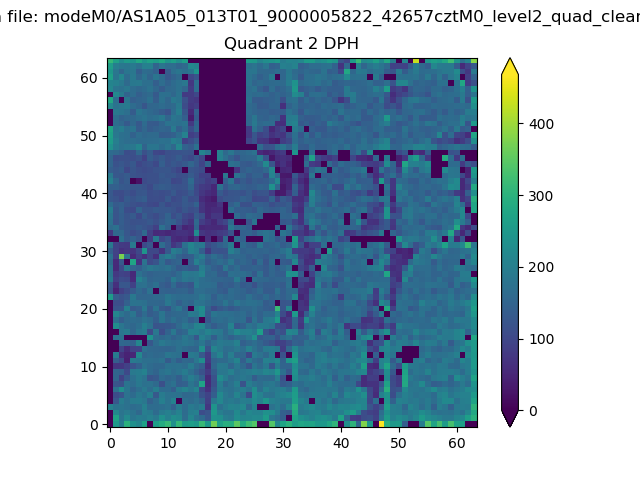
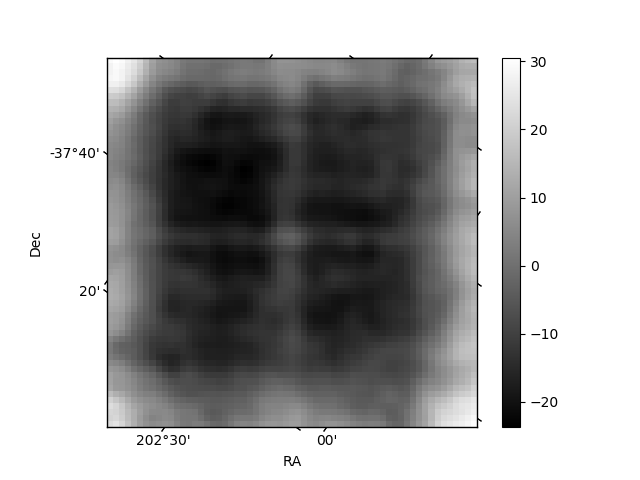
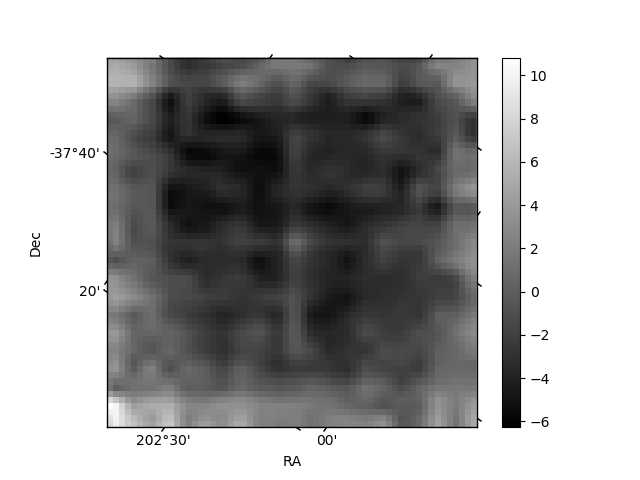
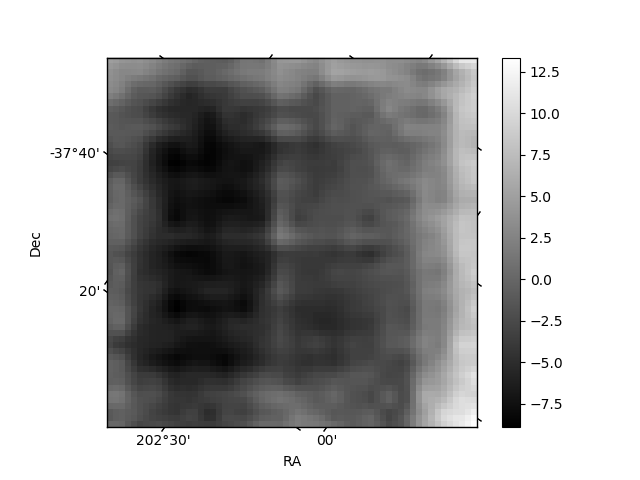
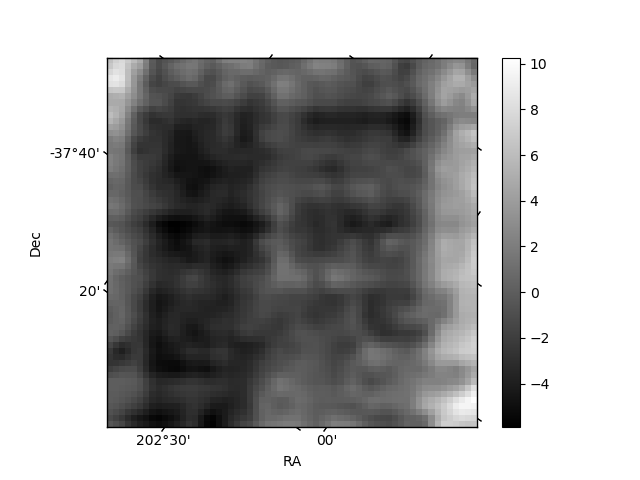
Histogram calculated using DETX and DETY for each event in the final _common_clean file
| Quadrant A | 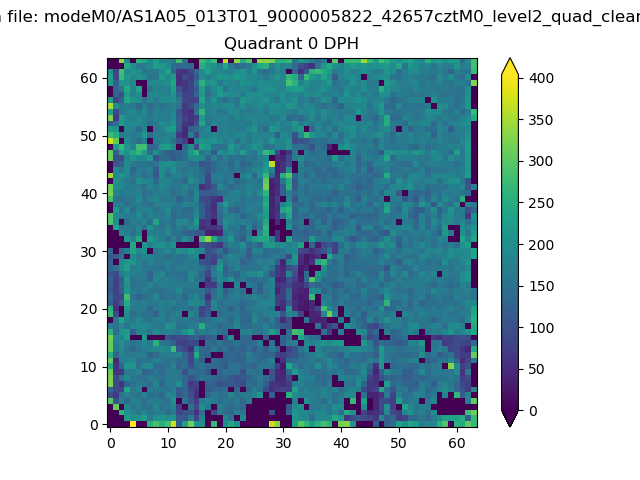 |
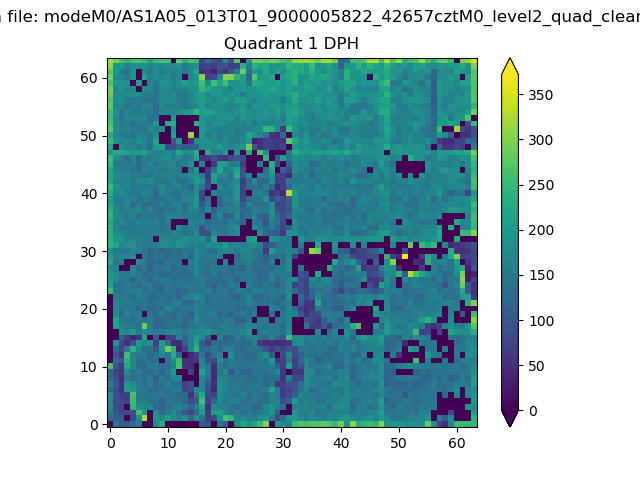 |
Quadrant B |
|---|---|---|---|
| Quadrant D | 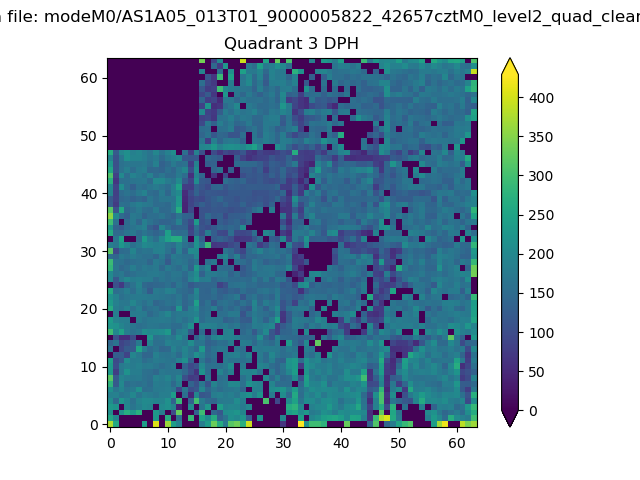 |
 |
Quadrant C |
| Plot type | Count rate plots | Images |
|---|---|---|
| Comparison with Poisson distribution Blue bars denote a histogram of data divided into 1 sec bins. Red curve is a Poisson curve with rate = median count rate of data. |
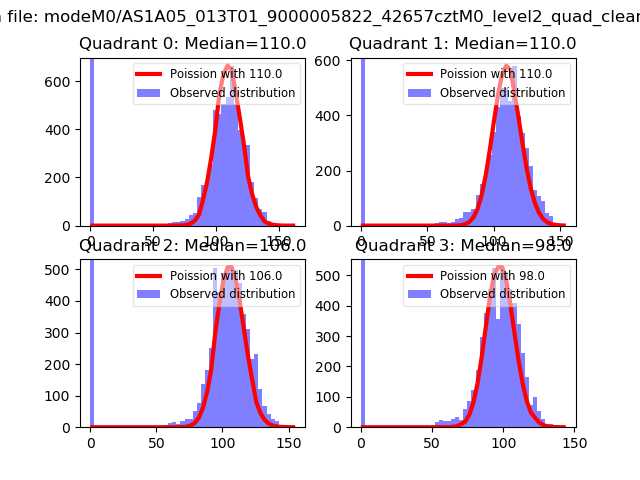 |
 |
| Quadrant-wise count rates Data is divided into 100 sec bins |
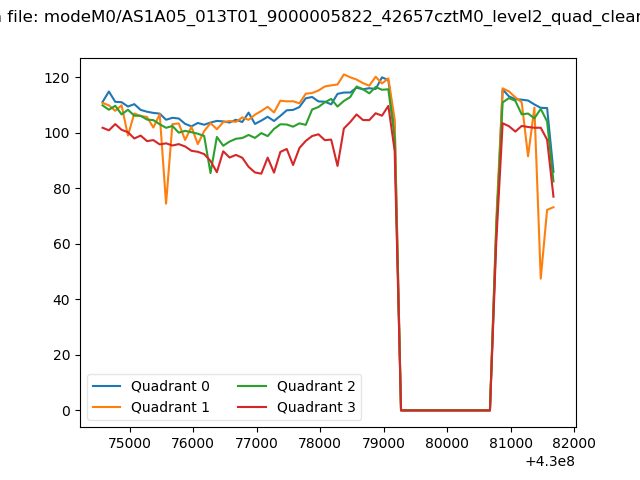 |
|
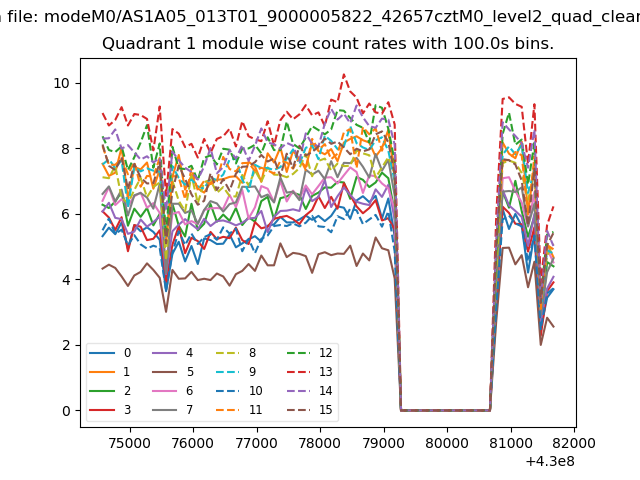
| Module-wise count rates for Quadrant A Data is divided into 100 sec bins |
 |
 |
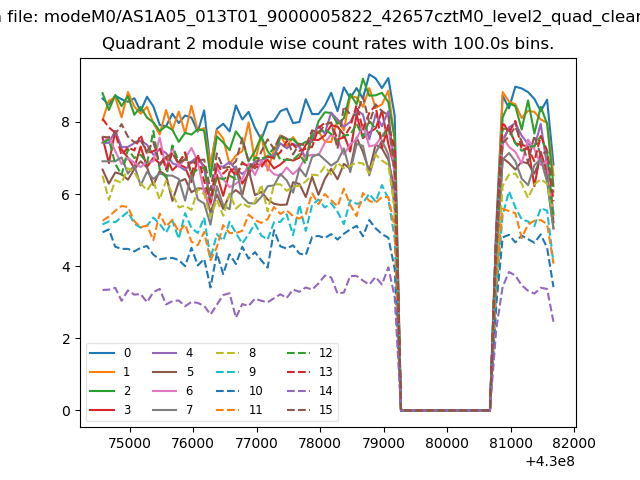
| Module-wise count rates for Quadrant B Data is divided into 100 sec bins |
 |
 |
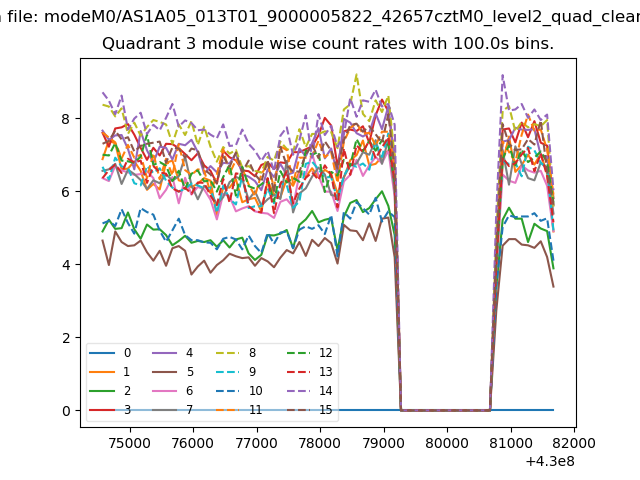
| Module-wise count rates for Quadrant C Data is divided into 100 sec bins |
 |
 |
| Module-wise count rates for Quadrant D Data is divided into 100 sec bins |
 |
 |
| Parameter | Plot |
|---|---|
| CZT HV Monitor | 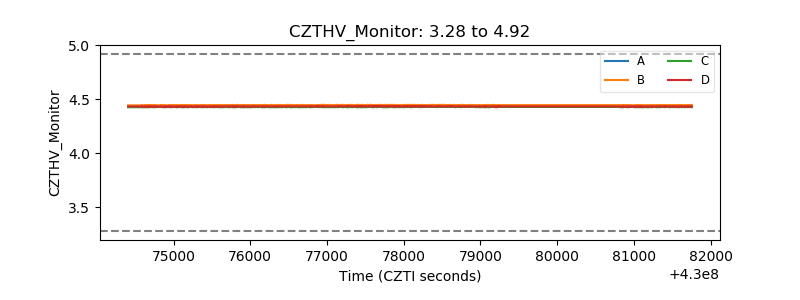 |
| D_VDD | 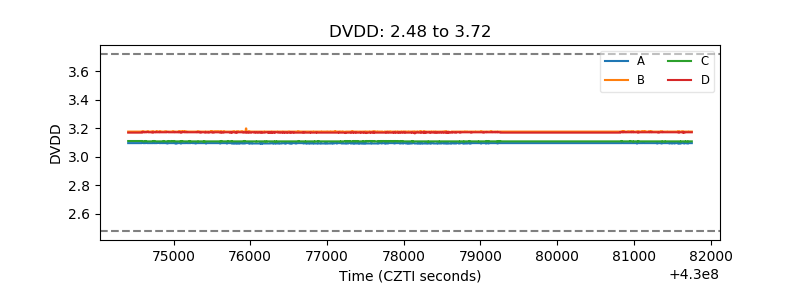 |
| Temperature 1 | 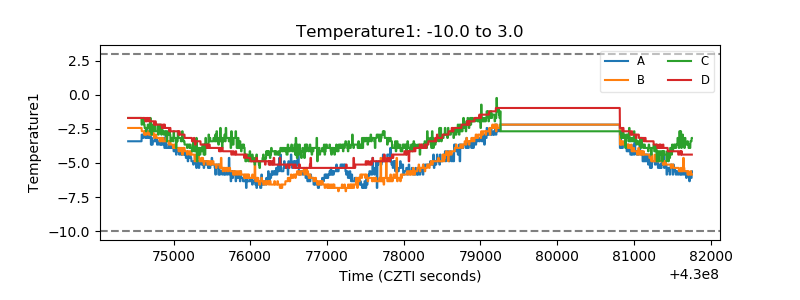 |
| Veto HV Monitor |  |
| Veto LLD | 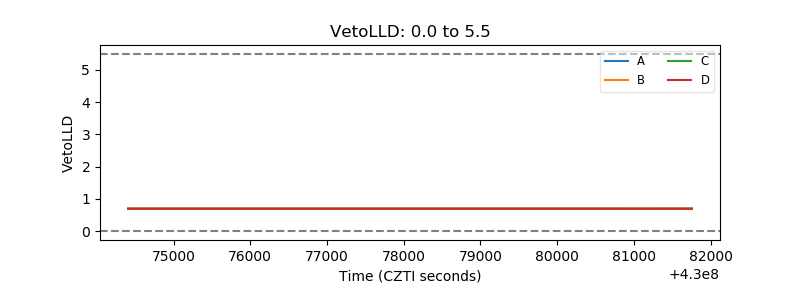 |
| Alpha Counter | 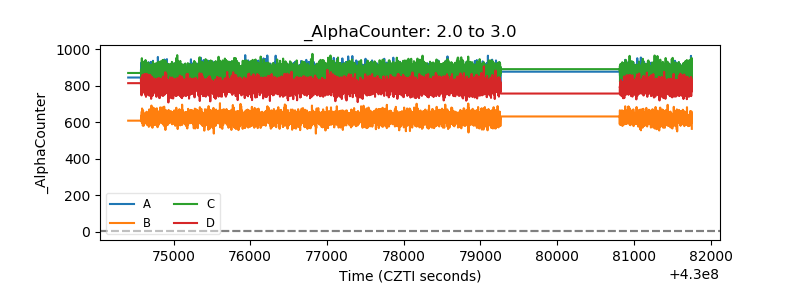 |
| _CPM_Rate | 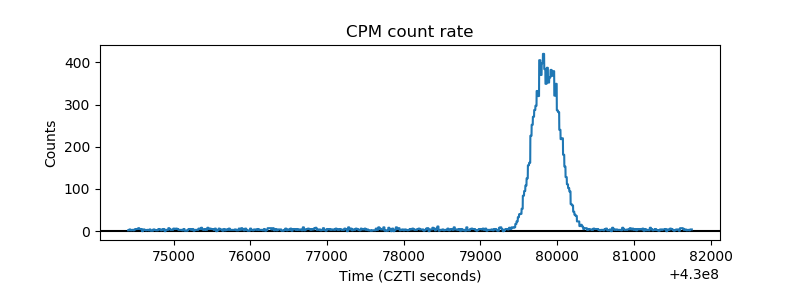 |
| CZT Counter | 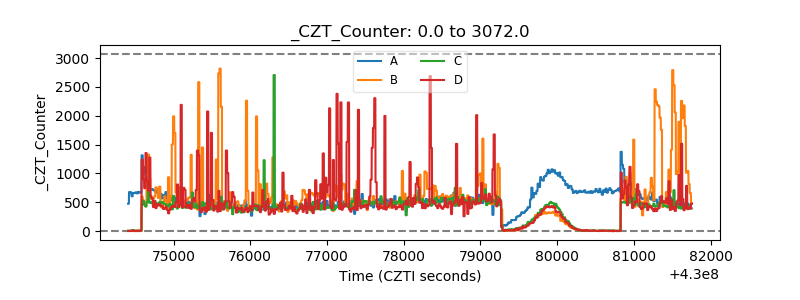 |
| +2.5 Volts monitor | 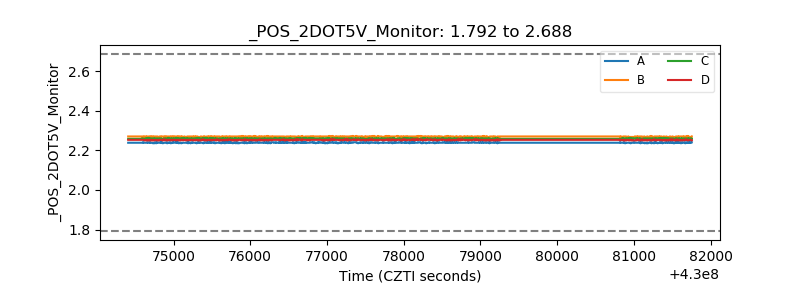 |
| +5 Volts monitor | 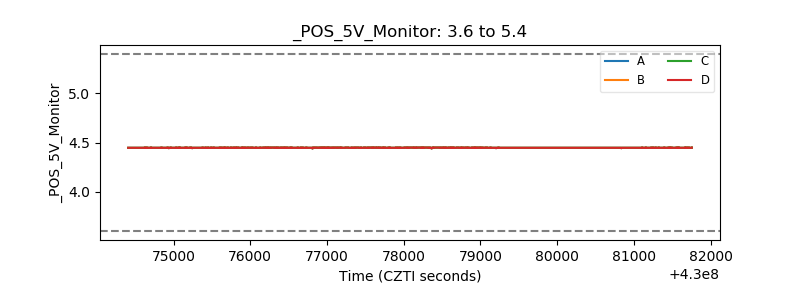 |
| _ROLL_ROT | 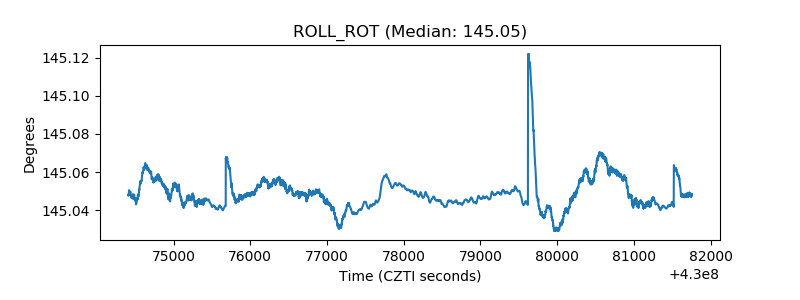 |
| _Roll_DEC | 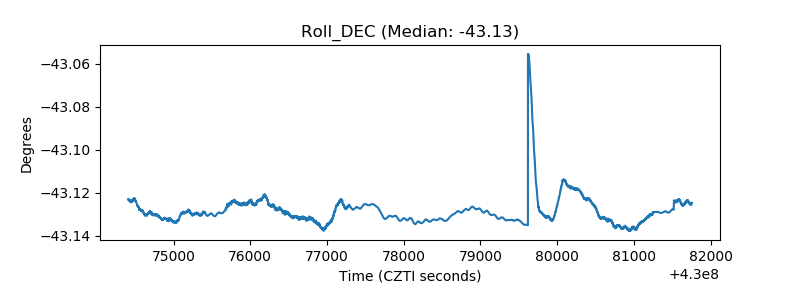 |
| _Roll_RA | 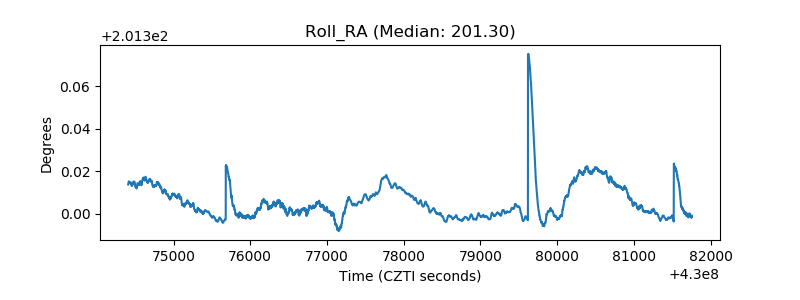 |
| Veto Counter | 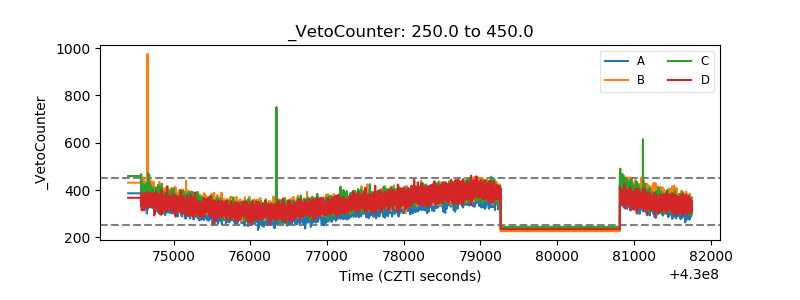 |