| Param | Original file | Final file |
|---|---|---|
| Filename | modeM0/AS1A05_013T01_9000005822_42658cztM0_level2.fits | modeM0/AS1A05_013T01_9000005822_42658cztM0_level2_quad_clean.evt |
| Size (bytes) | 373,320,000 | 87,390,720 |
| Size | 356.0 MB | 83.3 MB |
| Events in quadrant A | 2,915,121 | 597,173 |
| Events in quadrant B | 4,751,858 | 570,953 |
| Events in quadrant C | 2,524,770 | 577,662 |
| Events in quadrant D | 3,205,510 | 520,867 |
| Mode M0 | |||
|---|---|---|---|
| Quadrant | BADHDUFLAG | Total packets | Discarded packets |
| A | 0 | 11917 | 2 |
| B | 0 | 17794 | 2 |
| C | 0 | 10987 | 2 |
| D | 0 | 13441 | 2 |
| Mode M9 | |||
|---|---|---|---|
| Quadrant | BADHDUFLAG | Total packets | Discarded packets |
| A | 0 | 28 | 0 |
| B | 0 | 29 | 0 |
| C | 0 | 29 | 0 |
| D | 0 | 29 | 0 |
| Mode SS | |||
|---|---|---|---|
| Quadrant | BADHDUFLAG | Total packets | Discarded packets |
| A | 0 | 139781518821416 | 139779710648366 |
| B | 0 | -1 | -1 |
| C | 0 | -1 | -1 |
| D | 0 | -1 | -1 |
| Quadrant | Total seconds | Saturated seconds | Saturation percentage |
|---|---|---|---|
| A | 5420 | 22 | 0.405904% |
| B | 5419 | 487 | 8.986898% |
| C | 5419 | 8 | 0.147629% |
| D | 5419 | 196 | 3.616903% |
Noise dominated data is calculated using 1-second bins in cleaned event files. If a bin has >2000 counts, and if more than 50% of those come from <1% of pixels, then it is considered to be noise-dominated and hence unusable.
| Quadrant | # 1 sec bins | Bins with >0 counts | Bins with >2000 counts | High rate bins dominated by noise | Noise dominated (total time) | Noise dominated (detector-on time) | Marked lightcurve |
|---|---|---|---|---|---|---|---|
| A | 7092 | 5421 | 10 | 10 | 0.14% | 0.18% | 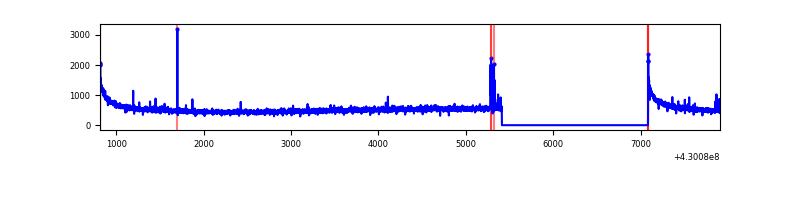 |
| B | 7091 | 5420 | 387 | 387 | 5.46% | 7.14% | 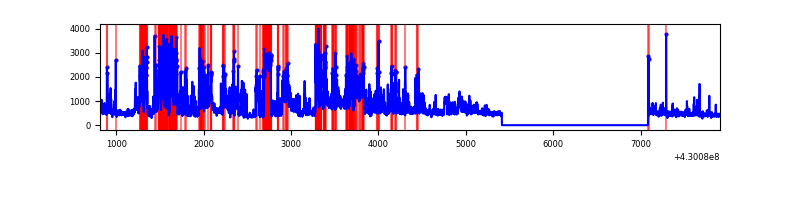 |
| C | 7091 | 5420 | 1 | 1 | 0.01% | 0.02% | 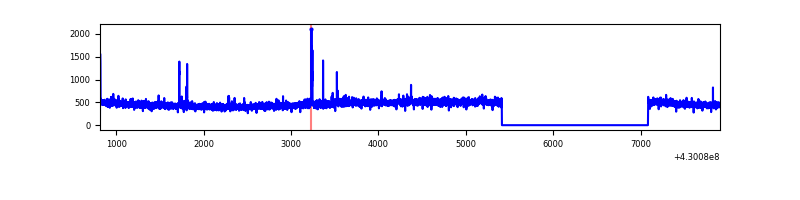 |
| D | 7091 | 5420 | 191 | 191 | 2.69% | 3.52% | 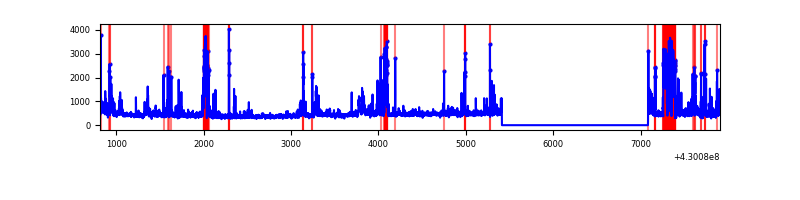 |
Top three noisy pixels from each quadrant. If the there are fewer than three noisy pixels in the level2.evt file, extra rows are filled as -1
| Pixel properties | Quadrant properties | ||||||
|---|---|---|---|---|---|---|---|
| Quadrant | DetID | PixID | Counts | Sigma | Mean | Median | Sigma |
| A | 10 | 83 | 564293 | 4571.08 | 595 | 583 | 123.3 |
| A | 13 | 248 | 33656 | 268.19 | 595 | 583 | 123.3 |
| A | 13 | 6 | 9324 | 70.88 | 595 | 583 | 123.3 |
| B | 0 | 229 | 1525835 | 13603.08 | 574 | 559 | 112.1 |
| B | 10 | 246 | 815661 | 7269.44 | 574 | 559 | 112.1 |
| B | 0 | 245 | 76170 | 674.33 | 574 | 559 | 112.1 |
| C | 15 | 214 | 227767 | 1693.81 | 577 | 579 | 134.1 |
| C | 14 | 254 | 30048 | 219.71 | 577 | 579 | 134.1 |
| C | 3 | 233 | 6441 | 43.7 | 577 | 579 | 134.1 |
| D | 2 | 249 | 486298 | 3479.76 | 565 | 549 | 139.6 |
| D | 1 | 52 | 209031 | 1493.5 | 565 | 549 | 139.6 |
| D | 12 | 6 | 100345 | 714.91 | 565 | 549 | 139.6 |
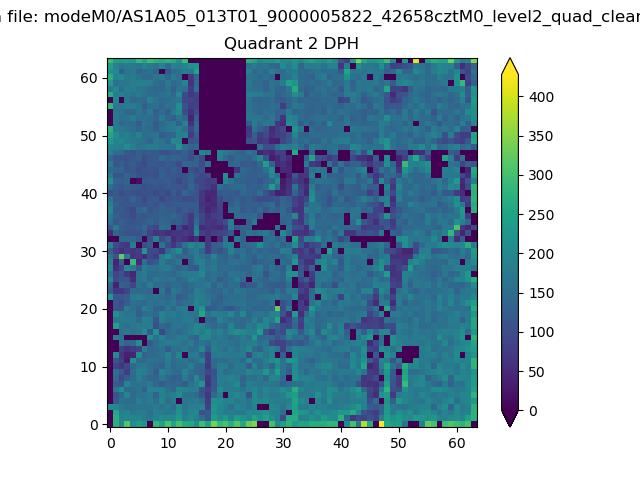
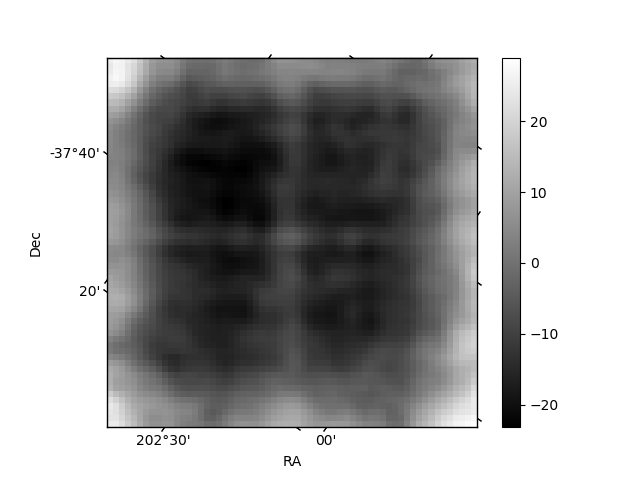
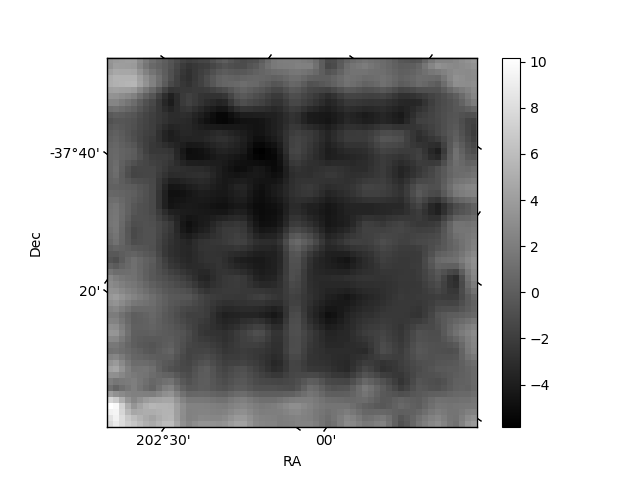
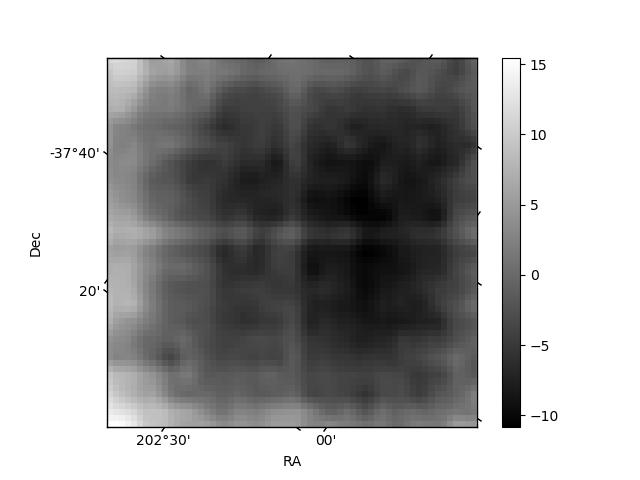
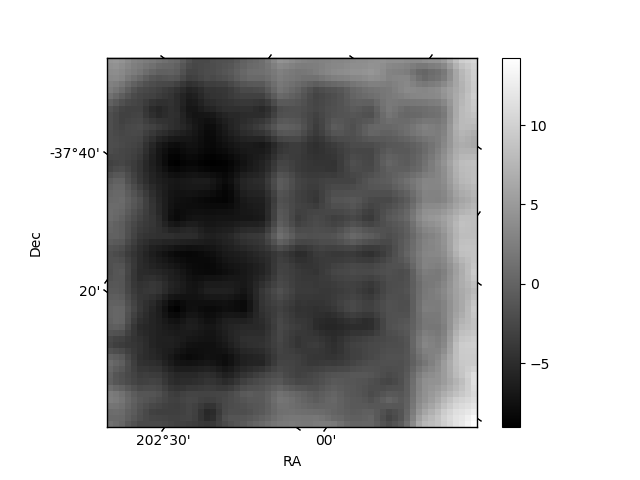
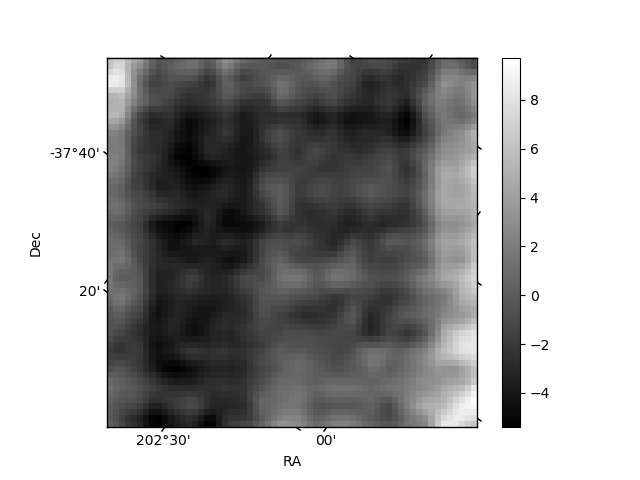
Histogram calculated using DETX and DETY for each event in the final _common_clean file
| Quadrant A | 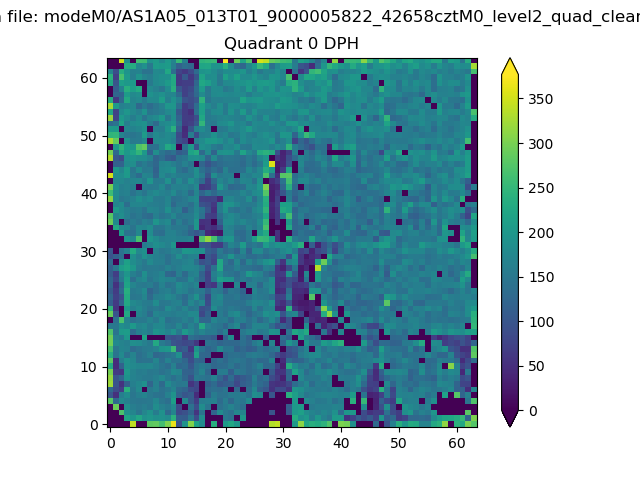 |
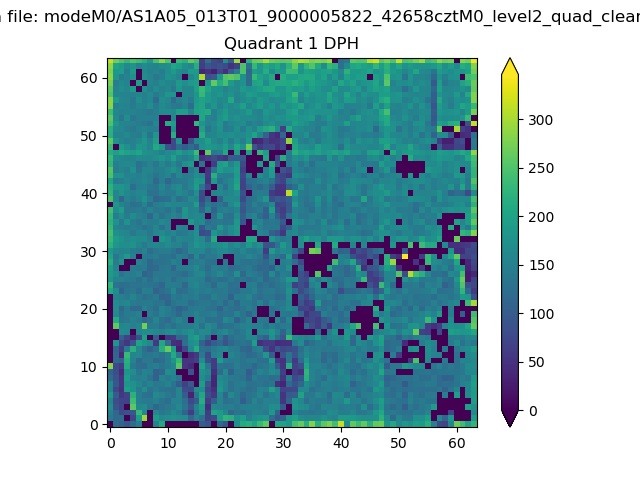 |
Quadrant B |
|---|---|---|---|
| Quadrant D | 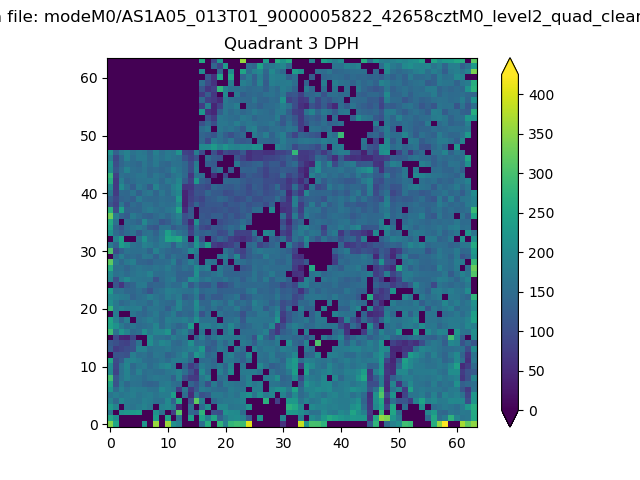 |
 |
Quadrant C |
| Plot type | Count rate plots | Images |
|---|---|---|
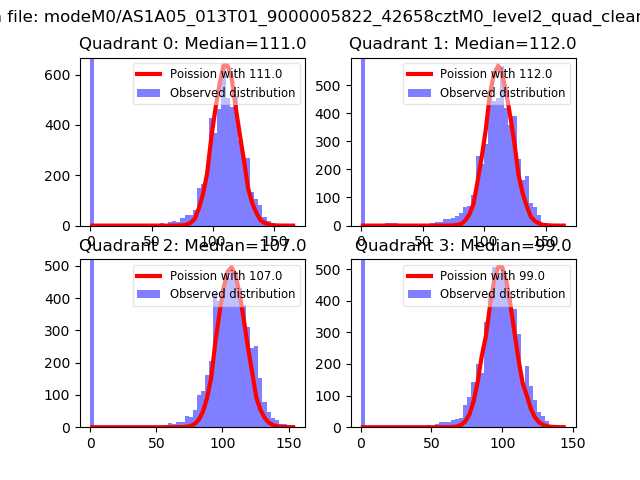
| Comparison with Poisson distribution Blue bars denote a histogram of data divided into 1 sec bins. Red curve is a Poisson curve with rate = median count rate of data. |
 |
 |
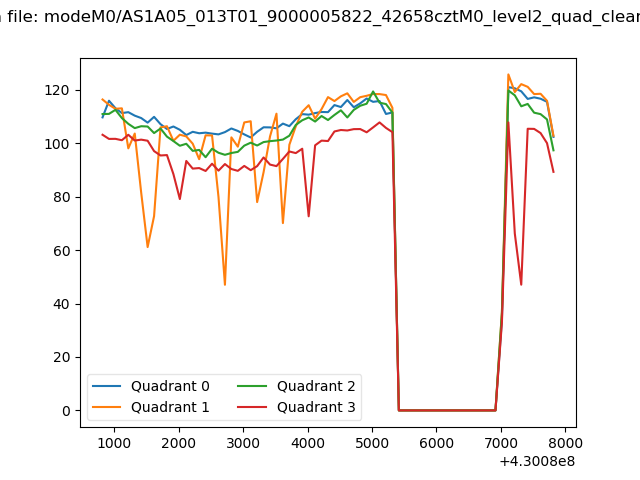
| Quadrant-wise count rates Data is divided into 100 sec bins |
 |
|
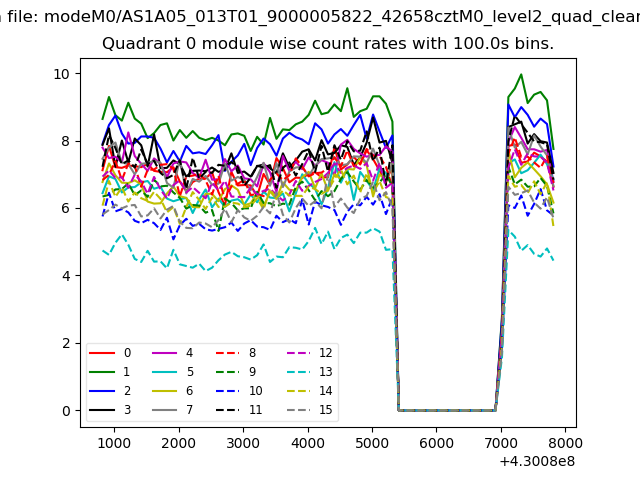
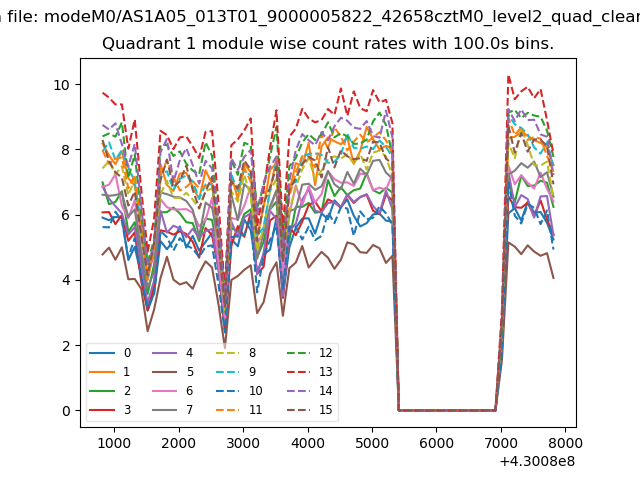
| Module-wise count rates for Quadrant A Data is divided into 100 sec bins |
 |
 |
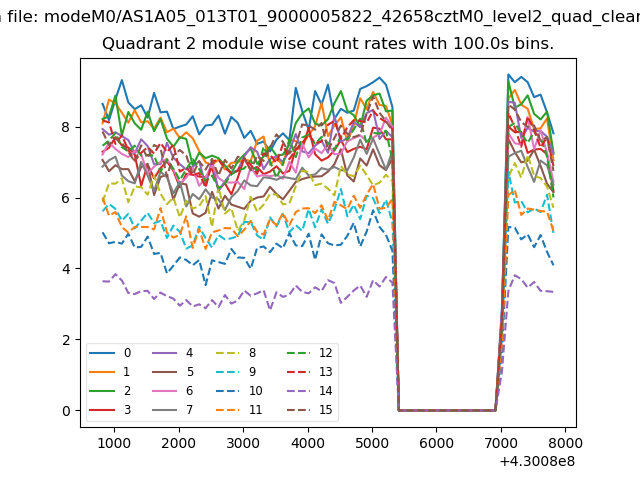
| Module-wise count rates for Quadrant B Data is divided into 100 sec bins |
 |
 |
| Module-wise count rates for Quadrant C Data is divided into 100 sec bins |
 |
 |
| Module-wise count rates for Quadrant D Data is divided into 100 sec bins |
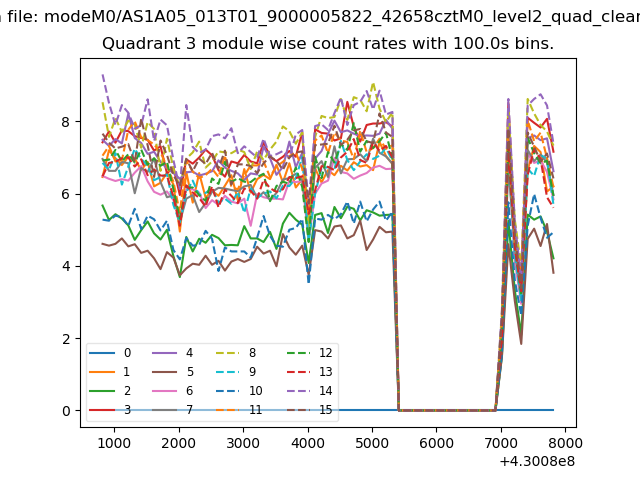 |
 |
| Parameter | Plot |
|---|---|
| CZT HV Monitor | 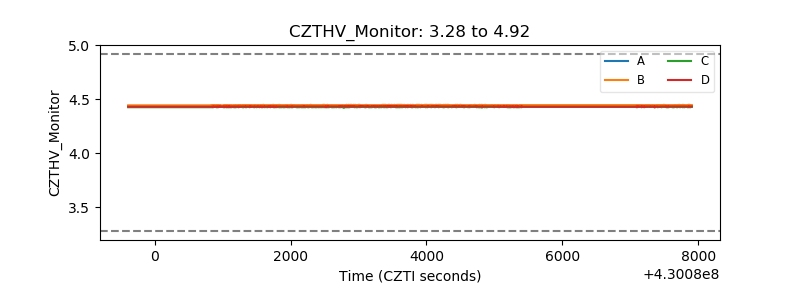 |
| D_VDD | 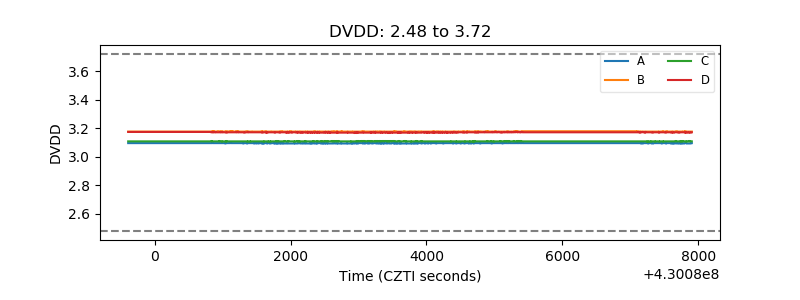 |
| Temperature 1 | 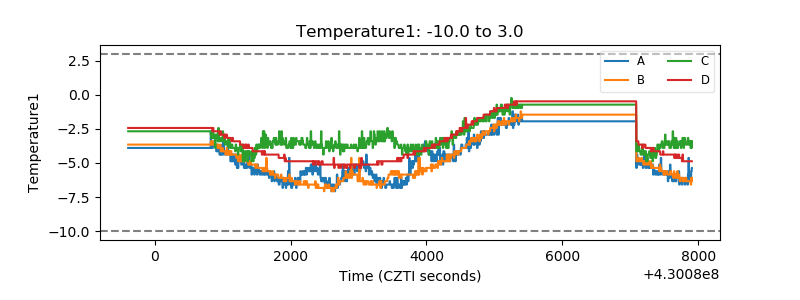 |
| Veto HV Monitor | 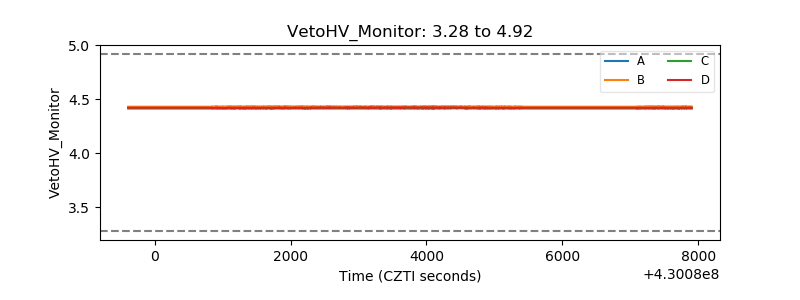 |
| Veto LLD | 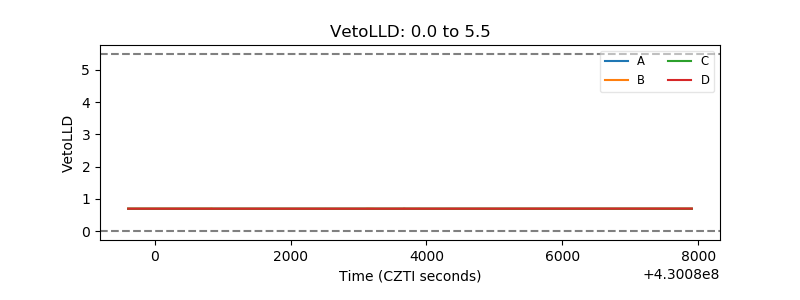 |
| Alpha Counter | 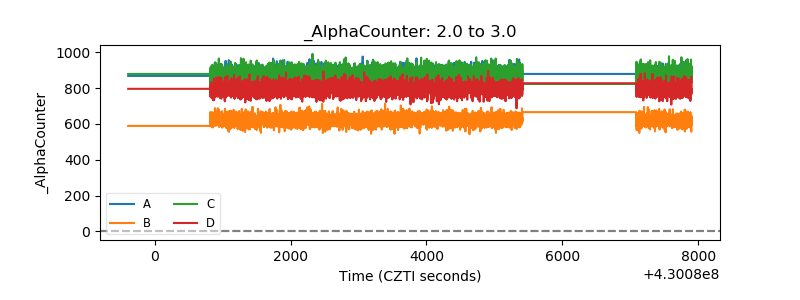 |
| _CPM_Rate | 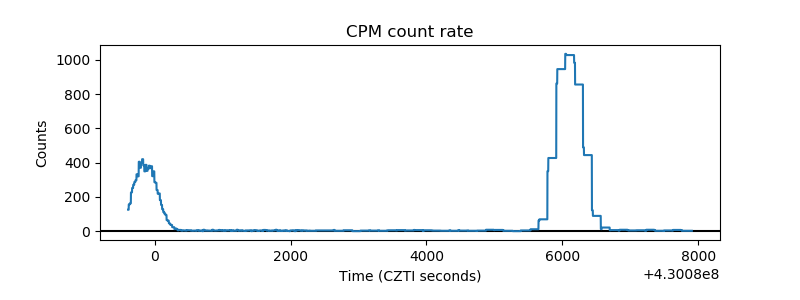 |
| CZT Counter | 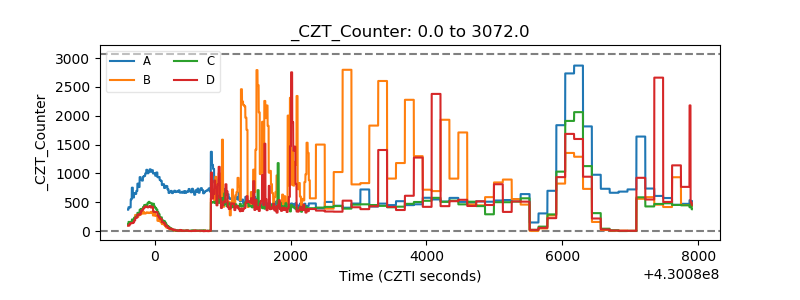 |
| +2.5 Volts monitor | 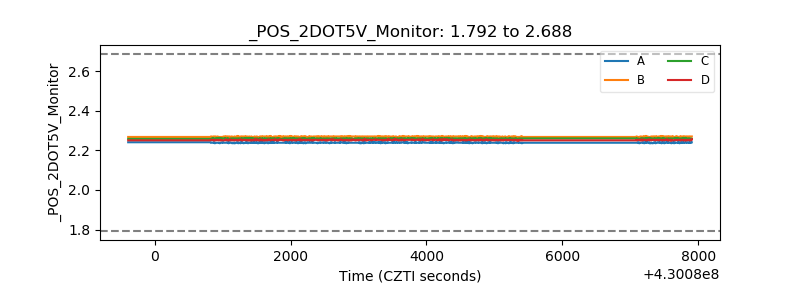 |
| +5 Volts monitor |  |
| _ROLL_ROT | 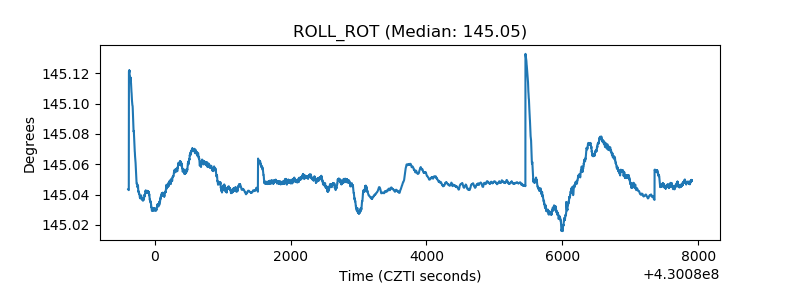 |
| _Roll_DEC | 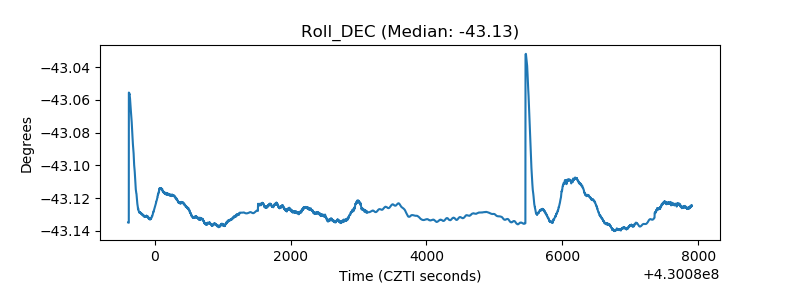 |
| _Roll_RA | 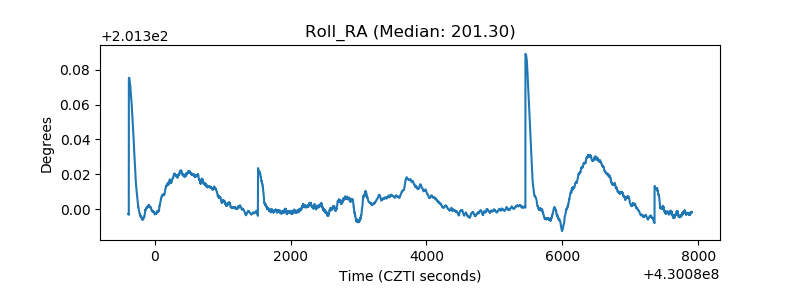 |
| Veto Counter | 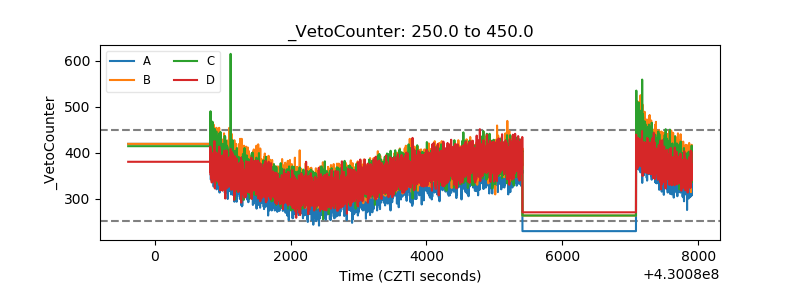 |