| Param | Original file | Final file |
|---|---|---|
| Filename | modeM0/AS1A05_013T01_9000005822_42660cztM0_level2.fits | modeM0/AS1A05_013T01_9000005822_42660cztM0_level2_quad_clean.evt |
| Size (bytes) | 336,746,880 | 89,660,160 |
| Size | 321.1 MB | 85.5 MB |
| Events in quadrant A | 2,943,571 | 613,946 |
| Events in quadrant B | 2,680,660 | 625,060 |
| Events in quadrant C | 2,528,927 | 590,055 |
| Events in quadrant D | 3,896,735 | 512,087 |
| Mode M0 | |||
|---|---|---|---|
| Quadrant | BADHDUFLAG | Total packets | Discarded packets |
| A | 0 | 11855 | 2 |
| B | 0 | 11531 | 2 |
| C | 0 | 10771 | 2 |
| D | 0 | 15332 | 2 |
| Mode M9 | |||
|---|---|---|---|
| Quadrant | BADHDUFLAG | Total packets | Discarded packets |
| A | 0 | 30 | 0 |
| B | 0 | 31 | 0 |
| C | 0 | 31 | 0 |
| D | 0 | 31 | 0 |
| Mode SS | |||
|---|---|---|---|
| Quadrant | BADHDUFLAG | Total packets | Discarded packets |
| A | 0 | 110 | 0 |
| B | 0 | 110 | 0 |
| C | 0 | 110 | 0 |
| D | 0 | 110 | 0 |
| Quadrant | Total seconds | Saturated seconds | Saturation percentage |
|---|---|---|---|
| A | 5331 | 35 | 0.656537% |
| B | 5330 | 46 | 0.863039% |
| C | 5330 | 5 | 0.093809% |
| D | 5330 | 428 | 8.030019% |
Noise dominated data is calculated using 1-second bins in cleaned event files. If a bin has >2000 counts, and if more than 50% of those come from <1% of pixels, then it is considered to be noise-dominated and hence unusable.
| Quadrant | # 1 sec bins | Bins with >0 counts | Bins with >2000 counts | High rate bins dominated by noise | Noise dominated (total time) | Noise dominated (detector-on time) | Marked lightcurve |
|---|---|---|---|---|---|---|---|
| A | 7154 | 5332 | 20 | 20 | 0.28% | 0.38% | 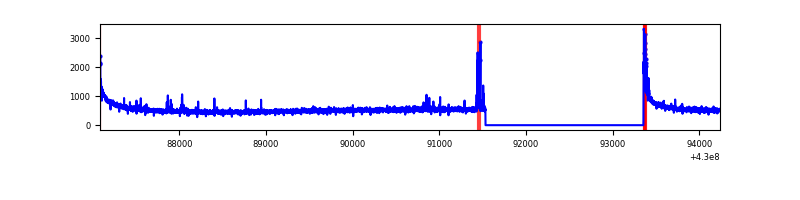 |
| B | 7153 | 5331 | 25 | 25 | 0.35% | 0.47% | 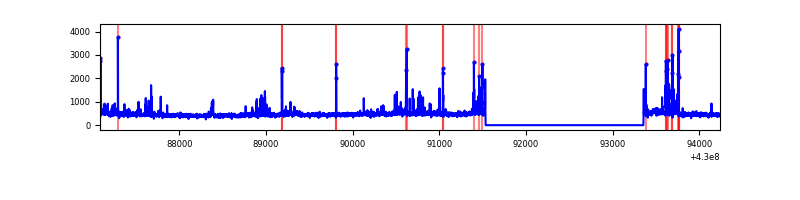 |
| C | 7153 | 5331 | 2 | 2 | 0.03% | 0.04% | 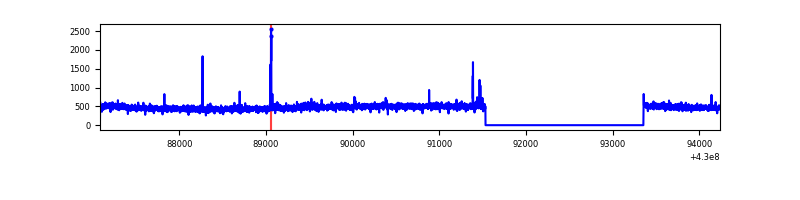 |
| D | 7153 | 5331 | 390 | 390 | 5.45% | 7.32% | 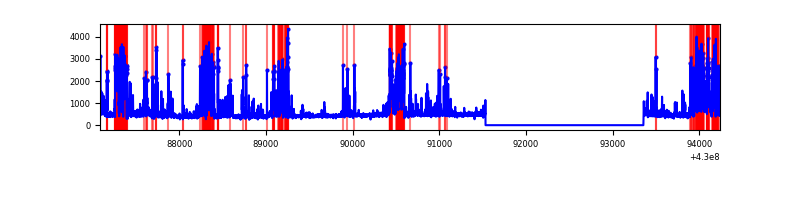 |
Top three noisy pixels from each quadrant. If the there are fewer than three noisy pixels in the level2.evt file, extra rows are filled as -1
| Pixel properties | Quadrant properties | ||||||
|---|---|---|---|---|---|---|---|
| Quadrant | DetID | PixID | Counts | Sigma | Mean | Median | Sigma |
| A | 10 | 83 | 541496 | 4356.07 | 598 | 586 | 124.2 |
| A | 13 | 248 | 68077 | 543.52 | 598 | 586 | 124.2 |
| A | 7 | 3 | 11057 | 84.33 | 598 | 586 | 124.2 |
| B | 10 | 246 | 167895 | 1450.87 | 594 | 578 | 115.3 |
| B | 5 | 255 | 59304 | 509.23 | 594 | 578 | 115.3 |
| B | 3 | 112 | 40741 | 348.27 | 594 | 578 | 115.3 |
| C | 15 | 214 | 222578 | 1644.28 | 579 | 584 | 135.0 |
| C | 14 | 254 | 26386 | 191.11 | 579 | 584 | 135.0 |
| C | 8 | 95 | 6291 | 42.27 | 579 | 584 | 135.0 |
| D | 2 | 249 | 1269723 | 9179.76 | 559 | 541 | 138.3 |
| D | 12 | 6 | 239426 | 1727.81 | 559 | 541 | 138.3 |
| D | 1 | 52 | 92817 | 667.42 | 559 | 541 | 138.3 |
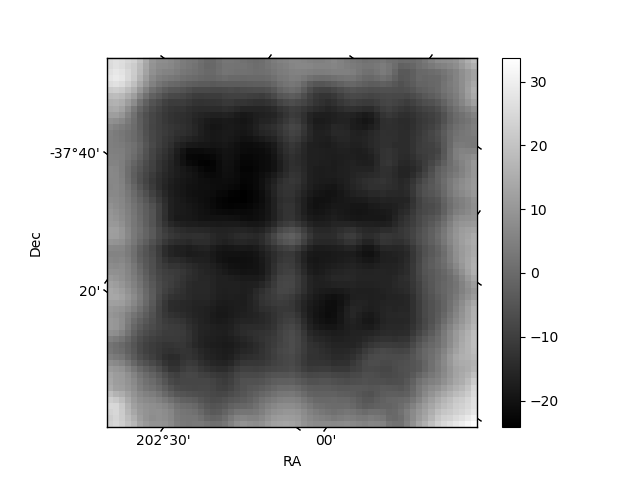
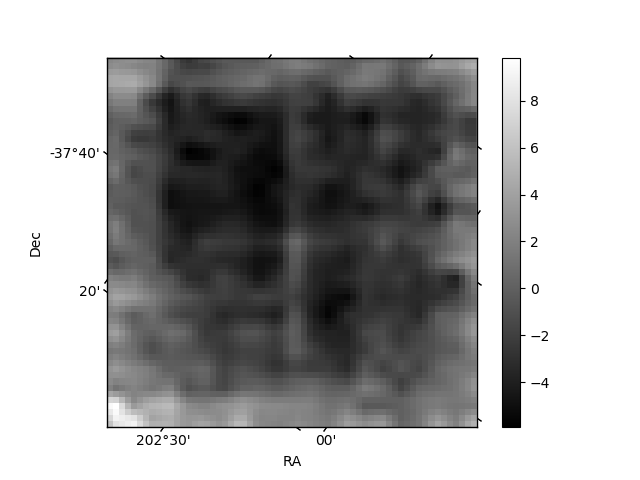
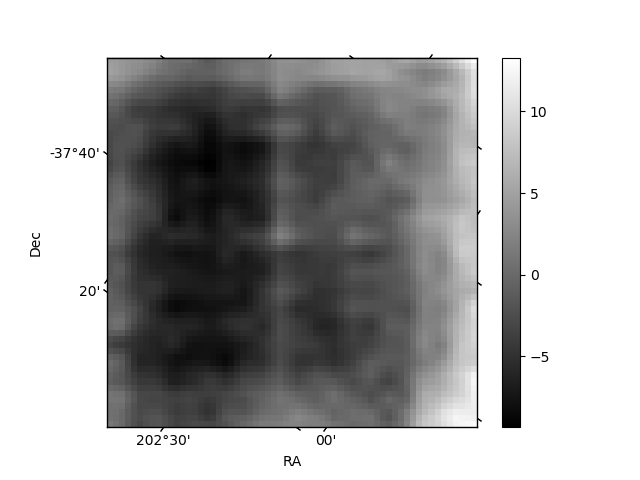
Histogram calculated using DETX and DETY for each event in the final _common_clean file
| Quadrant A | 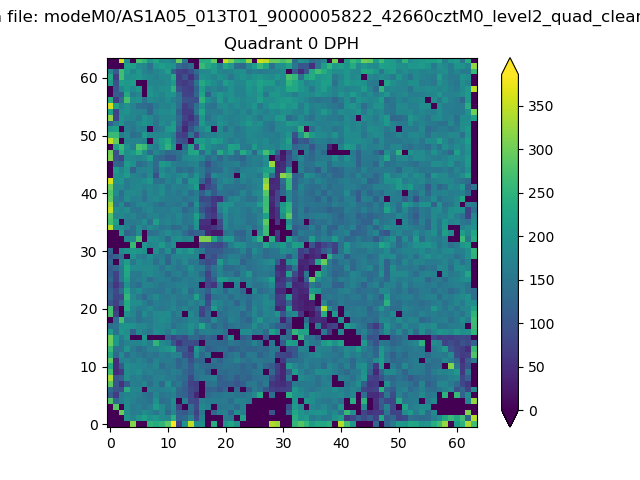 |
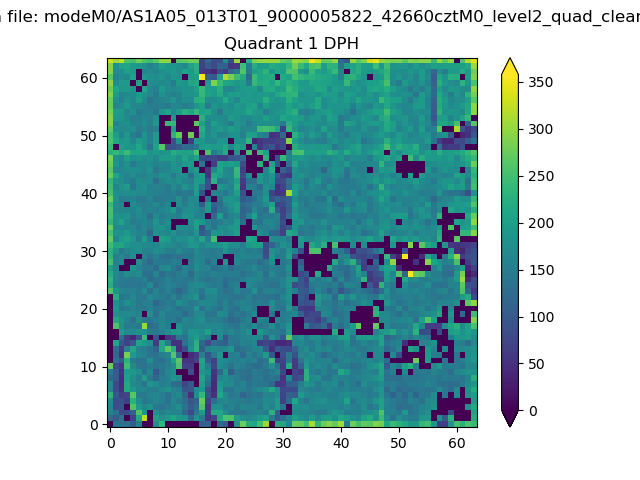 |
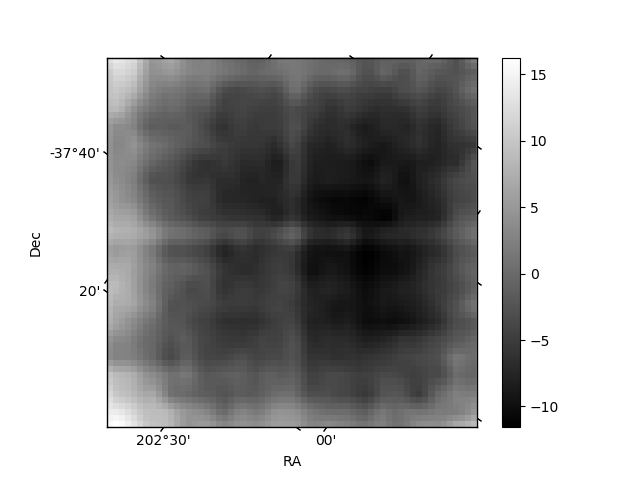
Quadrant B |
|---|---|---|---|
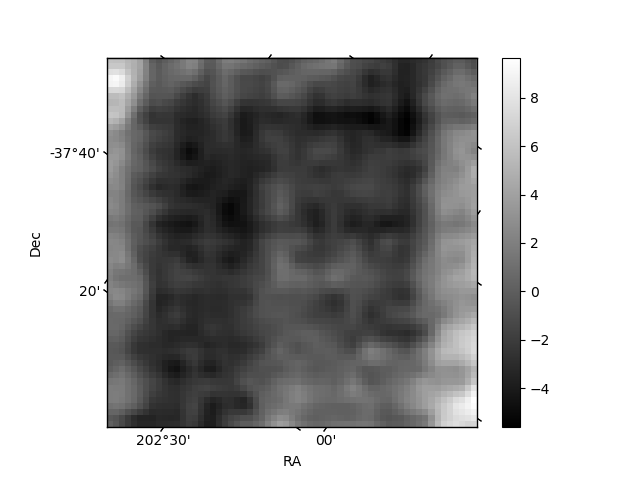
| Quadrant D | 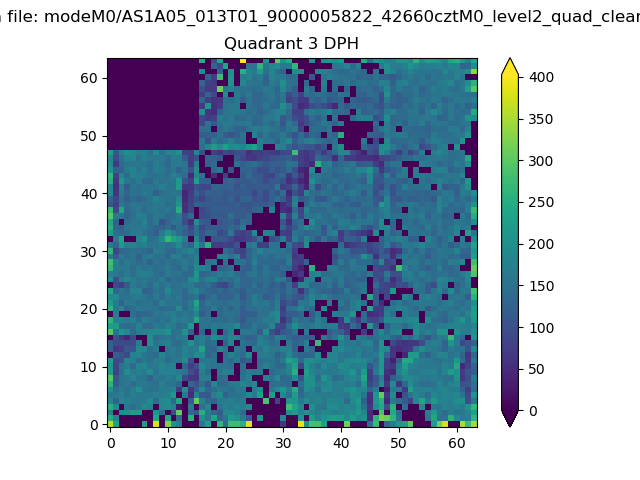 |
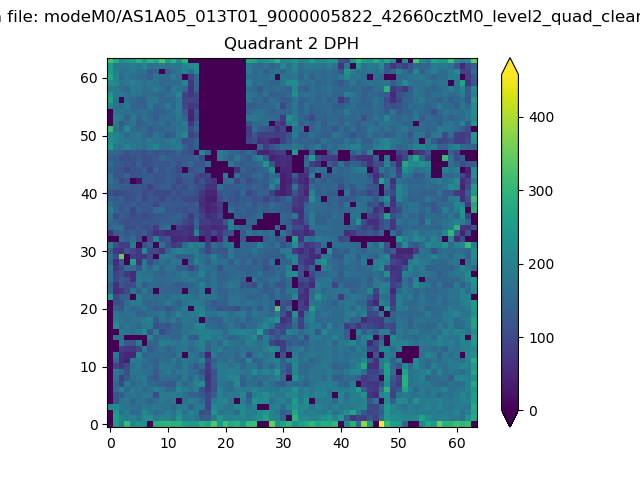 |
Quadrant C |
| Plot type | Count rate plots | Images |
|---|---|---|
| Comparison with Poisson distribution Blue bars denote a histogram of data divided into 1 sec bins. Red curve is a Poisson curve with rate = median count rate of data. |
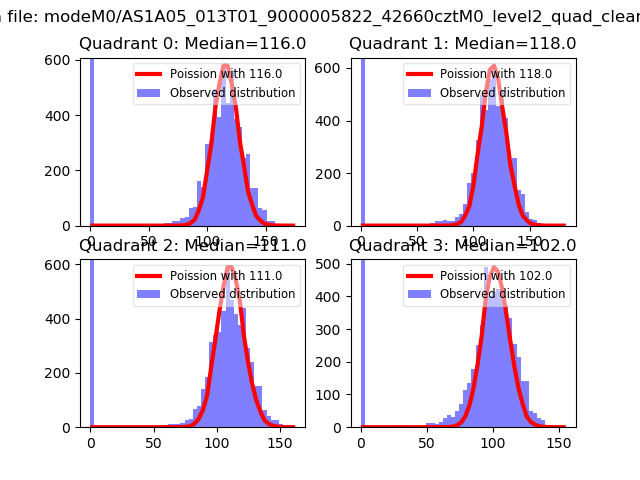 |
 |
| Quadrant-wise count rates Data is divided into 100 sec bins |
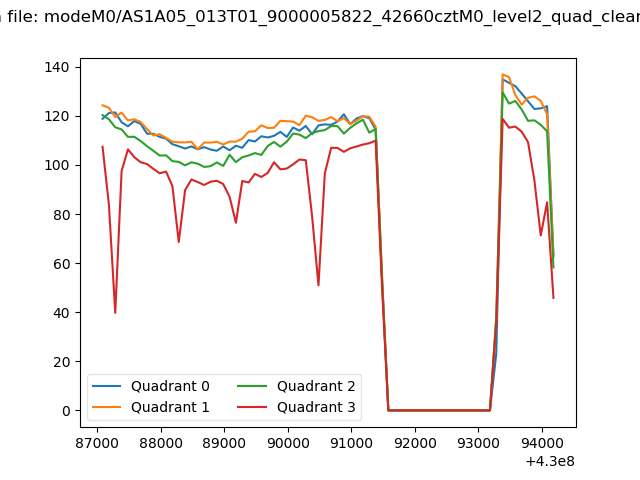 |
|
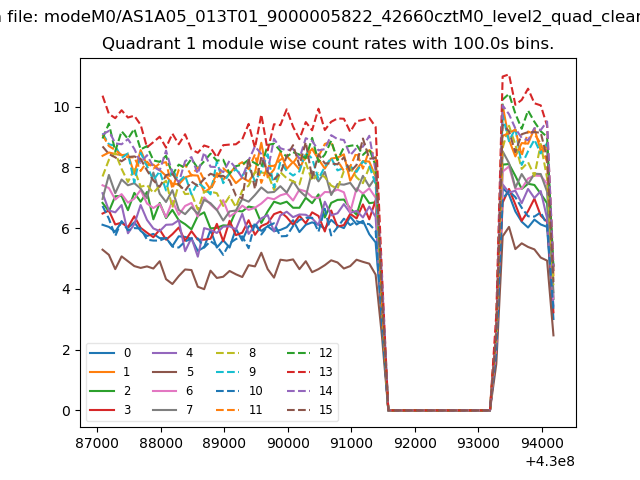
| Module-wise count rates for Quadrant A Data is divided into 100 sec bins |
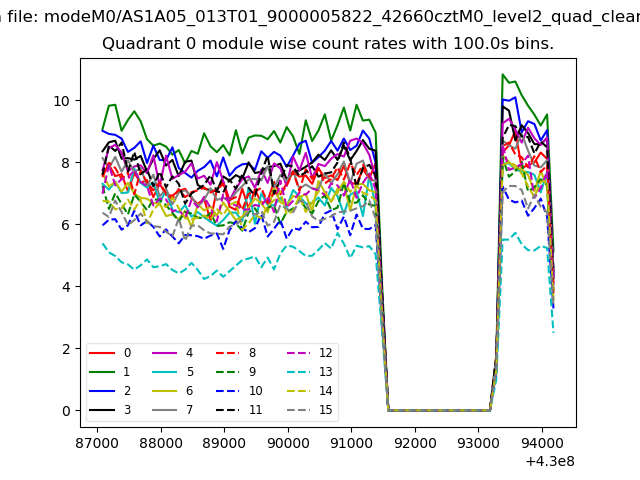 |
 |
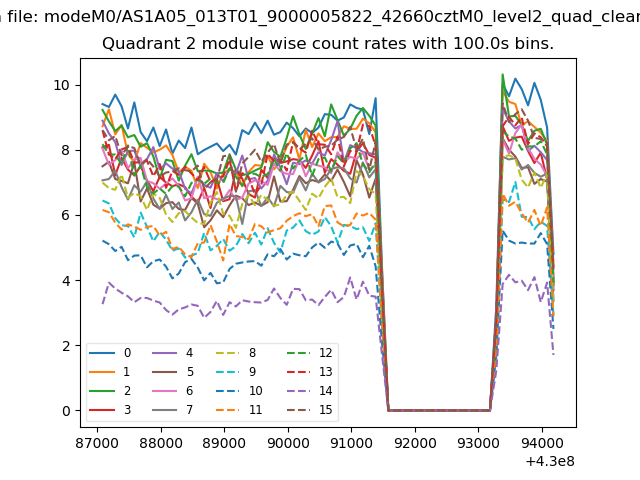
| Module-wise count rates for Quadrant B Data is divided into 100 sec bins |
 |
 |
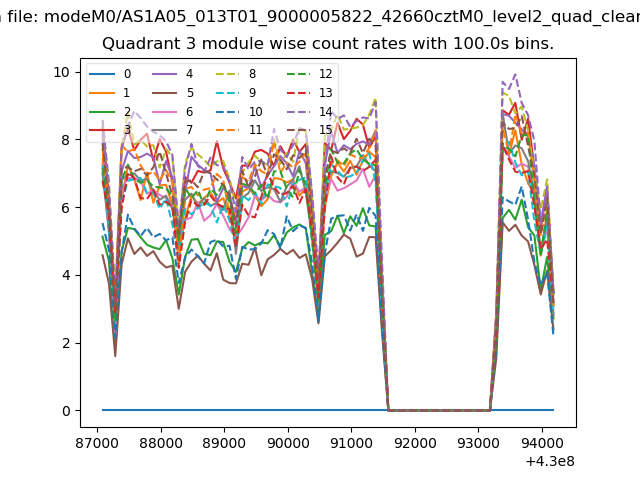
| Module-wise count rates for Quadrant C Data is divided into 100 sec bins |
 |
 |
| Module-wise count rates for Quadrant D Data is divided into 100 sec bins |
 |
 |
| Parameter | Plot |
|---|---|
| CZT HV Monitor | 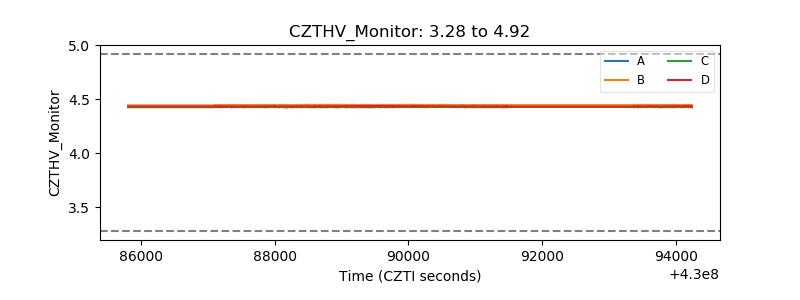 |
| D_VDD | 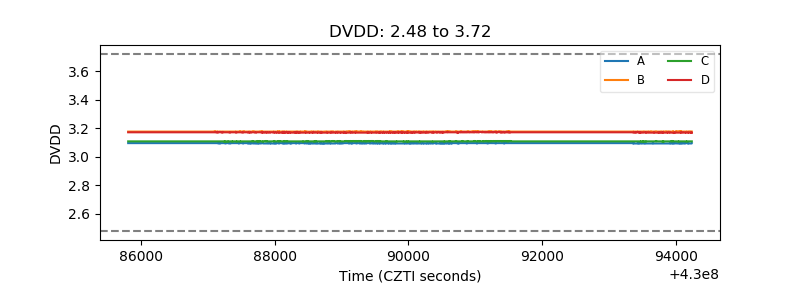 |
| Temperature 1 | 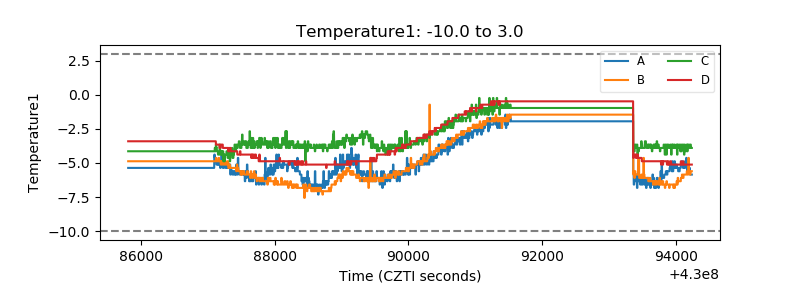 |
| Veto HV Monitor | 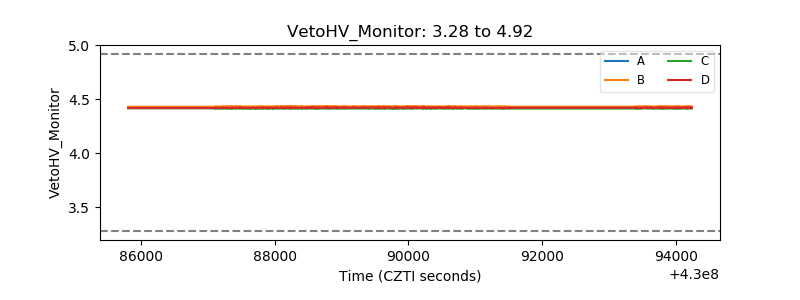 |
| Veto LLD | 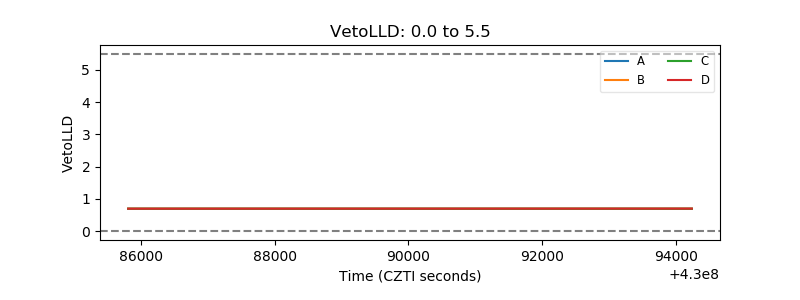 |
| Alpha Counter | 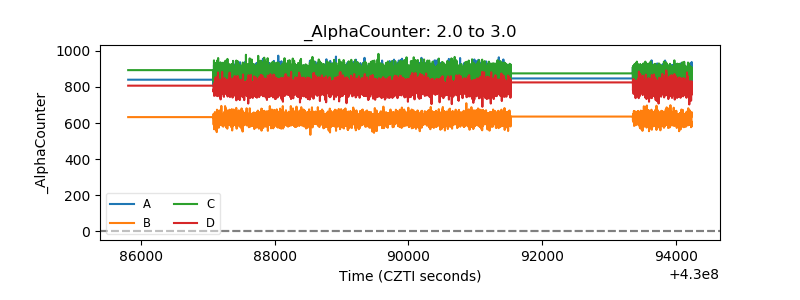 |
| _CPM_Rate | 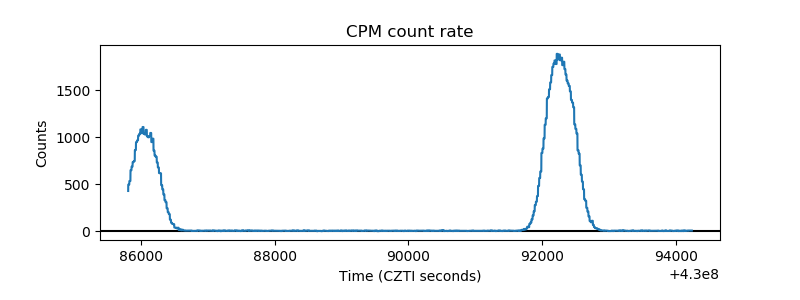 |
| CZT Counter | 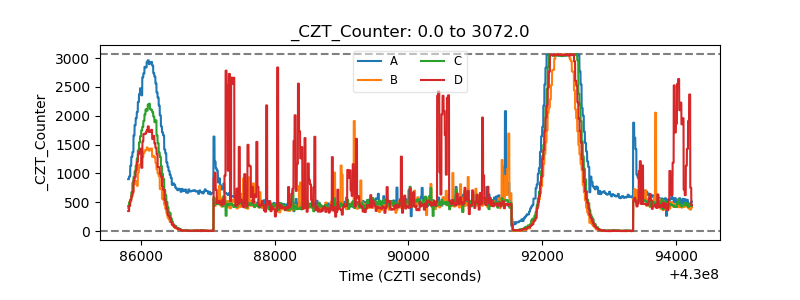 |
| +2.5 Volts monitor | 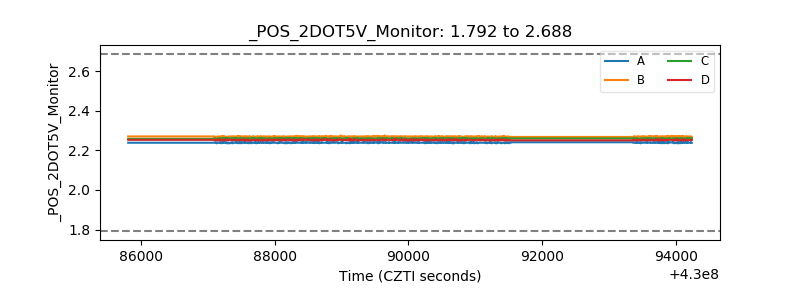 |
| +5 Volts monitor |  |
| _ROLL_ROT | 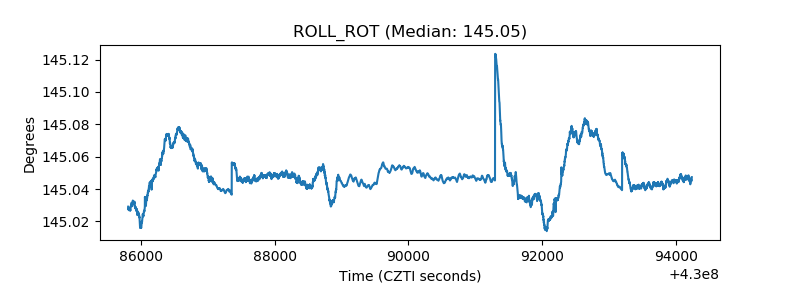 |
| _Roll_DEC | 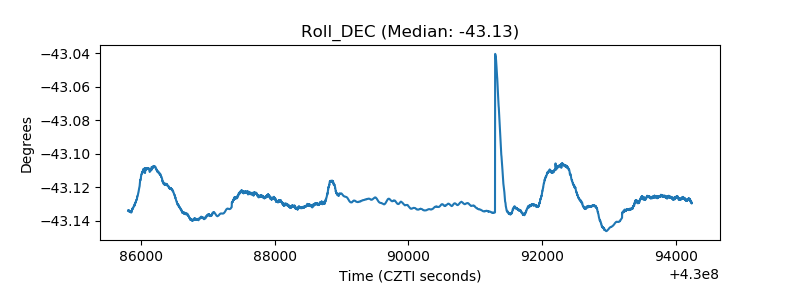 |
| _Roll_RA | 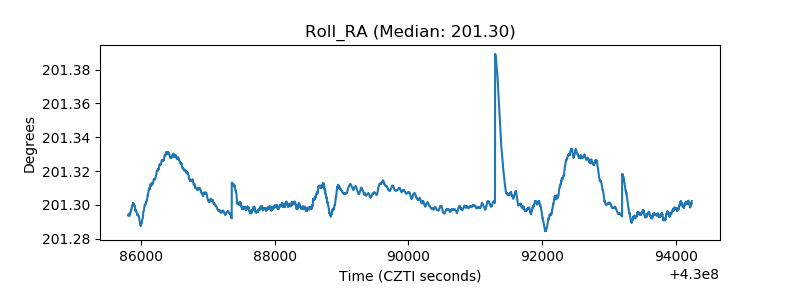 |
| Veto Counter | 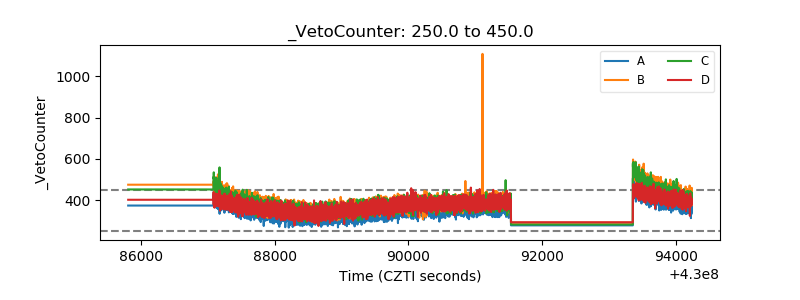 |