| Param | Original file | Final file |
|---|---|---|
| Filename | modeM0/AS1A05_013T01_9000005822_42661cztM0_level2.fits | modeM0/AS1A05_013T01_9000005822_42661cztM0_level2_quad_clean.evt |
| Size (bytes) | 363,291,840 | 89,827,200 |
| Size | 346.5 MB | 85.7 MB |
| Events in quadrant A | 3,030,664 | 625,088 |
| Events in quadrant B | 3,330,266 | 611,304 |
| Events in quadrant C | 2,555,102 | 604,849 |
| Events in quadrant D | 4,129,396 | 517,249 |
| Mode M0 | |||
|---|---|---|---|
| Quadrant | BADHDUFLAG | Total packets | Discarded packets |
| A | 0 | 12033 | 2 |
| B | 0 | 13208 | 2 |
| C | 0 | 10506 | 2 |
| D | 0 | 15845 | 2 |
| Mode M9 | |||
|---|---|---|---|
| Quadrant | BADHDUFLAG | Total packets | Discarded packets |
| A | 0 | 31 | 0 |
| B | 0 | 32 | 0 |
| C | 0 | 32 | 0 |
| D | 0 | 32 | 0 |
| Mode SS | |||
|---|---|---|---|
| Quadrant | BADHDUFLAG | Total packets | Discarded packets |
| A | 0 | 104 | 0 |
| B | 0 | 104 | 0 |
| C | 0 | 104 | 0 |
| D | 0 | 104 | 0 |
| Quadrant | Total seconds | Saturated seconds | Saturation percentage |
|---|---|---|---|
| A | 5167 | 47 | 0.909619% |
| B | 5167 | 298 | 5.767370% |
| C | 5167 | 8 | 0.154829% |
| D | 5167 | 473 | 9.154248% |
Noise dominated data is calculated using 1-second bins in cleaned event files. If a bin has >2000 counts, and if more than 50% of those come from <1% of pixels, then it is considered to be noise-dominated and hence unusable.
| Quadrant | # 1 sec bins | Bins with >0 counts | Bins with >2000 counts | High rate bins dominated by noise | Noise dominated (total time) | Noise dominated (detector-on time) | Marked lightcurve |
|---|---|---|---|---|---|---|---|
| A | 7110 | 5168 | 30 | 30 | 0.42% | 0.58% | 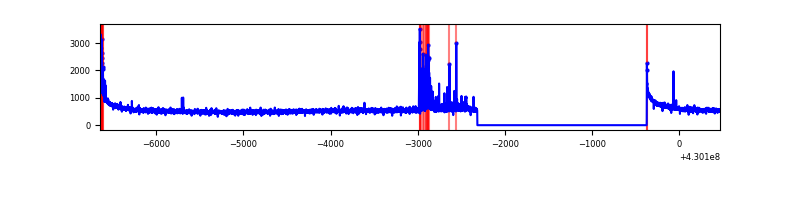 |
| B | 7109 | 5167 | 252 | 252 | 3.54% | 4.88% | 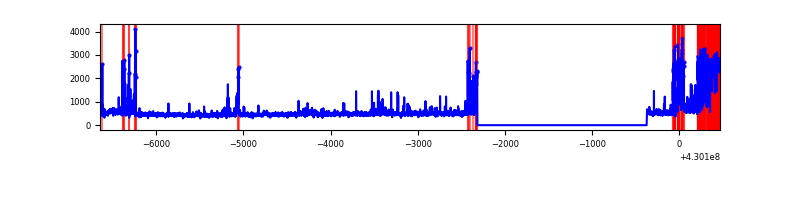 |
| C | 7110 | 5168 | 1 | 1 | 0.01% | 0.02% | 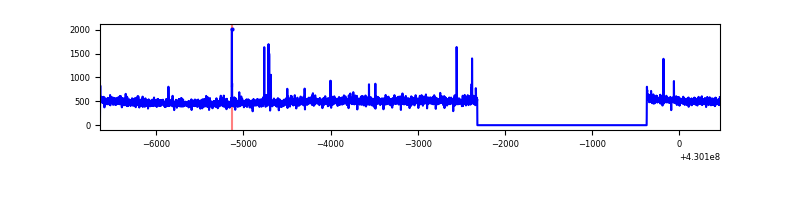 |
| D | 7110 | 5168 | 427 | 427 | 6.01% | 8.26% | 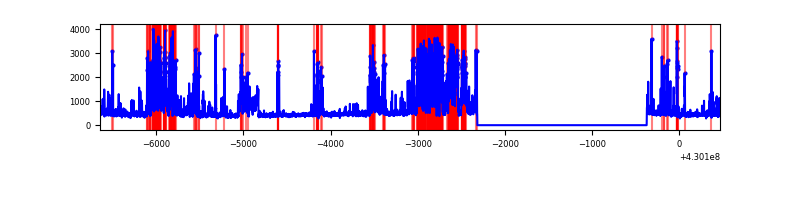 |
Top three noisy pixels from each quadrant. If the there are fewer than three noisy pixels in the level2.evt file, extra rows are filled as -1
| Pixel properties | Quadrant properties | ||||||
|---|---|---|---|---|---|---|---|
| Quadrant | DetID | PixID | Counts | Sigma | Mean | Median | Sigma |
| A | 10 | 83 | 534106 | 4375.97 | 598 | 588 | 121.9 |
| A | 13 | 248 | 152632 | 1247.08 | 598 | 588 | 121.9 |
| A | 15 | 223 | 15280 | 120.51 | 598 | 588 | 121.9 |
| B | 3 | 112 | 767649 | 7011.94 | 581 | 567 | 109.4 |
| B | 10 | 246 | 115934 | 1054.58 | 581 | 567 | 109.4 |
| B | 0 | 245 | 88885 | 807.32 | 581 | 567 | 109.4 |
| C | 15 | 214 | 216059 | 1602.5 | 584 | 588 | 134.5 |
| C | 14 | 254 | 19287 | 139.07 | 584 | 588 | 134.5 |
| C | 8 | 95 | 17226 | 123.74 | 584 | 588 | 134.5 |
| D | 12 | 218 | 807698 | 5857.34 | 563 | 548 | 137.8 |
| D | 2 | 249 | 726641 | 5269.12 | 563 | 548 | 137.8 |
| D | 1 | 52 | 214387 | 1551.79 | 563 | 548 | 137.8 |
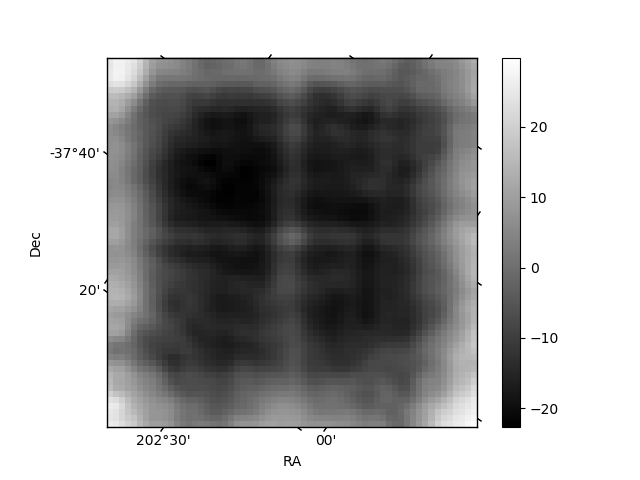
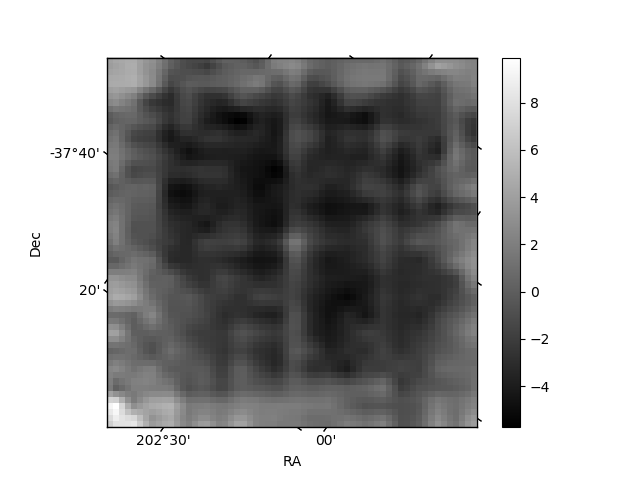
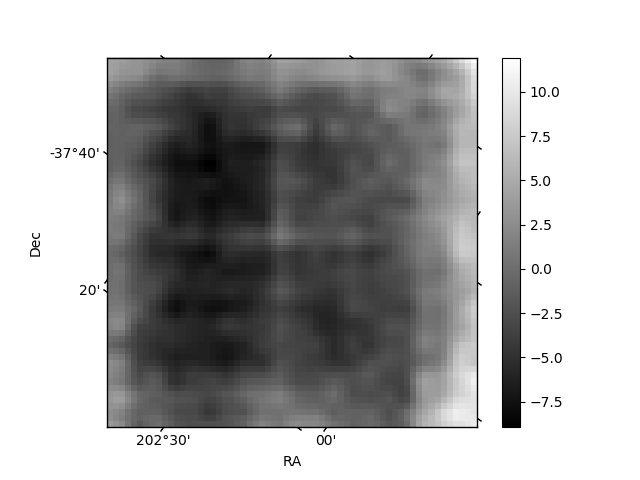
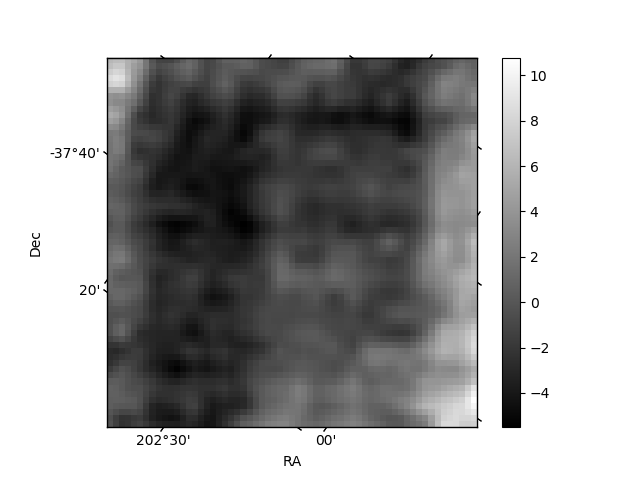
Histogram calculated using DETX and DETY for each event in the final _common_clean file
| Quadrant A | 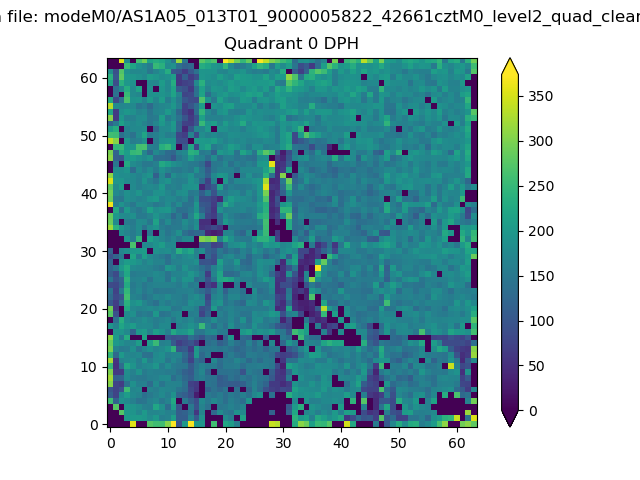 |
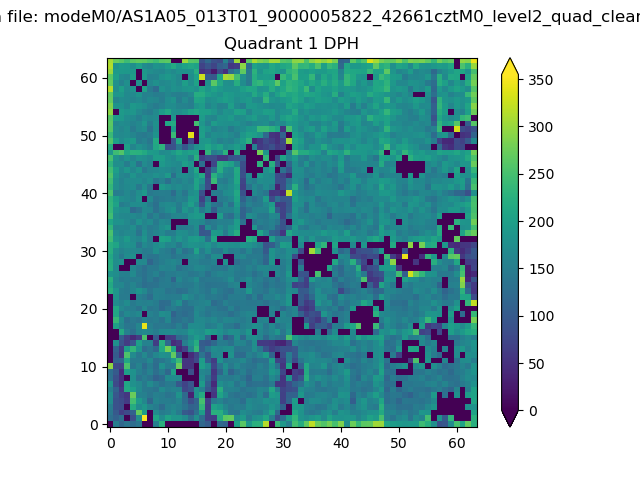 |
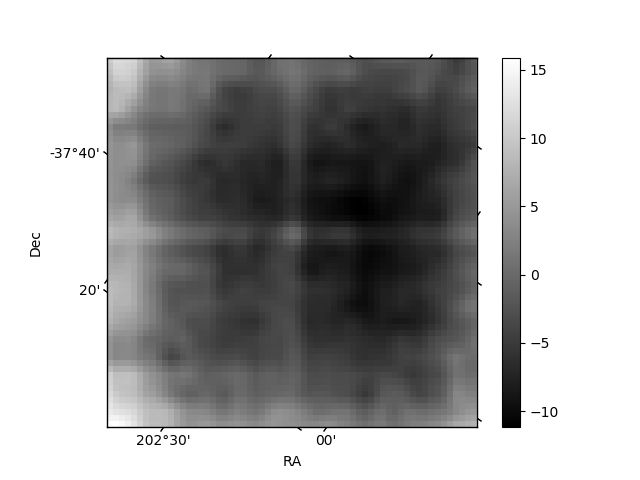
Quadrant B |
|---|---|---|---|
| Quadrant D | 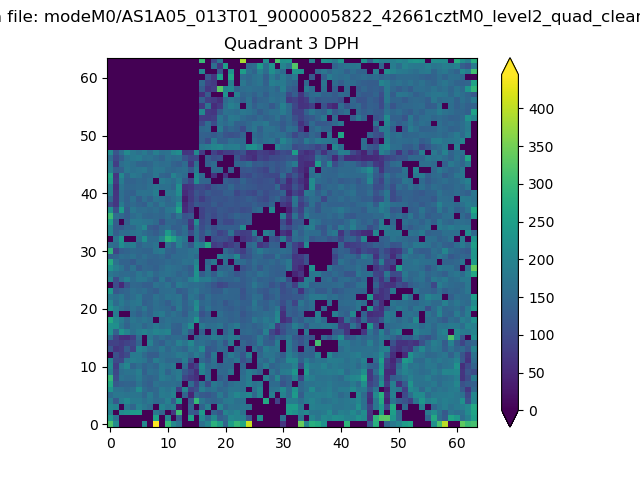 |
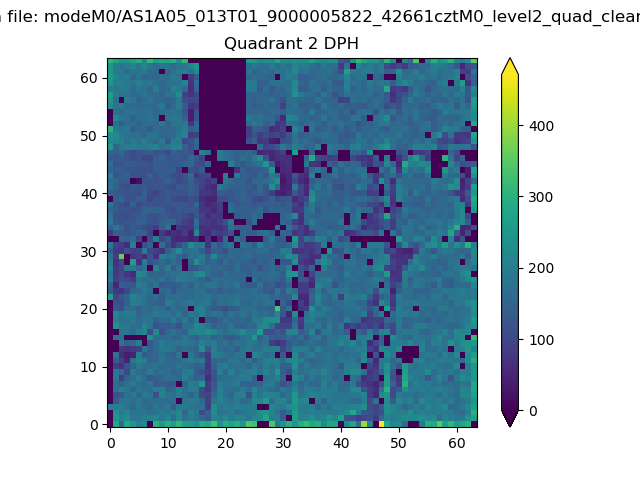 |
Quadrant C |
| Plot type | Count rate plots | Images |
|---|---|---|
| Comparison with Poisson distribution Blue bars denote a histogram of data divided into 1 sec bins. Red curve is a Poisson curve with rate = median count rate of data. |
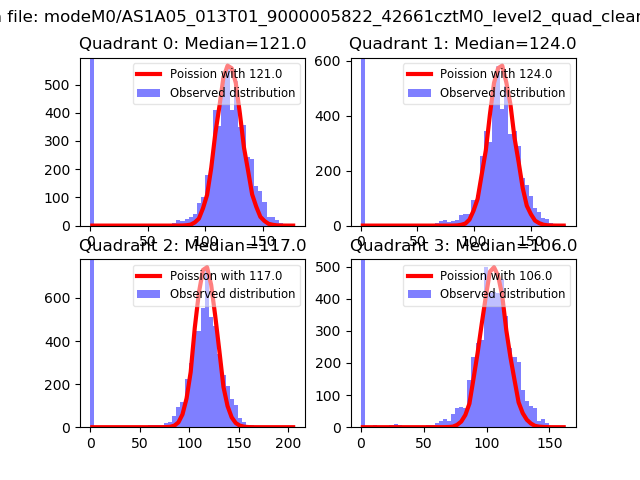 |
 |
| Quadrant-wise count rates Data is divided into 100 sec bins |
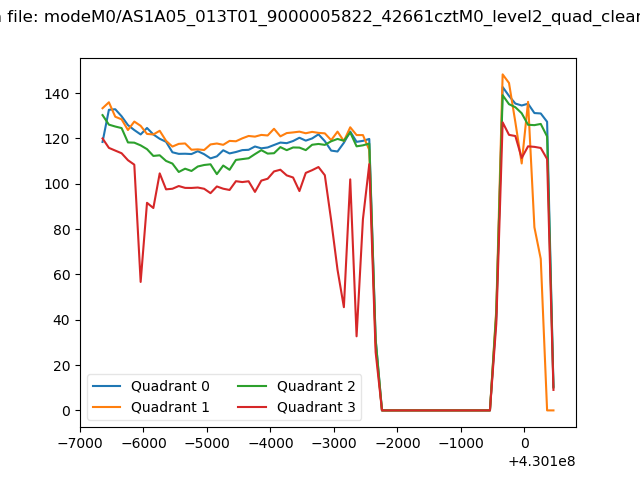 |
|
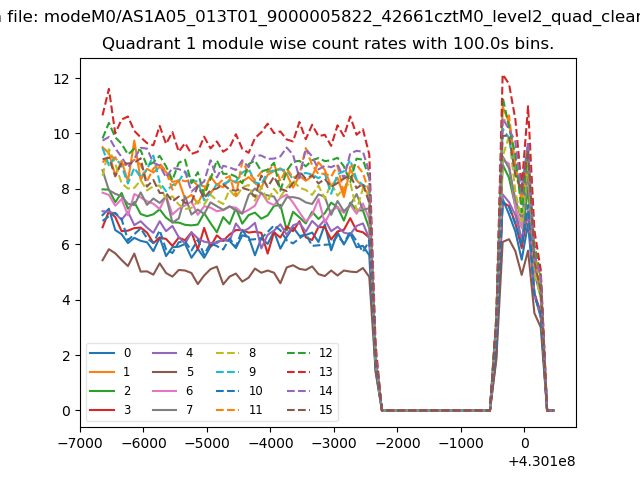
| Module-wise count rates for Quadrant A Data is divided into 100 sec bins |
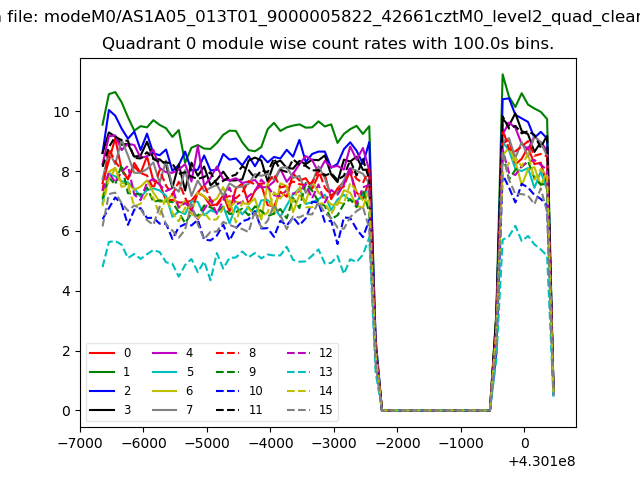 |
 |
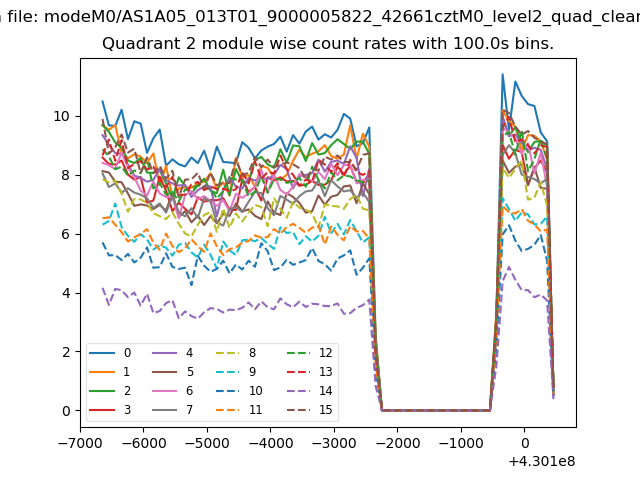
| Module-wise count rates for Quadrant B Data is divided into 100 sec bins |
 |
 |
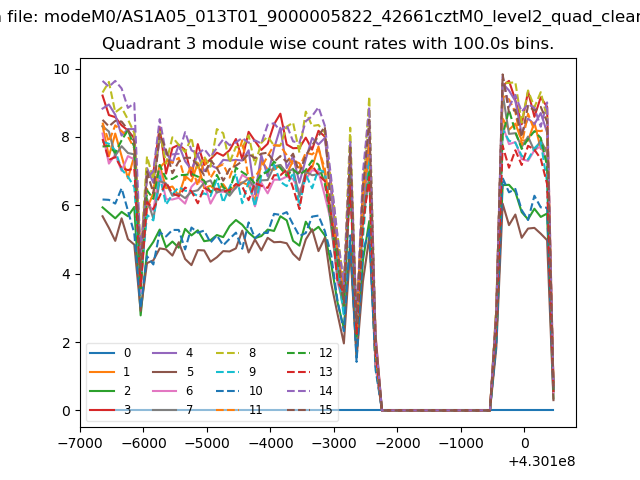
| Module-wise count rates for Quadrant C Data is divided into 100 sec bins |
 |
 |
| Module-wise count rates for Quadrant D Data is divided into 100 sec bins |
 |
 |
| Parameter | Plot |
|---|---|
| CZT HV Monitor | 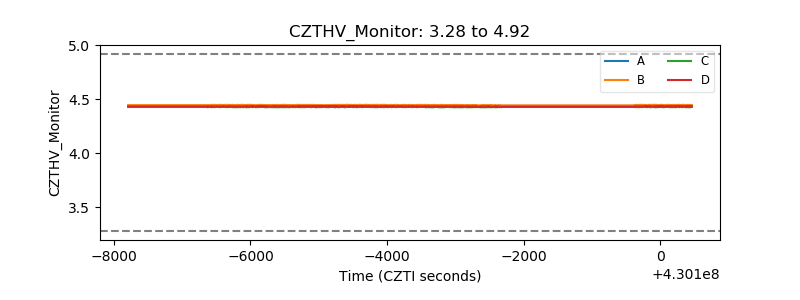 |
| D_VDD | 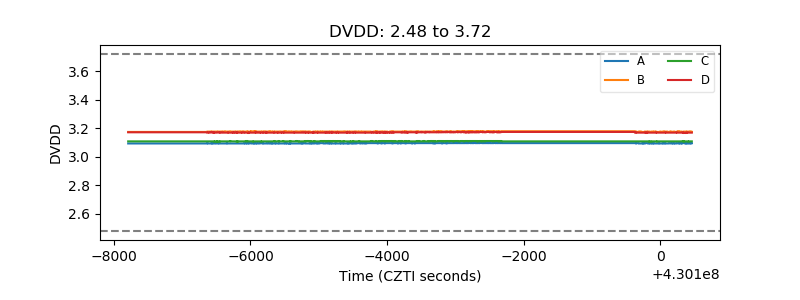 |
| Temperature 1 | 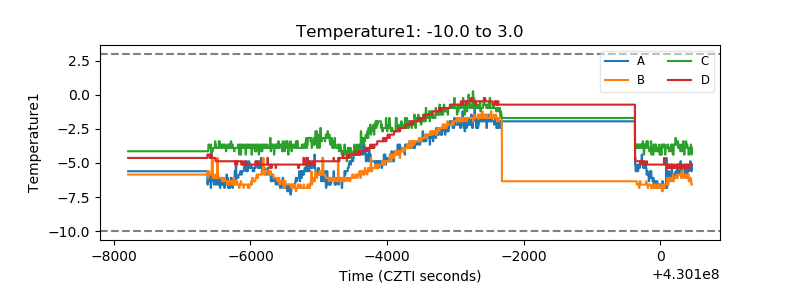 |
| Veto HV Monitor | 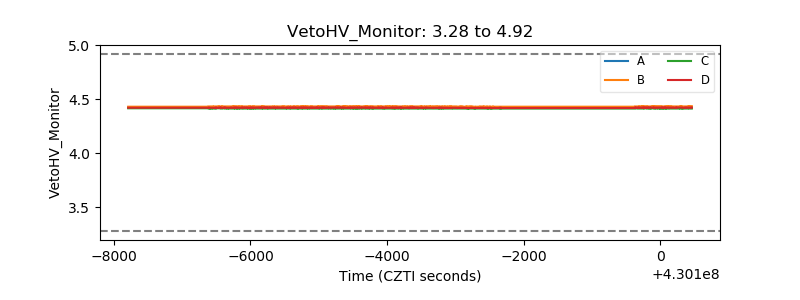 |
| Veto LLD | 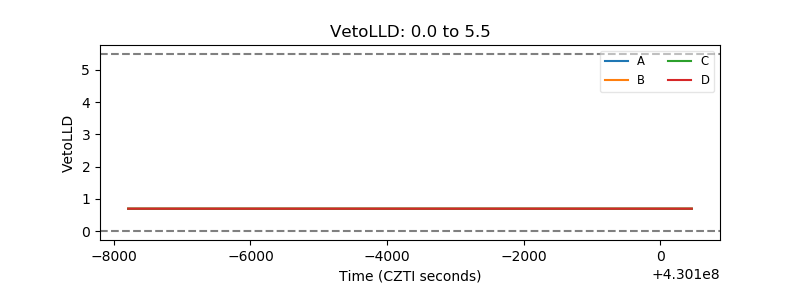 |
| Alpha Counter | 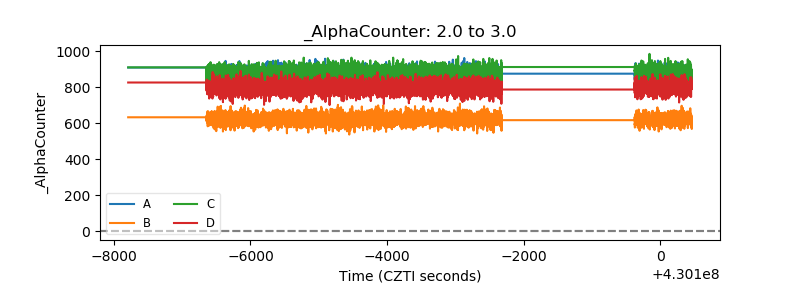 |
| _CPM_Rate | 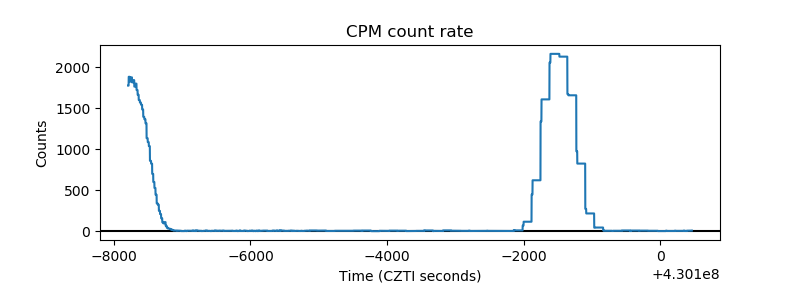 |
| CZT Counter | 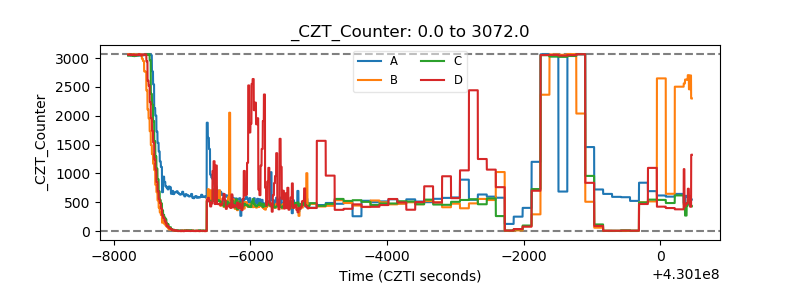 |
| +2.5 Volts monitor | 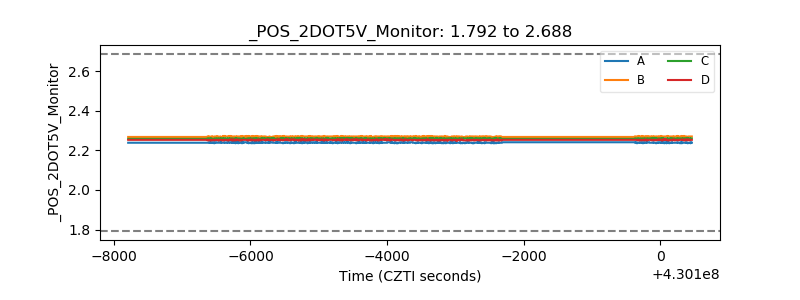 |
| +5 Volts monitor |  |
| _ROLL_ROT | 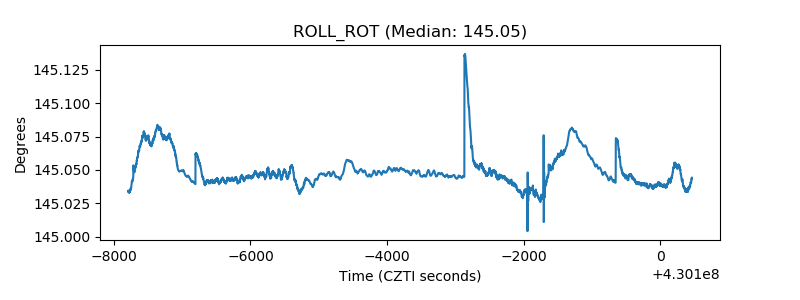 |
| _Roll_DEC | 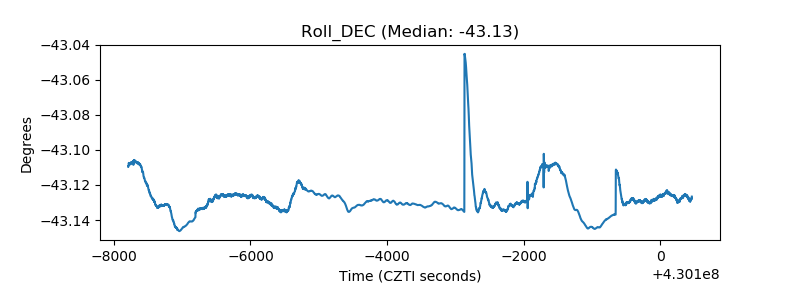 |
| _Roll_RA | 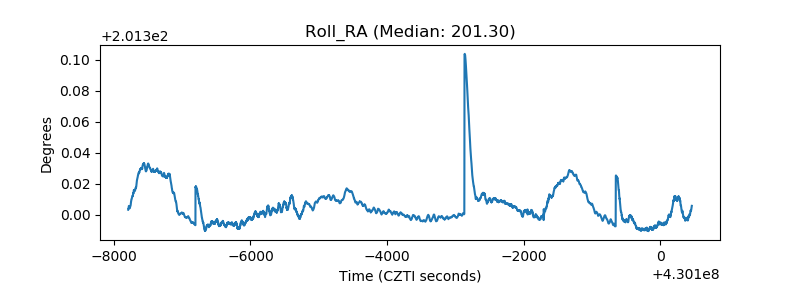 |
| Veto Counter | 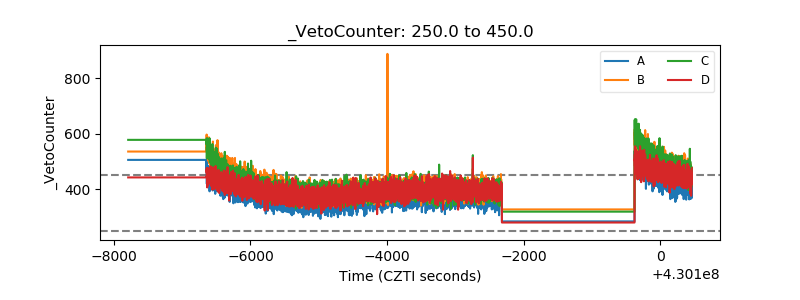 |