| Param | Original file | Final file |
|---|---|---|
| Filename | modeM0/AS1A05_013T01_9000005822_42662cztM0_level2.fits | modeM0/AS1A05_013T01_9000005822_42662cztM0_level2_quad_clean.evt |
| Size (bytes) | 362,004,480 | 93,821,760 |
| Size | 345.2 MB | 89.5 MB |
| Events in quadrant A | 2,987,886 | 657,360 |
| Events in quadrant B | 3,471,282 | 637,021 |
| Events in quadrant C | 2,888,187 | 624,720 |
| Events in quadrant D | 3,649,032 | 558,633 |
| Mode M0 | |||
|---|---|---|---|
| Quadrant | BADHDUFLAG | Total packets | Discarded packets |
| A | 0 | 11780 | 2 |
| B | 0 | 13549 | 2 |
| C | 0 | 11456 | 2 |
| D | 0 | 14313 | 2 |
| Mode M9 | |||
|---|---|---|---|
| Quadrant | BADHDUFLAG | Total packets | Discarded packets |
| A | 0 | 32 | 0 |
| B | 0 | 33 | 0 |
| C | 0 | 33 | 0 |
| D | 0 | 33 | 0 |
| Mode SS | |||
|---|---|---|---|
| Quadrant | BADHDUFLAG | Total packets | Discarded packets |
| A | 0 | 106 | 0 |
| B | 0 | 106 | 0 |
| C | 0 | 106 | 0 |
| D | 0 | 106 | 0 |
| Quadrant | Total seconds | Saturated seconds | Saturation percentage |
|---|---|---|---|
| A | 5186 | 16 | 0.308523% |
| B | 5186 | 352 | 6.787505% |
| C | 5186 | 106 | 2.043965% |
| D | 5186 | 286 | 5.514848% |
Noise dominated data is calculated using 1-second bins in cleaned event files. If a bin has >2000 counts, and if more than 50% of those come from <1% of pixels, then it is considered to be noise-dominated and hence unusable.
| Quadrant | # 1 sec bins | Bins with >0 counts | Bins with >2000 counts | High rate bins dominated by noise | Noise dominated (total time) | Noise dominated (detector-on time) | Marked lightcurve |
|---|---|---|---|---|---|---|---|
| A | 7249 | 5187 | 5 | 5 | 0.07% | 0.10% | 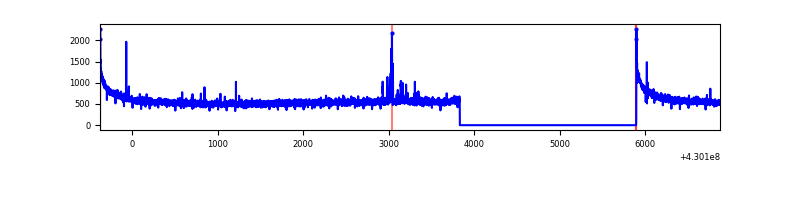 |
| B | 7249 | 5187 | 298 | 298 | 4.11% | 5.75% | 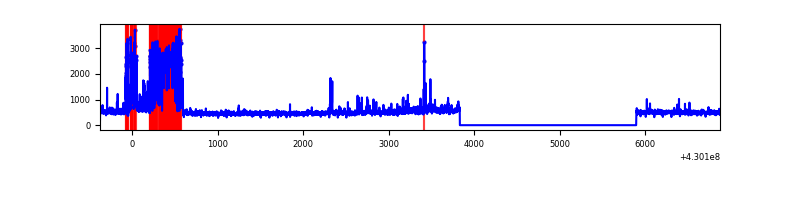 |
| C | 7249 | 5187 | 97 | 97 | 1.34% | 1.87% | 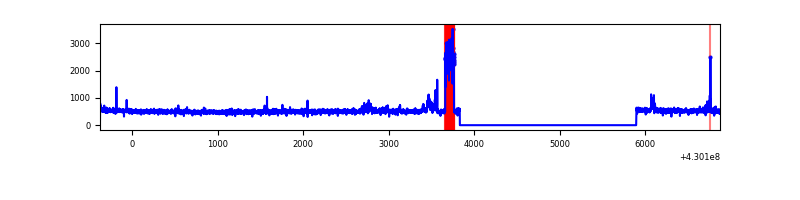 |
| D | 7249 | 5187 | 254 | 254 | 3.50% | 4.90% | 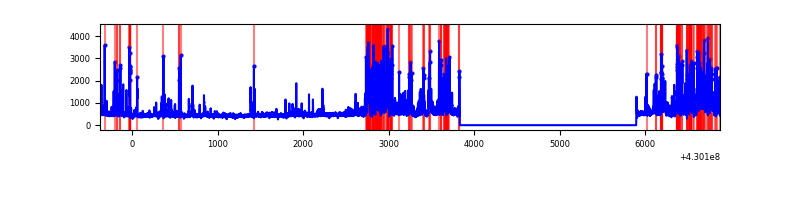 |
Top three noisy pixels from each quadrant. If the there are fewer than three noisy pixels in the level2.evt file, extra rows are filled as -1
| Pixel properties | Quadrant properties | ||||||
|---|---|---|---|---|---|---|---|
| Quadrant | DetID | PixID | Counts | Sigma | Mean | Median | Sigma |
| A | 10 | 83 | 547258 | 4330.75 | 621 | 610 | 126.2 |
| A | 13 | 248 | 29732 | 230.72 | 621 | 610 | 126.2 |
| A | 3 | 137 | 6641 | 47.78 | 621 | 610 | 126.2 |
| B | 3 | 112 | 949082 | 8358.95 | 596 | 581 | 113.5 |
| B | 0 | 245 | 85007 | 744.03 | 596 | 581 | 113.5 |
| B | 0 | 229 | 47876 | 416.8 | 596 | 581 | 113.5 |
| C | 9 | 54 | 245670 | 1757.72 | 603 | 606 | 139.4 |
| C | 15 | 214 | 216257 | 1546.76 | 603 | 606 | 139.4 |
| C | 8 | 95 | 57839 | 410.5 | 603 | 606 | 139.4 |
| D | 2 | 249 | 450458 | 3149.53 | 588 | 572 | 142.8 |
| D | 12 | 233 | 242745 | 1695.39 | 588 | 572 | 142.8 |
| D | 13 | 249 | 231250 | 1614.92 | 588 | 572 | 142.8 |
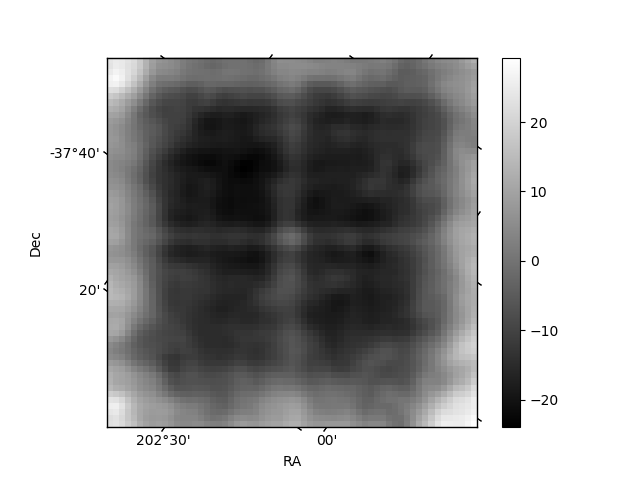
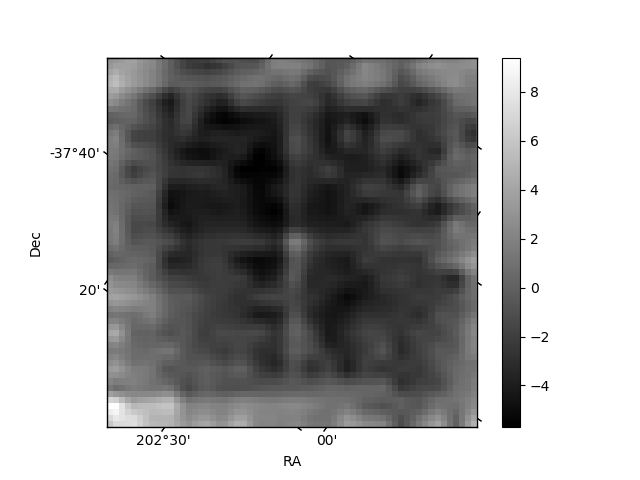
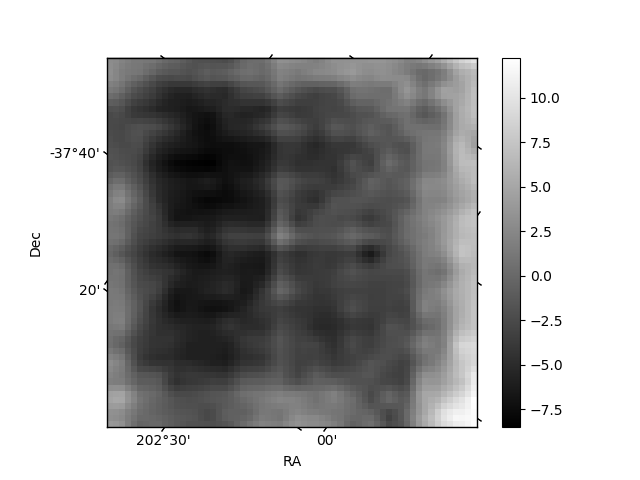
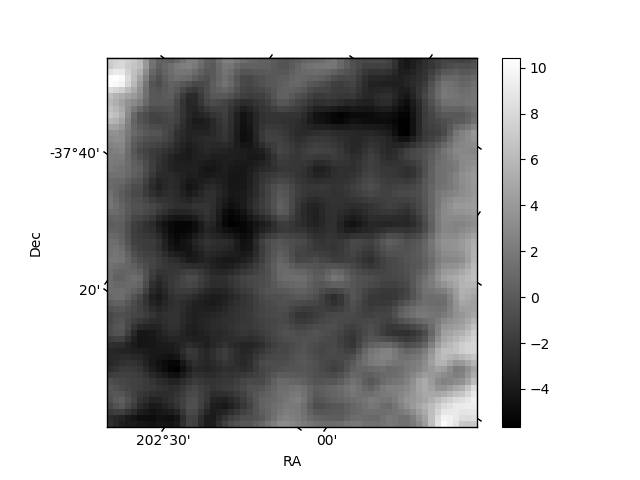
Histogram calculated using DETX and DETY for each event in the final _common_clean file
| Quadrant A | 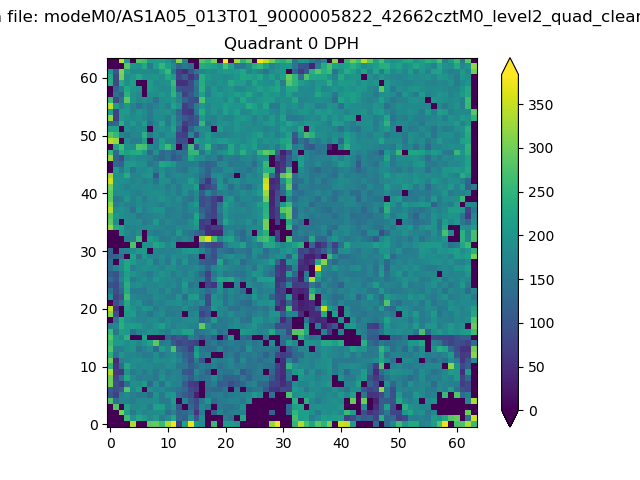 |
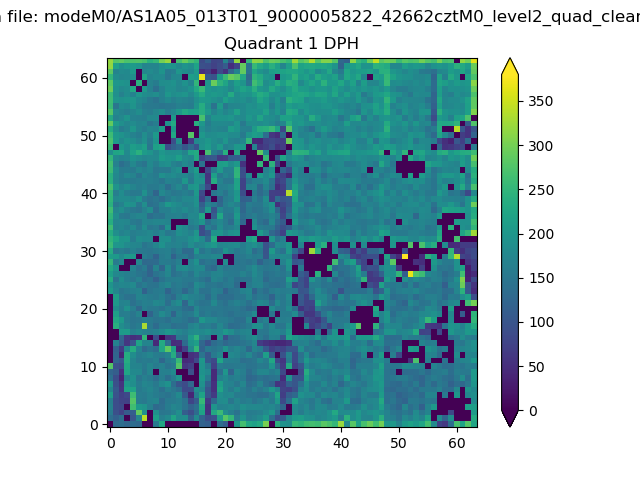 |
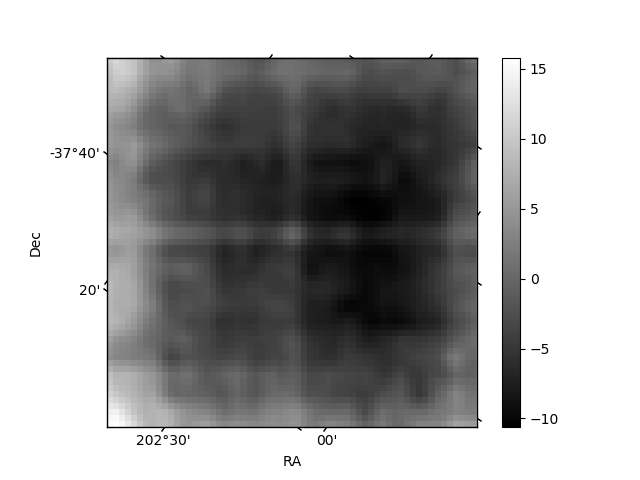
Quadrant B |
|---|---|---|---|
| Quadrant D | 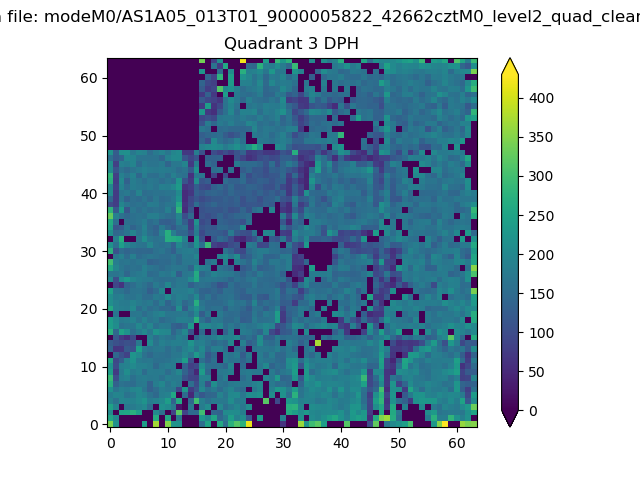 |
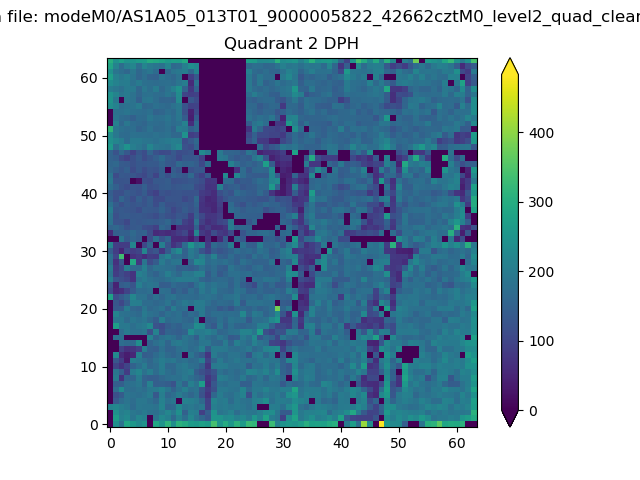 |
Quadrant C |
| Plot type | Count rate plots | Images |
|---|---|---|
| Comparison with Poisson distribution Blue bars denote a histogram of data divided into 1 sec bins. Red curve is a Poisson curve with rate = median count rate of data. |
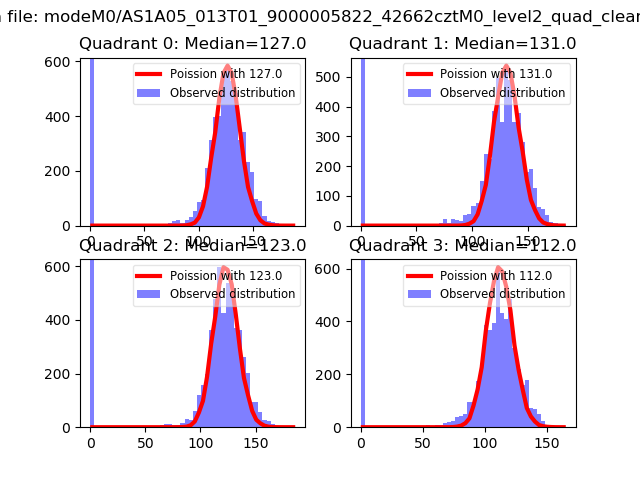 |
 |
| Quadrant-wise count rates Data is divided into 100 sec bins |
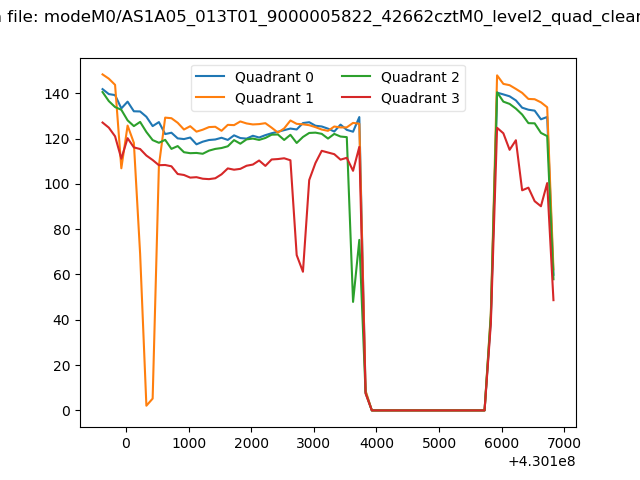 |
|
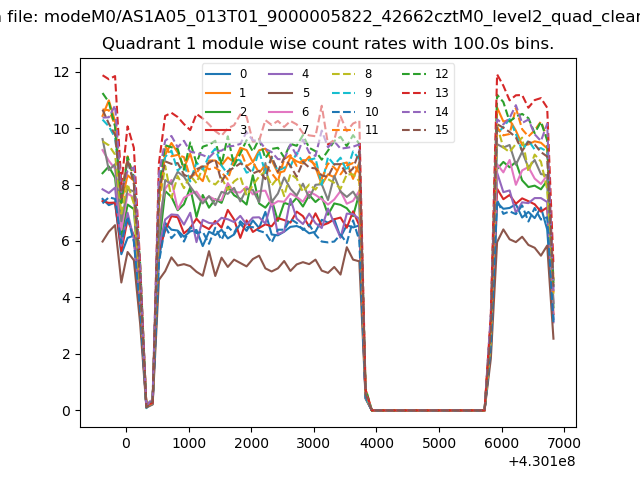
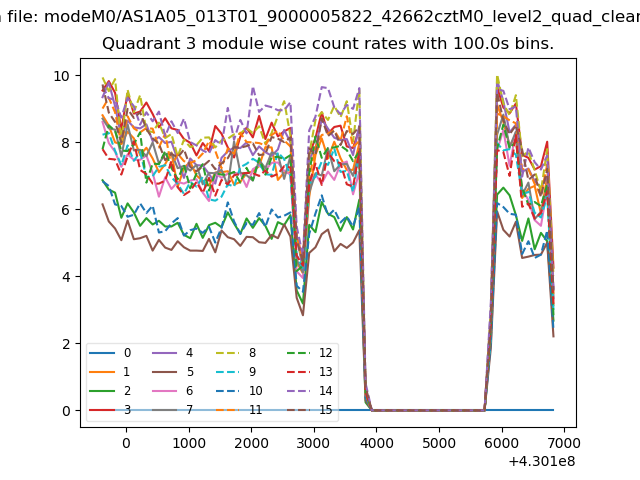
| Module-wise count rates for Quadrant A Data is divided into 100 sec bins |
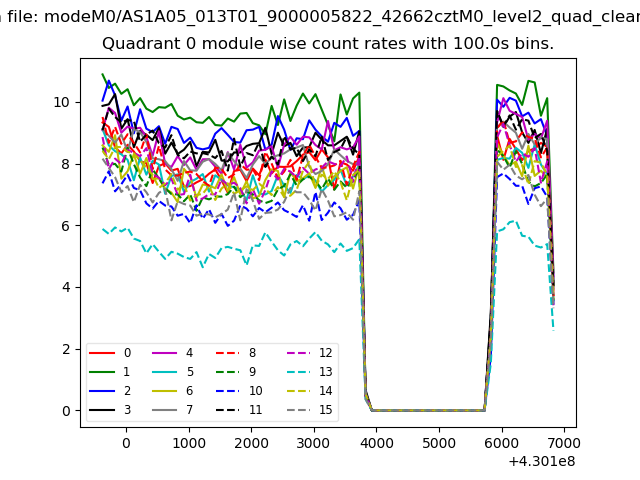 |
 |
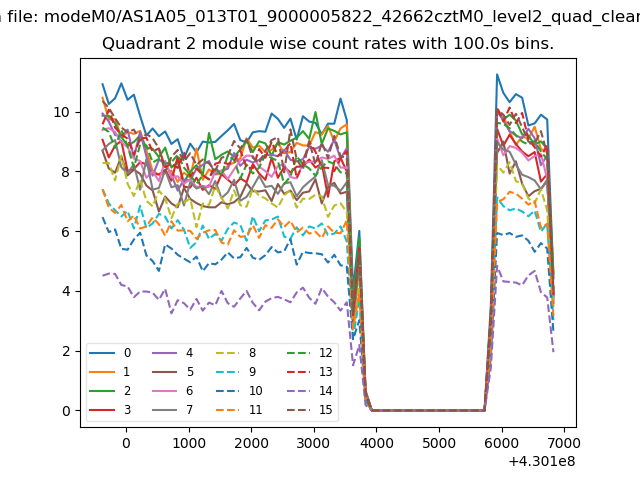
| Module-wise count rates for Quadrant B Data is divided into 100 sec bins |
 |
 |
| Module-wise count rates for Quadrant C Data is divided into 100 sec bins |
 |
 |
| Module-wise count rates for Quadrant D Data is divided into 100 sec bins |
 |
 |
| Parameter | Plot |
|---|---|
| CZT HV Monitor |  |
| D_VDD | 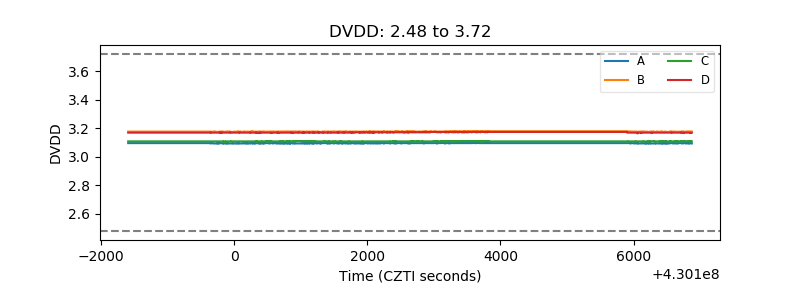 |
| Temperature 1 | 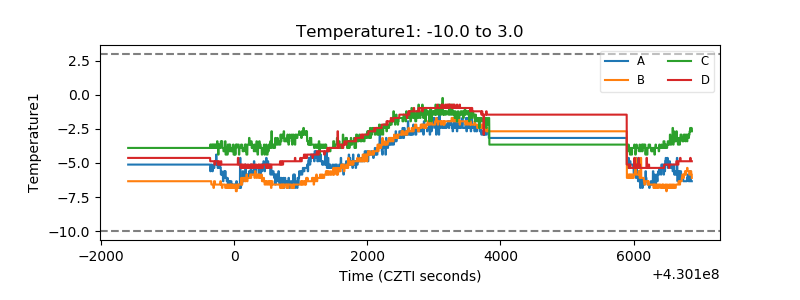 |
| Veto HV Monitor | 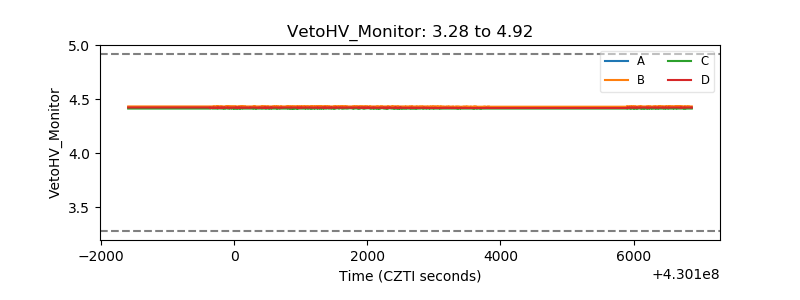 |
| Veto LLD | 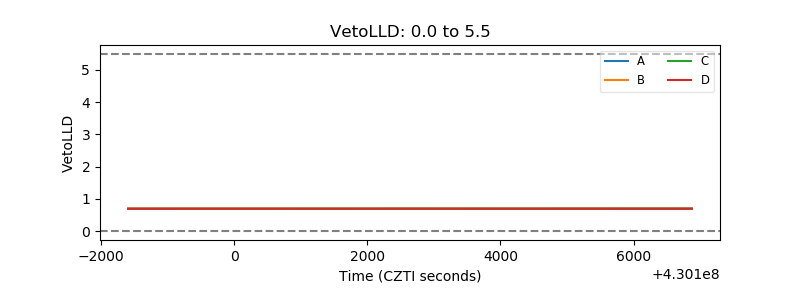 |
| Alpha Counter | 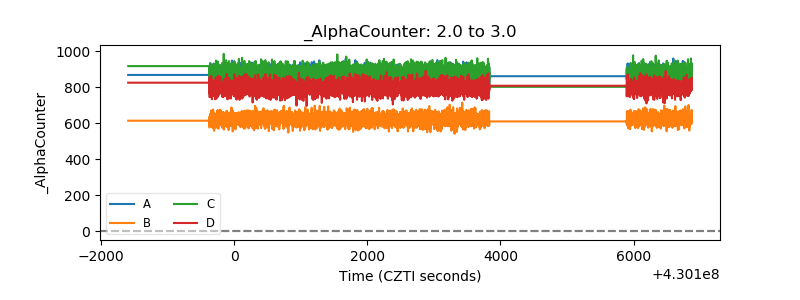 |
| _CPM_Rate | 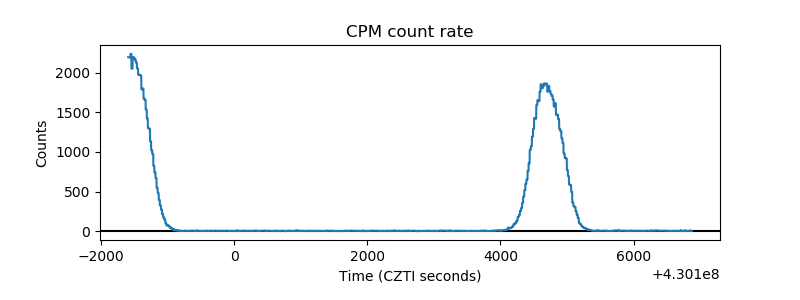 |
| CZT Counter | 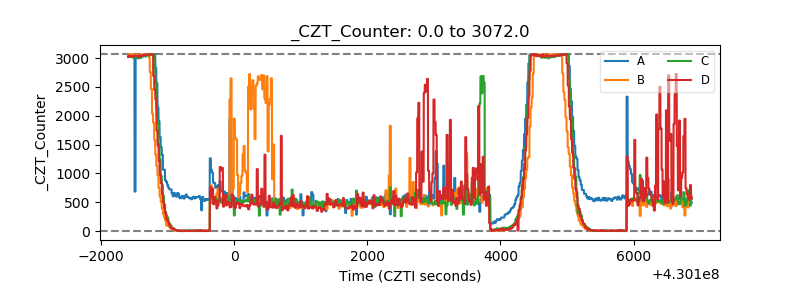 |
| +2.5 Volts monitor | 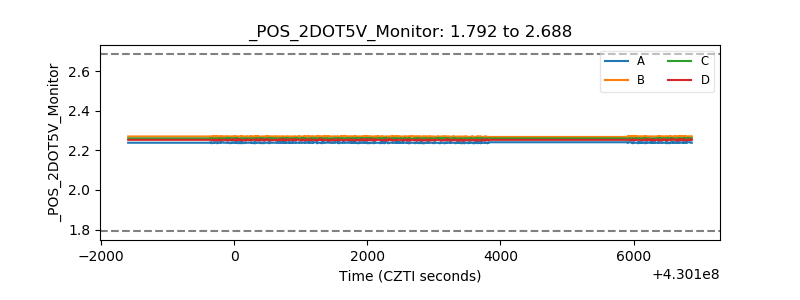 |
| +5 Volts monitor |  |
| _ROLL_ROT | 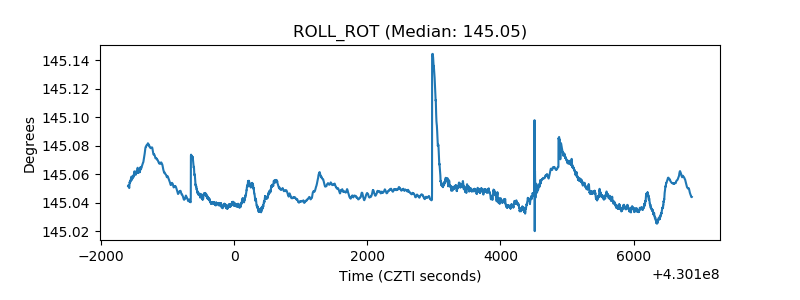 |
| _Roll_DEC | 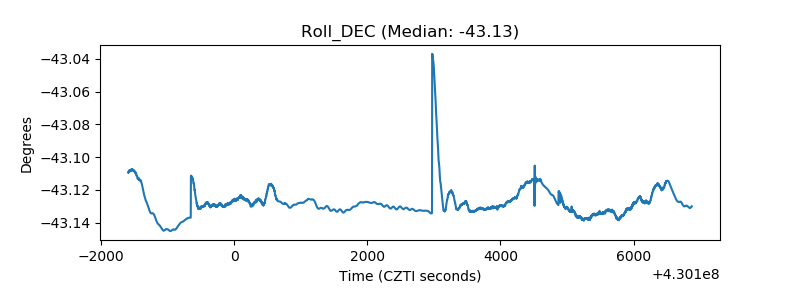 |
| _Roll_RA | 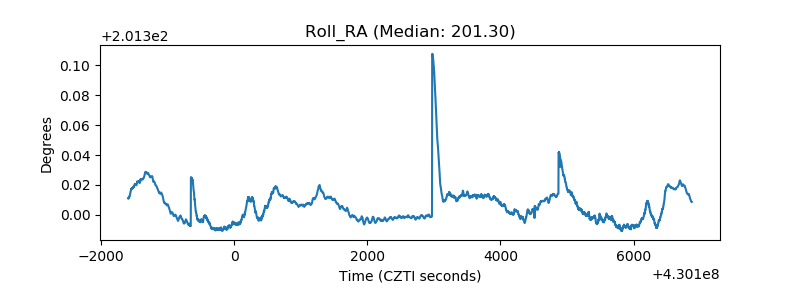 |
| Veto Counter | 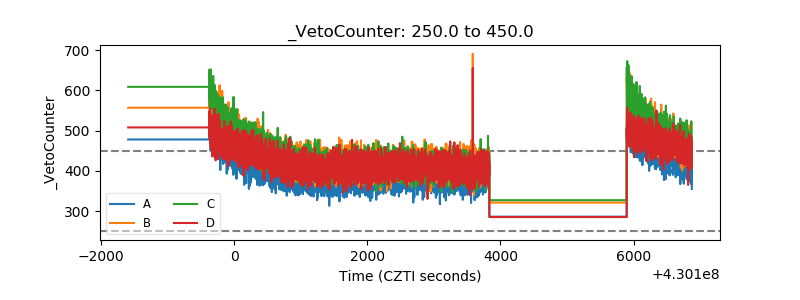 |