| Param | Original file | Final file |
|---|---|---|
| Filename | modeM0/AS1A05_013T01_9000005822_42663cztM0_level2.fits | modeM0/AS1A05_013T01_9000005822_42663cztM0_level2_quad_clean.evt |
| Size (bytes) | 353,727,360 | 93,314,880 |
| Size | 337.3 MB | 89.0 MB |
| Events in quadrant A | 3,131,388 | 639,126 |
| Events in quadrant B | 2,804,191 | 663,521 |
| Events in quadrant C | 2,737,327 | 625,920 |
| Events in quadrant D | 4,024,196 | 539,628 |
| Mode M0 | |||
|---|---|---|---|
| Quadrant | BADHDUFLAG | Total packets | Discarded packets |
| A | 0 | 12235 | 2 |
| B | 0 | 11472 | 2 |
| C | 0 | 10883 | 2 |
| D | 0 | 15264 | 2 |
| Mode M9 | |||
|---|---|---|---|
| Quadrant | BADHDUFLAG | Total packets | Discarded packets |
| A | 0 | 33 | 0 |
| B | 0 | 34 | 0 |
| C | 0 | 34 | 0 |
| D | 0 | 34 | 0 |
| Mode SS | |||
|---|---|---|---|
| Quadrant | BADHDUFLAG | Total packets | Discarded packets |
| A | 0 | 106 | 0 |
| B | 0 | 106 | 0 |
| C | 0 | 106 | 0 |
| D | 0 | 106 | 0 |
| Quadrant | Total seconds | Saturated seconds | Saturation percentage |
|---|---|---|---|
| A | 5098 | 72 | 1.412319% |
| B | 5098 | 31 | 0.608082% |
| C | 5098 | 34 | 0.666928% |
| D | 5098 | 389 | 7.630443% |
Noise dominated data is calculated using 1-second bins in cleaned event files. If a bin has >2000 counts, and if more than 50% of those come from <1% of pixels, then it is considered to be noise-dominated and hence unusable.
| Quadrant | # 1 sec bins | Bins with >0 counts | Bins with >2000 counts | High rate bins dominated by noise | Noise dominated (total time) | Noise dominated (detector-on time) | Marked lightcurve |
|---|---|---|---|---|---|---|---|
| A | 7221 | 5099 | 52 | 52 | 0.72% | 1.02% | 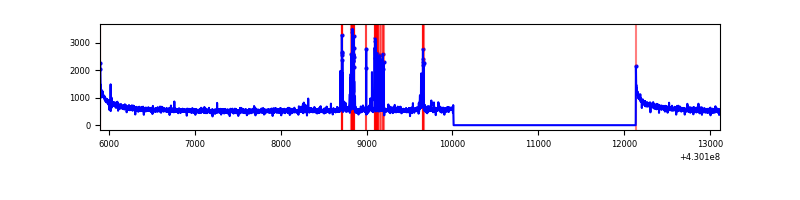 |
| B | 7221 | 5099 | 10 | 10 | 0.14% | 0.20% | 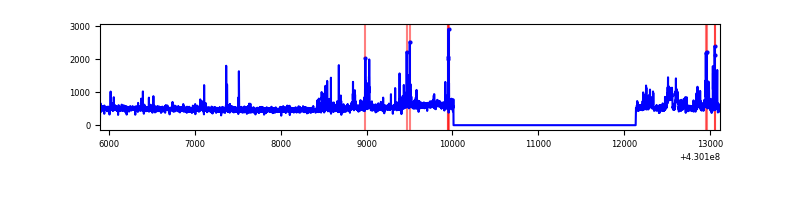 |
| C | 7221 | 5099 | 30 | 30 | 0.42% | 0.59% | 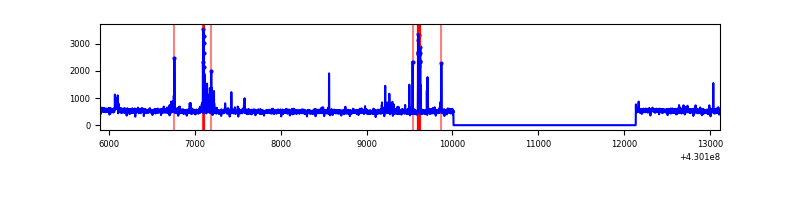 |
| D | 7221 | 5099 | 323 | 323 | 4.47% | 6.33% | 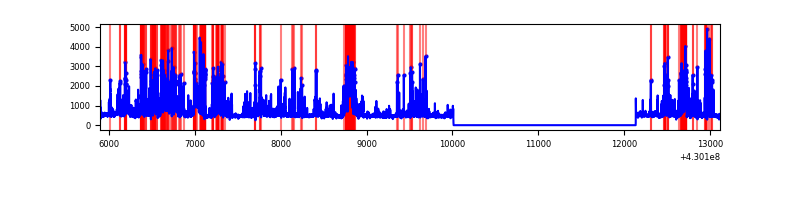 |
Top three noisy pixels from each quadrant. If the there are fewer than three noisy pixels in the level2.evt file, extra rows are filled as -1
| Pixel properties | Quadrant properties | ||||||
|---|---|---|---|---|---|---|---|
| Quadrant | DetID | PixID | Counts | Sigma | Mean | Median | Sigma |
| A | 10 | 83 | 547293 | 4371.44 | 610 | 600 | 125.1 |
| A | 15 | 223 | 139891 | 1113.79 | 610 | 600 | 125.1 |
| A | 13 | 248 | 77034 | 611.18 | 610 | 600 | 125.1 |
| B | 0 | 245 | 103164 | 886.4 | 606 | 590 | 115.7 |
| B | 0 | 229 | 79627 | 683.01 | 606 | 590 | 115.7 |
| B | 10 | 247 | 78662 | 674.67 | 606 | 590 | 115.7 |
| C | 15 | 214 | 214014 | 1537.4 | 599 | 602 | 138.8 |
| C | 14 | 254 | 148649 | 1066.52 | 599 | 602 | 138.8 |
| C | 15 | 111 | 13233 | 90.99 | 599 | 602 | 138.8 |
| D | 2 | 249 | 635437 | 4586.1 | 577 | 562 | 138.4 |
| D | 13 | 249 | 443261 | 3197.9 | 577 | 562 | 138.4 |
| D | 1 | 47 | 413047 | 2979.64 | 577 | 562 | 138.4 |
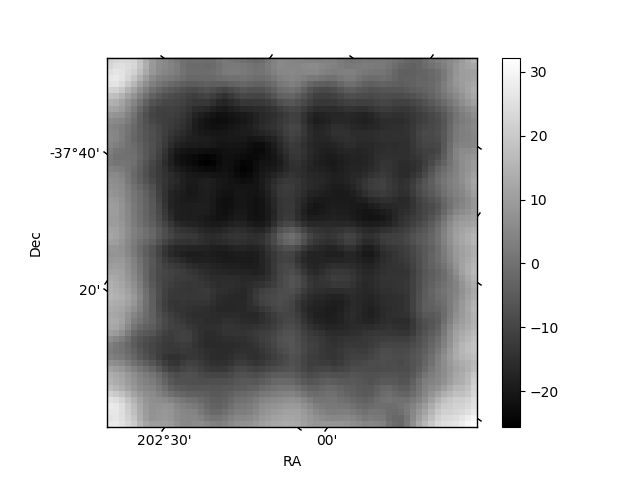
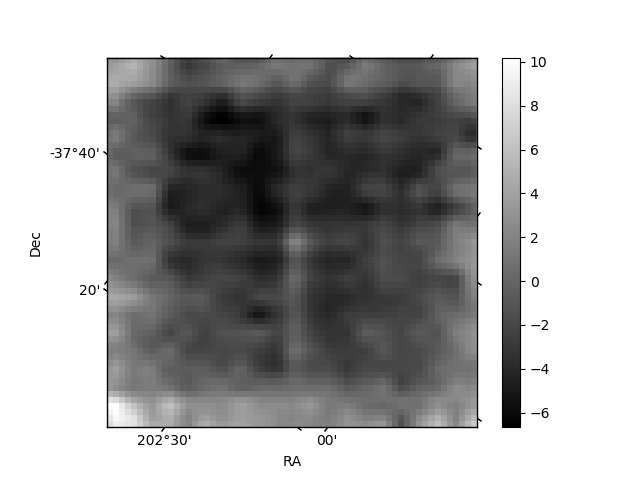
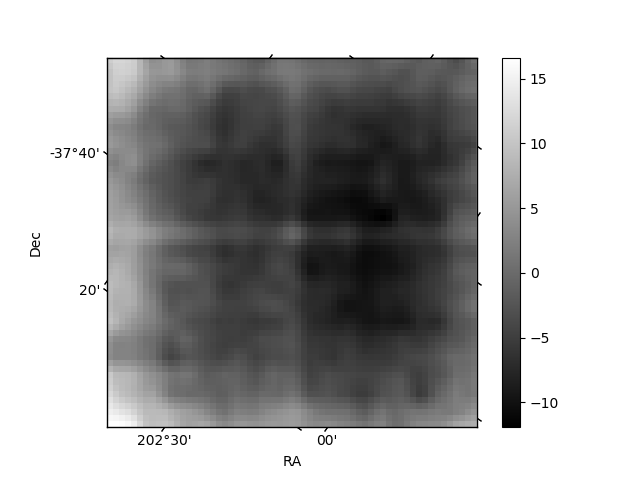
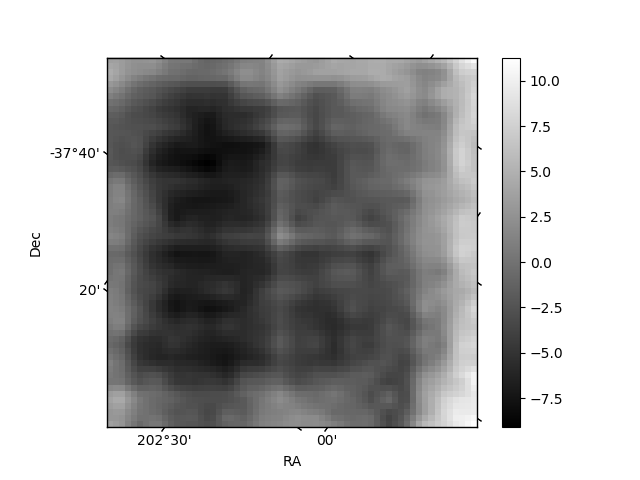
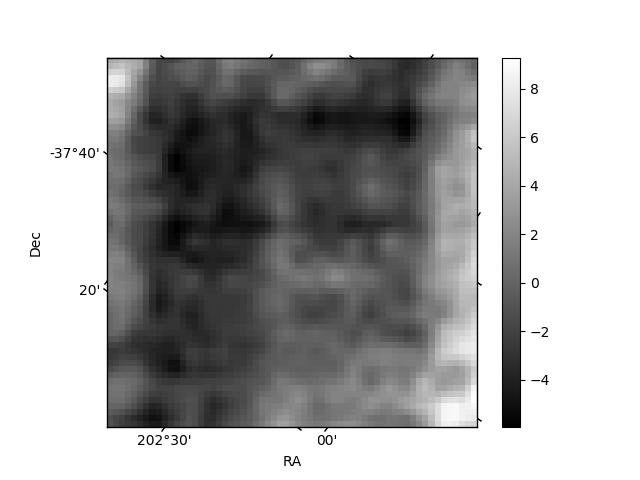
Histogram calculated using DETX and DETY for each event in the final _common_clean file
| Quadrant A | 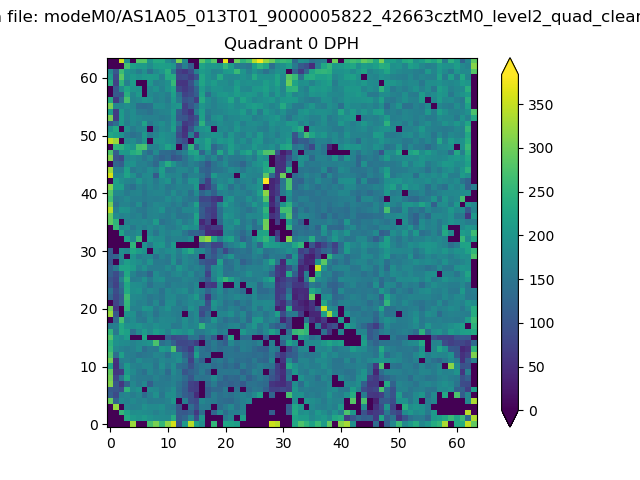 |
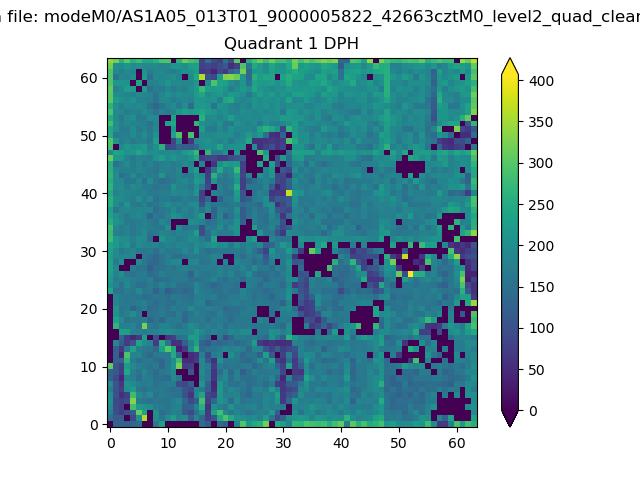 |
Quadrant B |
|---|---|---|---|
| Quadrant D | 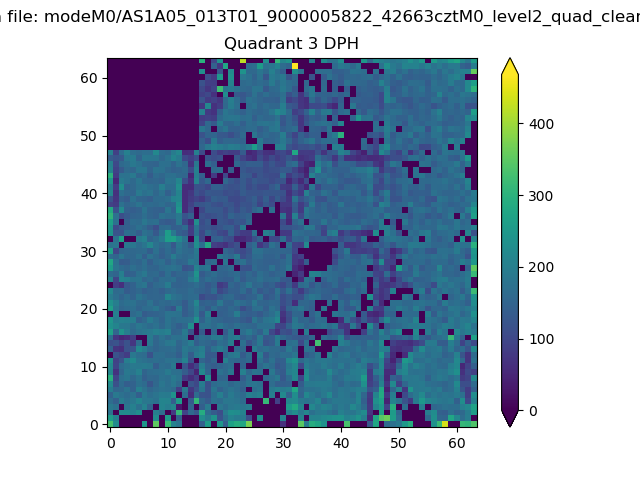 |
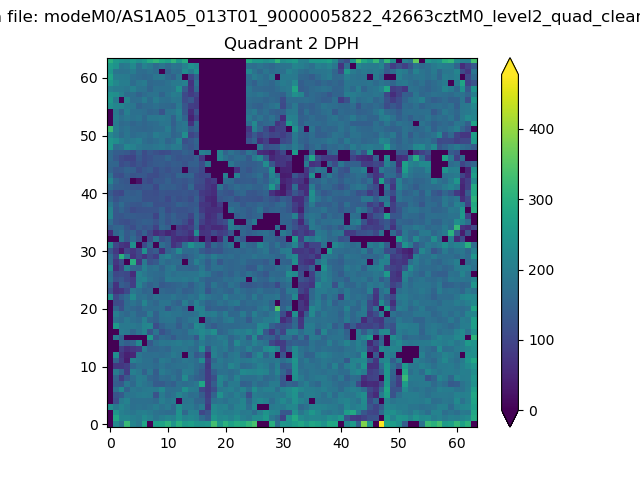 |
Quadrant C |
| Plot type | Count rate plots | Images |
|---|---|---|
| Comparison with Poisson distribution Blue bars denote a histogram of data divided into 1 sec bins. Red curve is a Poisson curve with rate = median count rate of data. |
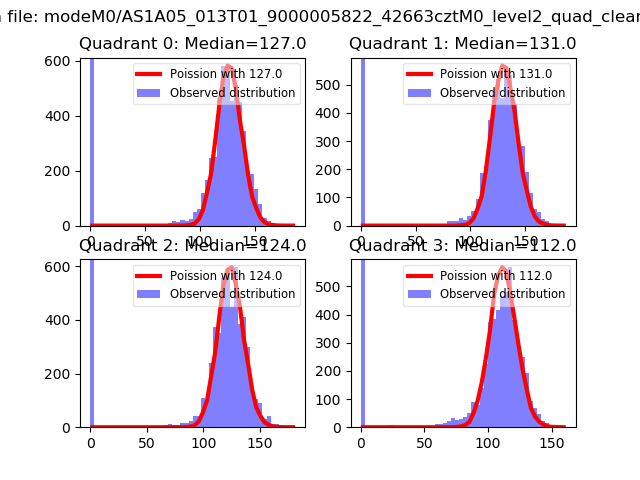 |
 |
| Quadrant-wise count rates Data is divided into 100 sec bins |
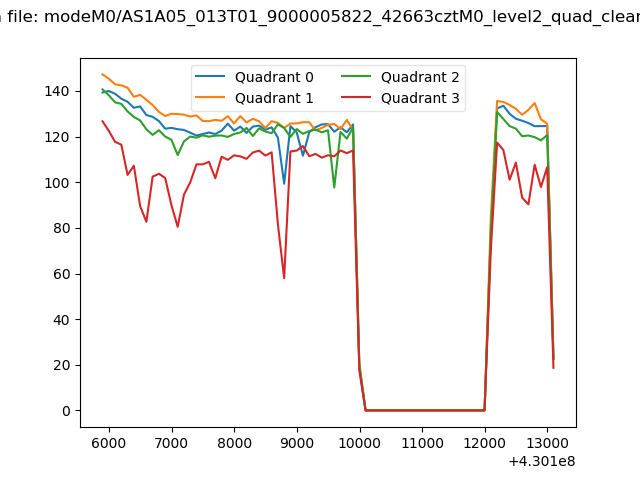 |
|
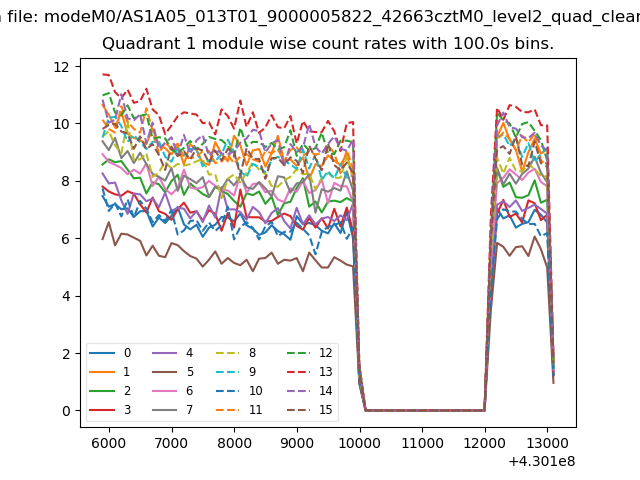
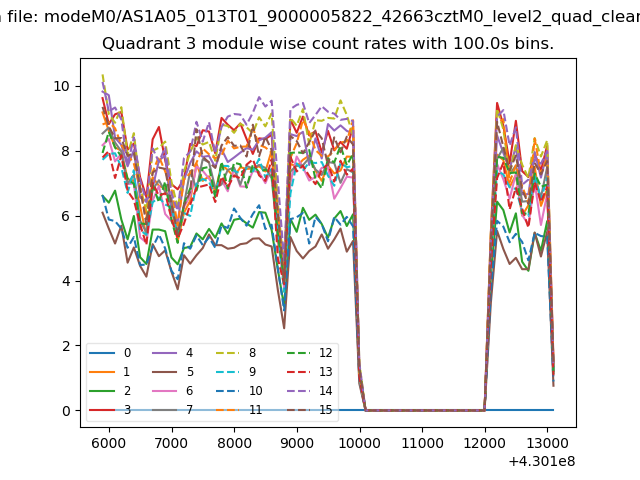
| Module-wise count rates for Quadrant A Data is divided into 100 sec bins |
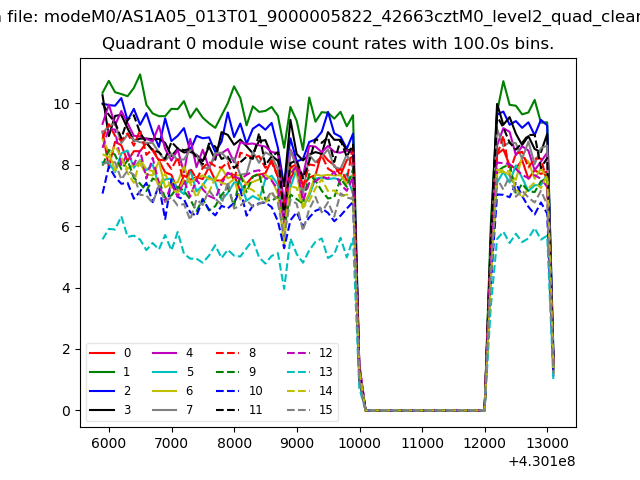 |
 |
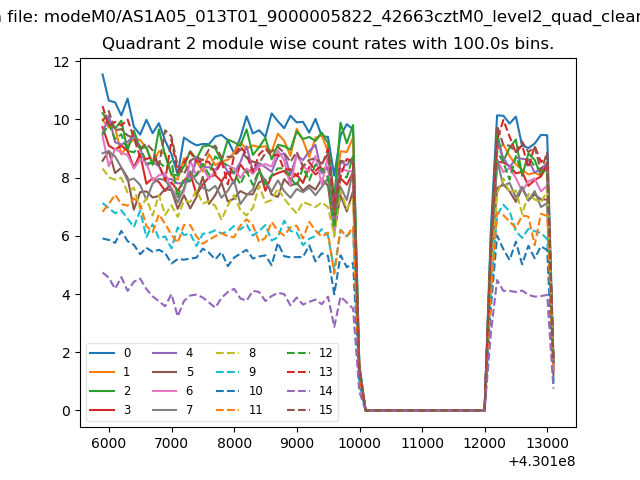
| Module-wise count rates for Quadrant B Data is divided into 100 sec bins |
 |
 |
| Module-wise count rates for Quadrant C Data is divided into 100 sec bins |
 |
 |
| Module-wise count rates for Quadrant D Data is divided into 100 sec bins |
 |
 |
| Parameter | Plot |
|---|---|
| CZT HV Monitor | 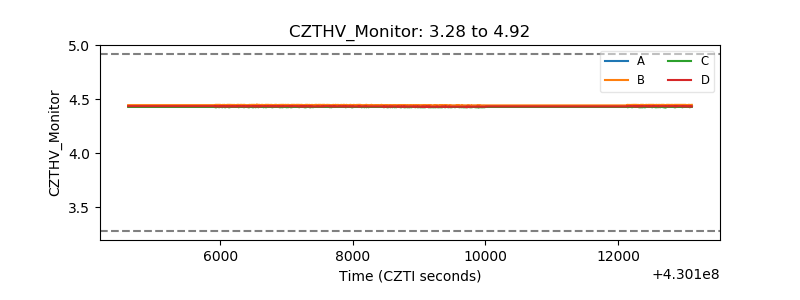 |
| D_VDD | 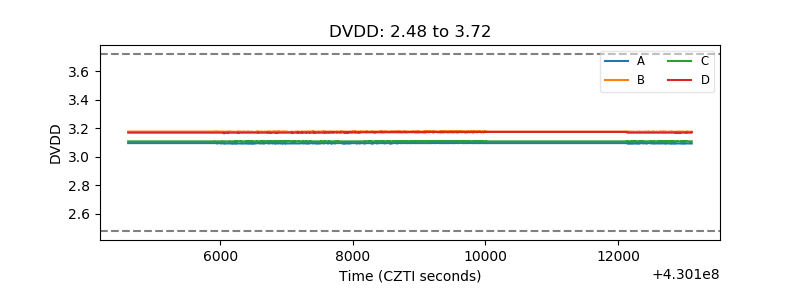 |
| Temperature 1 | 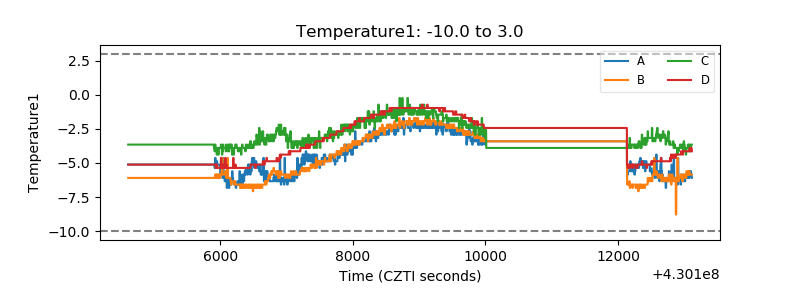 |
| Veto HV Monitor | 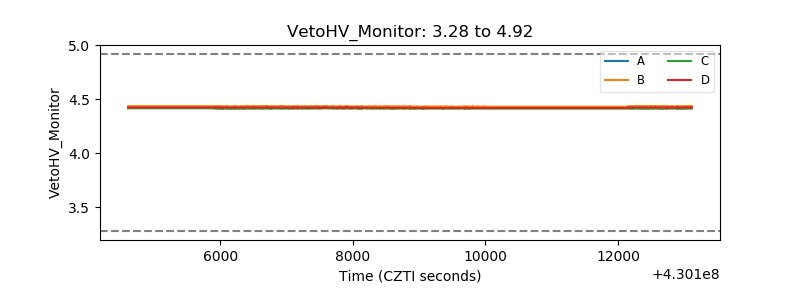 |
| Veto LLD | 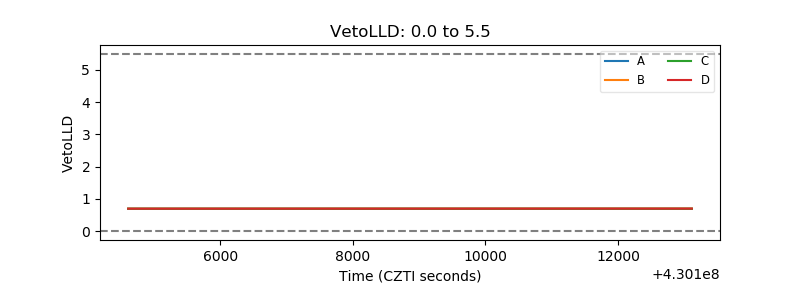 |
| Alpha Counter | 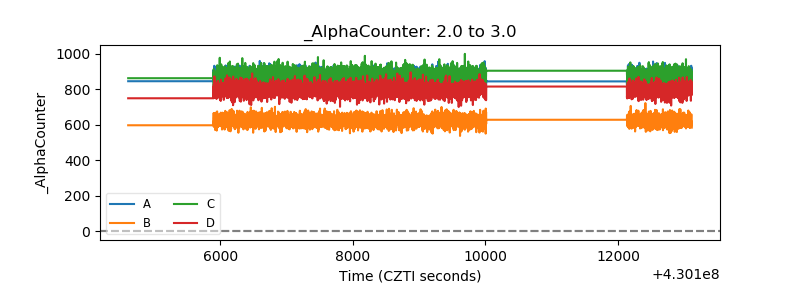 |
| _CPM_Rate | 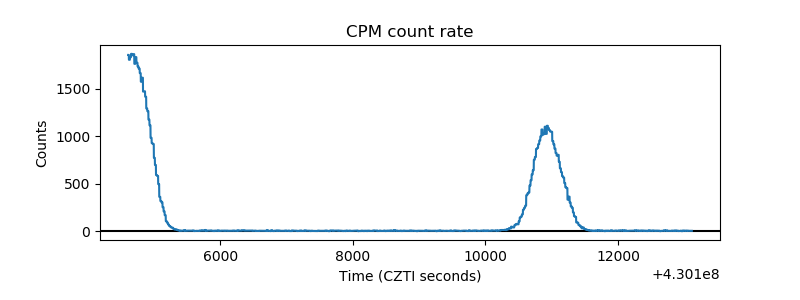 |
| CZT Counter | 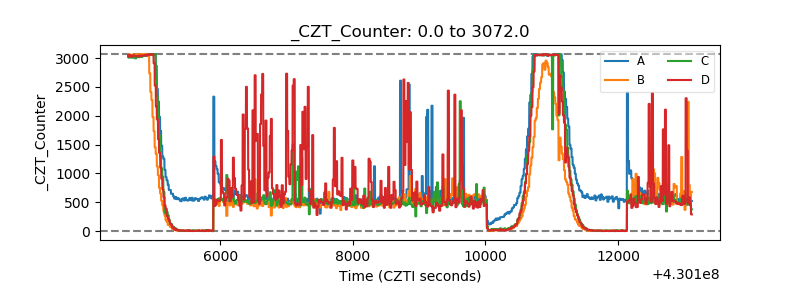 |
| +2.5 Volts monitor | 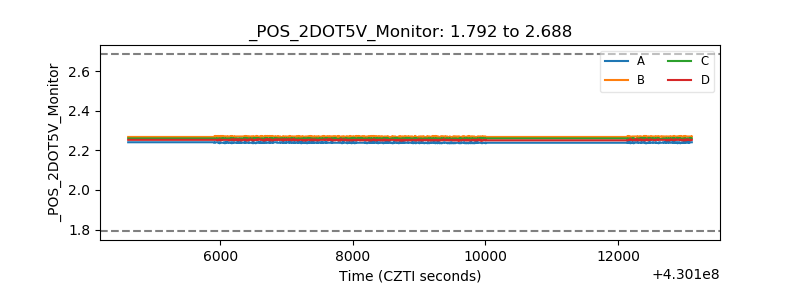 |
| +5 Volts monitor |  |
| _ROLL_ROT |  |
| _Roll_DEC | 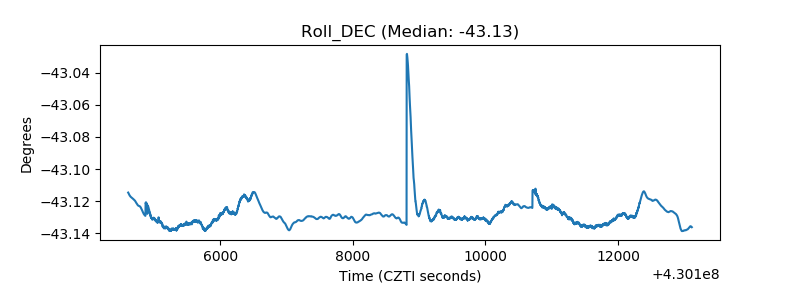 |
| _Roll_RA | 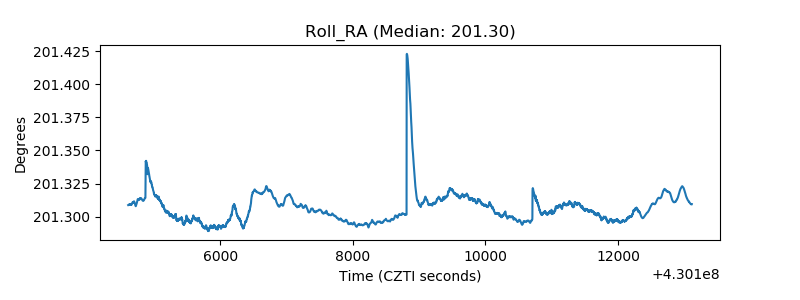 |
| Veto Counter | 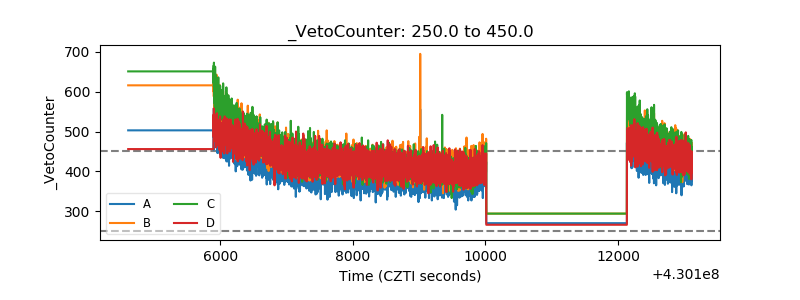 |