| Param | Original file | Final file |
|---|---|---|
| Filename | modeM0/AS1A05_013T01_9000005822_42664cztM0_level2.fits | modeM0/AS1A05_013T01_9000005822_42664cztM0_level2_quad_clean.evt |
| Size (bytes) | 372,890,880 | 88,401,600 |
| Size | 355.6 MB | 84.3 MB |
| Events in quadrant A | 2,945,676 | 609,651 |
| Events in quadrant B | 3,231,832 | 611,524 |
| Events in quadrant C | 3,388,834 | 583,382 |
| Events in quadrant D | 3,846,139 | 520,322 |
| Mode M0 | |||
|---|---|---|---|
| Quadrant | BADHDUFLAG | Total packets | Discarded packets |
| A | 0 | 11585 | 2 |
| B | 0 | 12784 | 2 |
| C | 0 | 13016 | 2 |
| D | 0 | 14737 | 2 |
| Mode M9 | |||
|---|---|---|---|
| Quadrant | BADHDUFLAG | Total packets | Discarded packets |
| A | 0 | 34 | 0 |
| B | 0 | 35 | 0 |
| C | 0 | 35 | 0 |
| D | 0 | 35 | 0 |
| Mode SS | |||
|---|---|---|---|
| Quadrant | BADHDUFLAG | Total packets | Discarded packets |
| A | 0 | 102 | 0 |
| B | 0 | 102 | 0 |
| C | 0 | 102 | 0 |
| D | 0 | 102 | 0 |
| Quadrant | Total seconds | Saturated seconds | Saturation percentage |
|---|---|---|---|
| A | 5022 | 34 | 0.677021% |
| B | 5022 | 158 | 3.146157% |
| C | 5022 | 168 | 3.345281% |
| D | 5022 | 319 | 6.352051% |
Noise dominated data is calculated using 1-second bins in cleaned event files. If a bin has >2000 counts, and if more than 50% of those come from <1% of pixels, then it is considered to be noise-dominated and hence unusable.
| Quadrant | # 1 sec bins | Bins with >0 counts | Bins with >2000 counts | High rate bins dominated by noise | Noise dominated (total time) | Noise dominated (detector-on time) | Marked lightcurve |
|---|---|---|---|---|---|---|---|
| A | 7145 | 5023 | 23 | 23 | 0.32% | 0.46% | 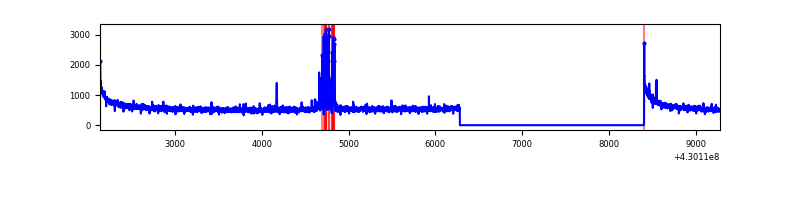 |
| B | 7145 | 5023 | 122 | 122 | 1.71% | 2.43% | 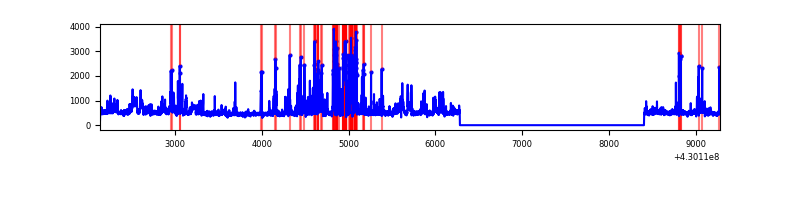 |
| C | 7145 | 5023 | 180 | 180 | 2.52% | 3.58% | 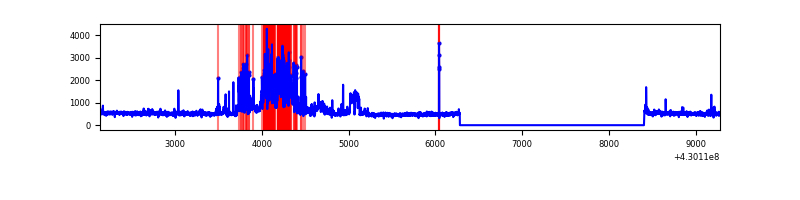 |
| D | 7145 | 5023 | 279 | 279 | 3.90% | 5.55% | 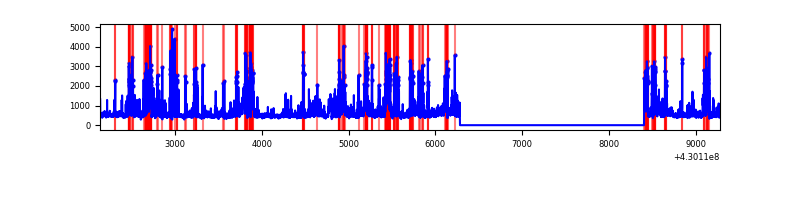 |
Top three noisy pixels from each quadrant. If the there are fewer than three noisy pixels in the level2.evt file, extra rows are filled as -1
| Pixel properties | Quadrant properties | ||||||
|---|---|---|---|---|---|---|---|
| Quadrant | DetID | PixID | Counts | Sigma | Mean | Median | Sigma |
| A | 10 | 83 | 540672 | 4495.1 | 587 | 577 | 120.2 |
| A | 13 | 248 | 106550 | 881.99 | 587 | 577 | 120.2 |
| A | 7 | 3 | 17541 | 141.19 | 587 | 577 | 120.2 |
| B | 0 | 245 | 322093 | 2899.5 | 576 | 561 | 110.9 |
| B | 0 | 168 | 278265 | 2504.27 | 576 | 561 | 110.9 |
| B | 10 | 247 | 113390 | 1017.46 | 576 | 561 | 110.9 |
| C | 9 | 54 | 804626 | 6114.03 | 569 | 574 | 131.5 |
| C | 15 | 214 | 211836 | 1606.44 | 569 | 574 | 131.5 |
| C | 14 | 254 | 126573 | 958.1 | 569 | 574 | 131.5 |
| D | 12 | 218 | 566638 | 4149.26 | 562 | 548 | 136.4 |
| D | 1 | 47 | 280410 | 2051.3 | 562 | 548 | 136.4 |
| D | 2 | 249 | 267145 | 1954.07 | 562 | 548 | 136.4 |
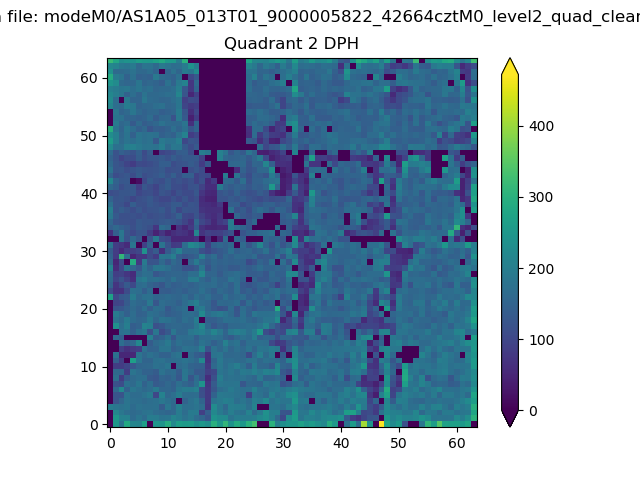
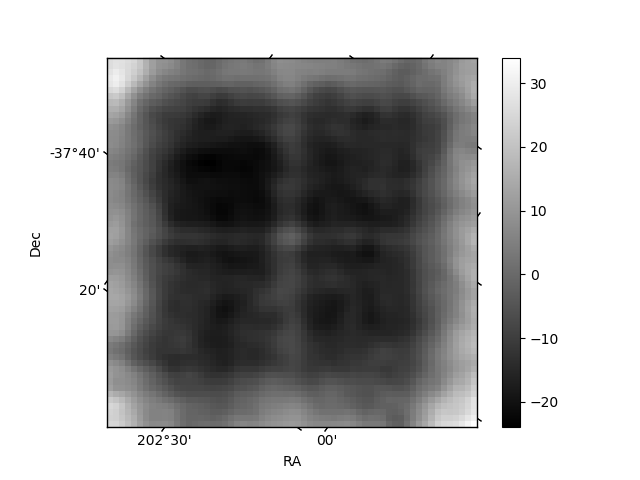
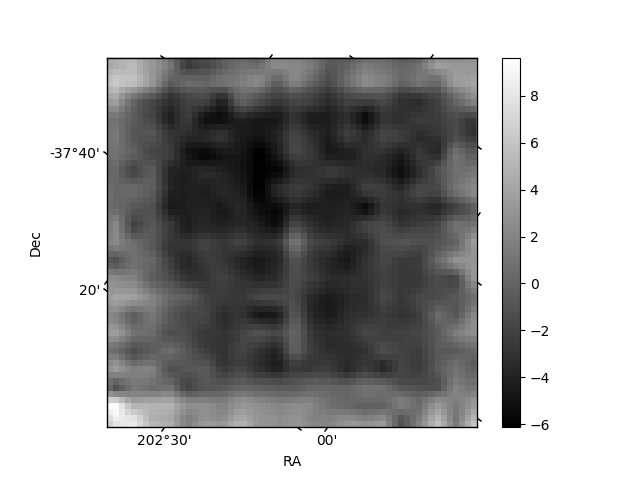
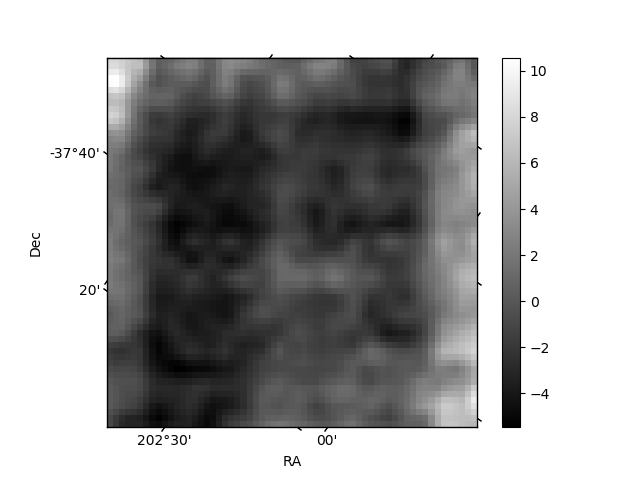
Histogram calculated using DETX and DETY for each event in the final _common_clean file
| Quadrant A | 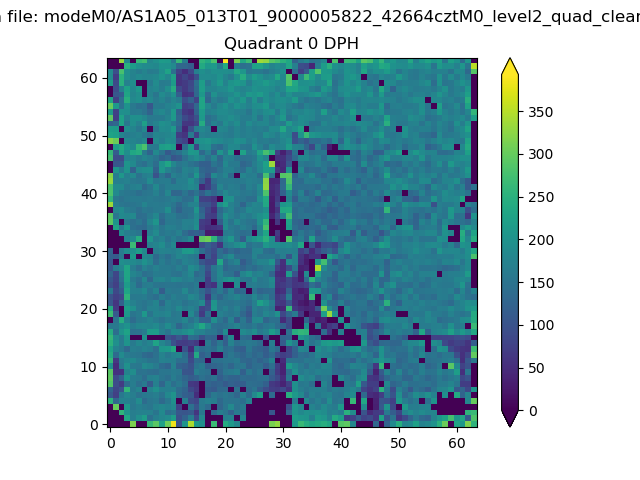 |
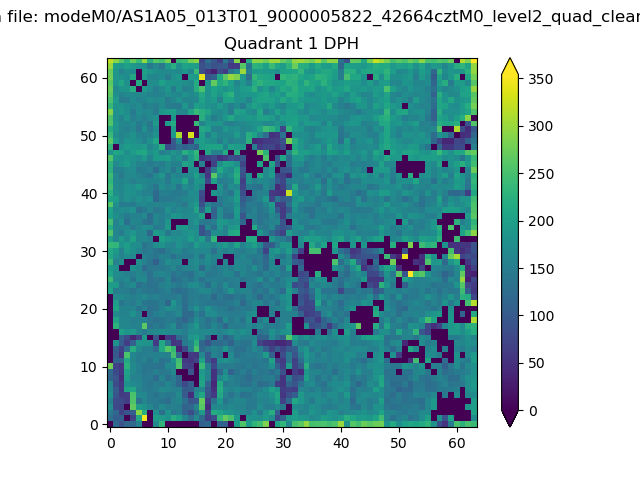 |
Quadrant B |
|---|---|---|---|
| Quadrant D | 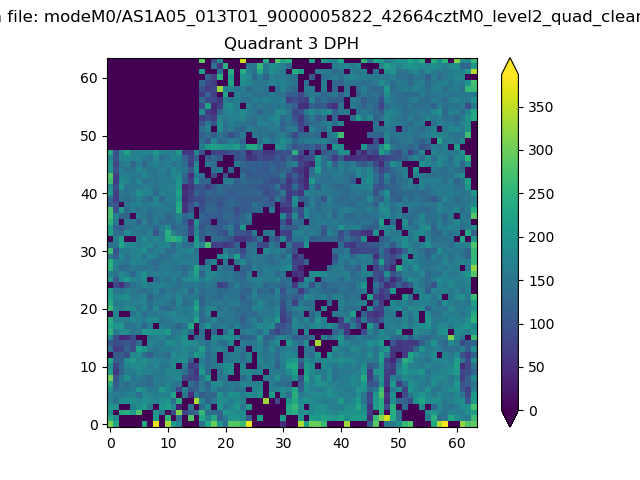 |
 |
Quadrant C |
| Plot type | Count rate plots | Images |
|---|---|---|
| Comparison with Poisson distribution Blue bars denote a histogram of data divided into 1 sec bins. Red curve is a Poisson curve with rate = median count rate of data. |
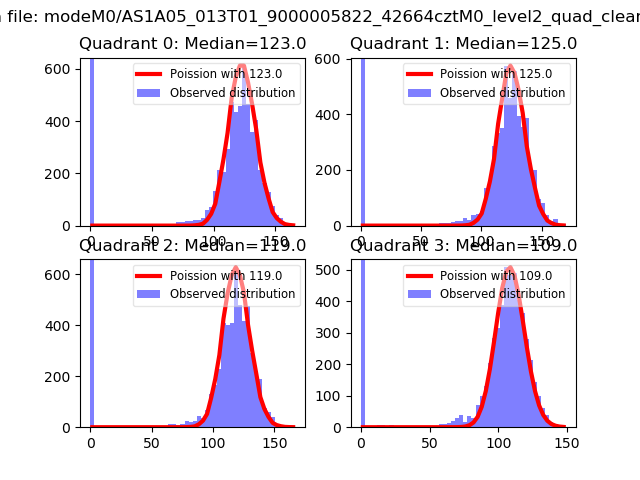 |
 |
| Quadrant-wise count rates Data is divided into 100 sec bins |
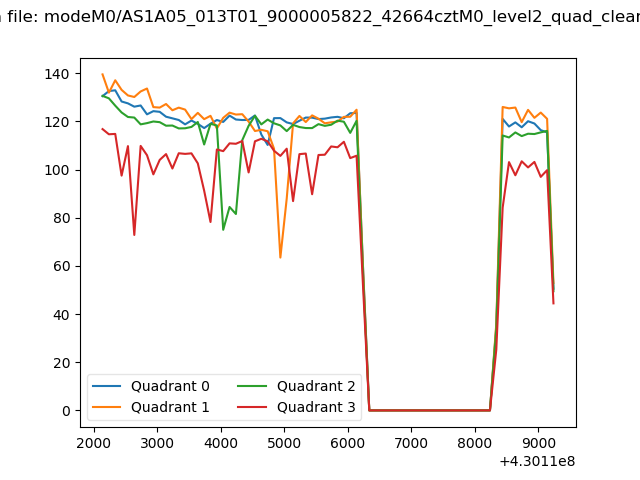 |
|
| Module-wise count rates for Quadrant A Data is divided into 100 sec bins |
 |
 |
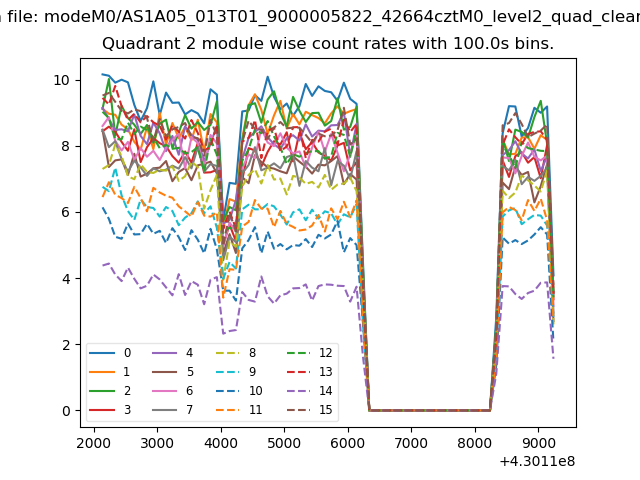
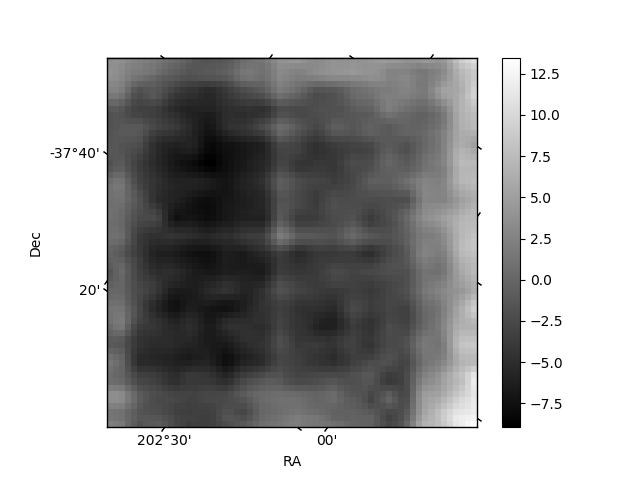
| Module-wise count rates for Quadrant B Data is divided into 100 sec bins |
 |
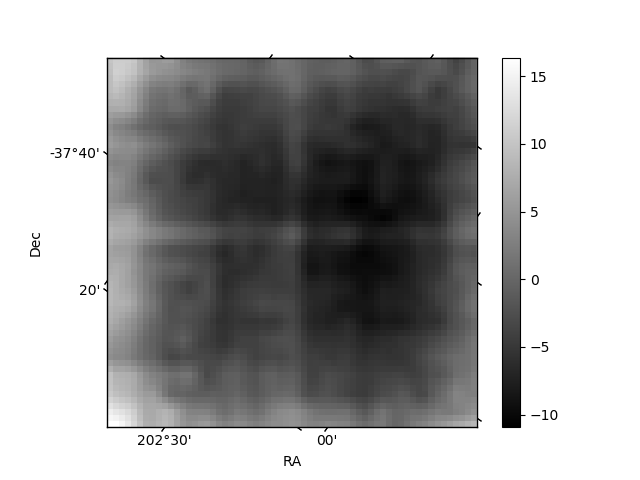 |
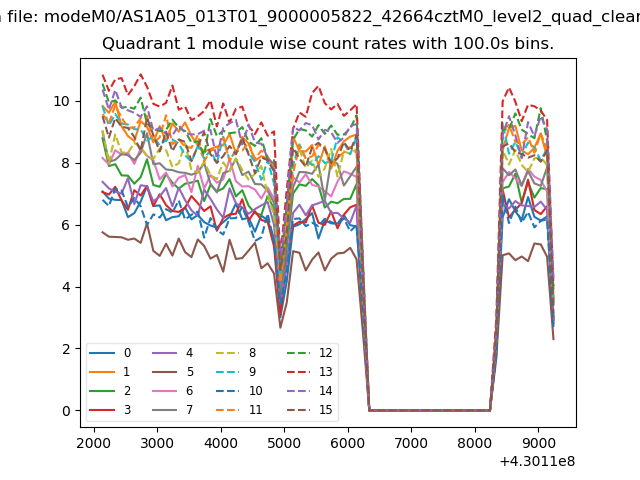
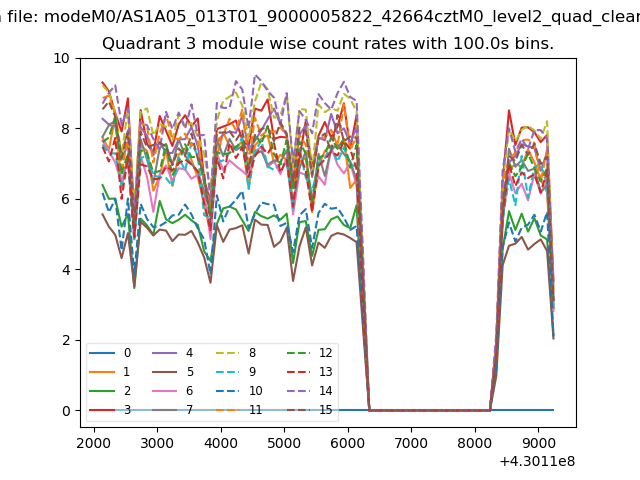
| Module-wise count rates for Quadrant C Data is divided into 100 sec bins |
 |
 |
| Module-wise count rates for Quadrant D Data is divided into 100 sec bins |
 |
 |
| Parameter | Plot |
|---|---|
| CZT HV Monitor | 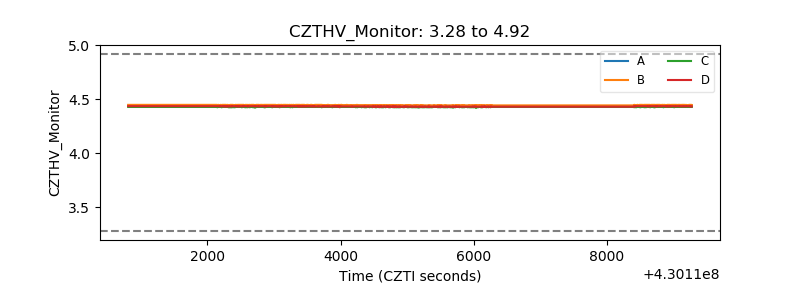 |
| D_VDD | 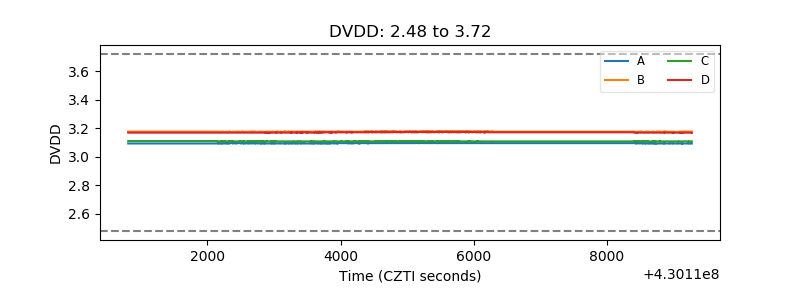 |
| Temperature 1 | 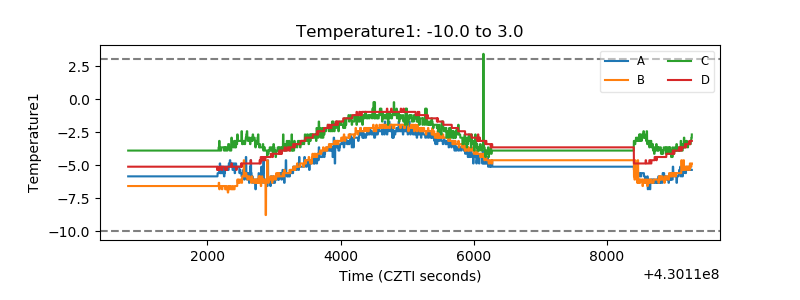 |
| Veto HV Monitor | 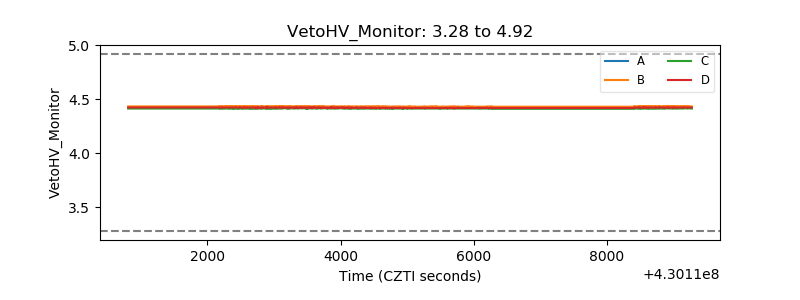 |
| Veto LLD | 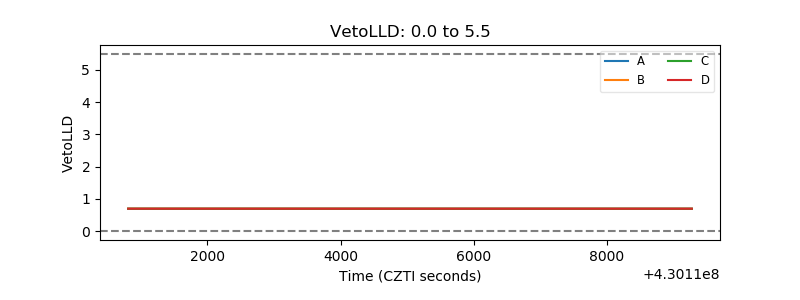 |
| Alpha Counter | 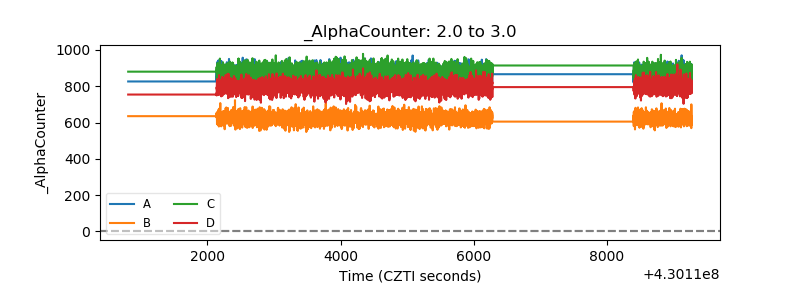 |
| _CPM_Rate | 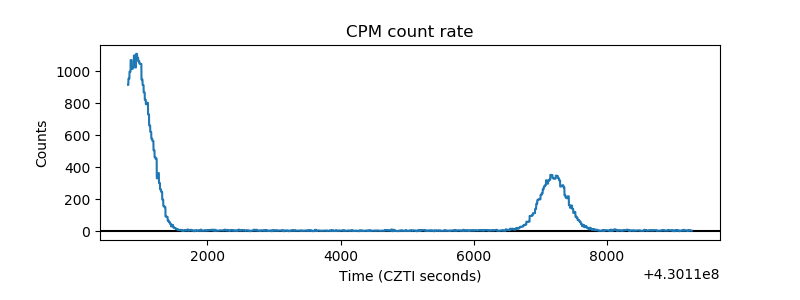 |
| CZT Counter | 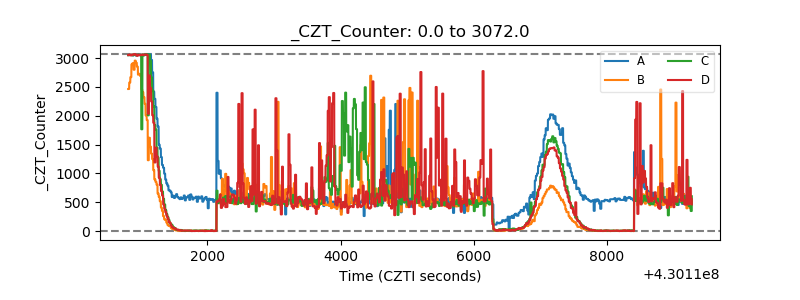 |
| +2.5 Volts monitor | 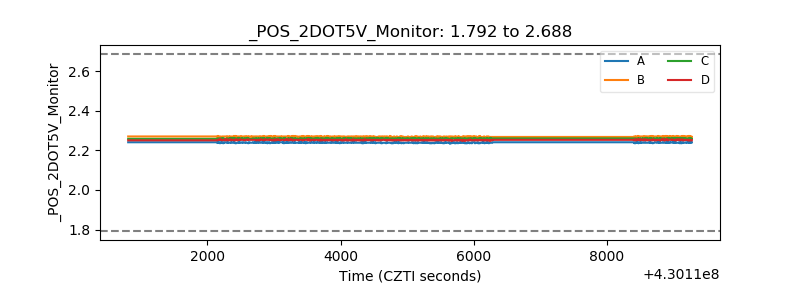 |
| +5 Volts monitor | 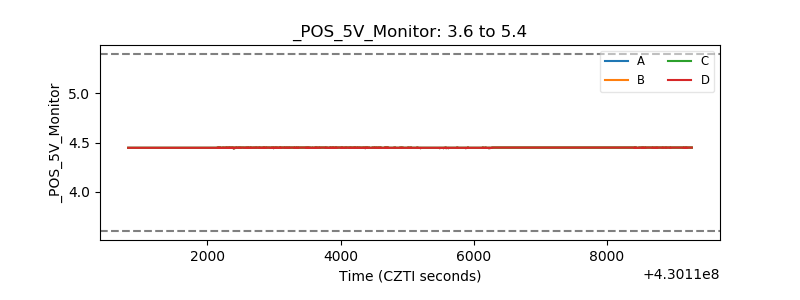 |
| _ROLL_ROT | 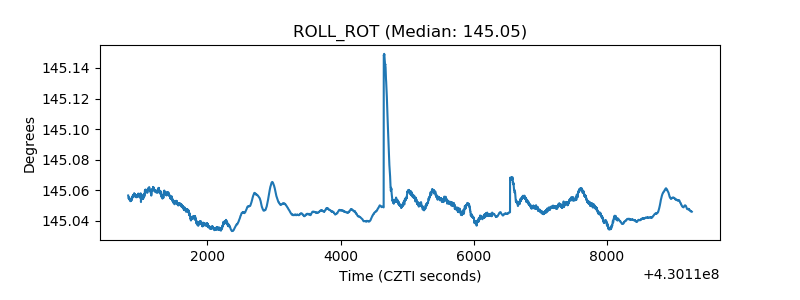 |
| _Roll_DEC | 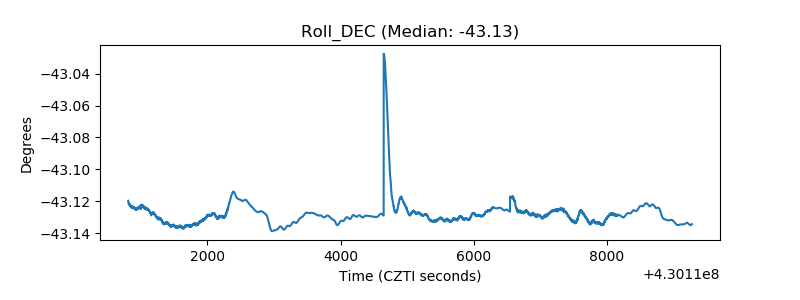 |
| _Roll_RA |  |
| Veto Counter | 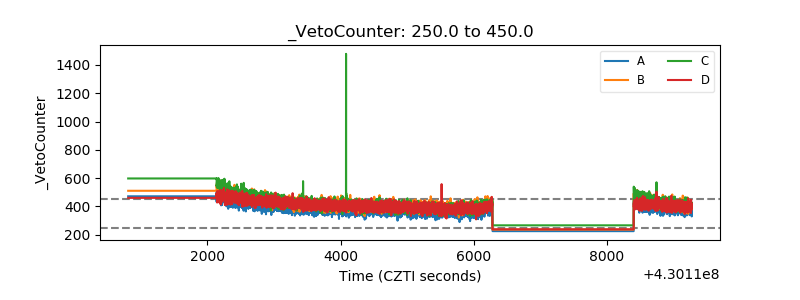 |