| Param | Original file | Final file |
|---|---|---|
| Filename | modeM0/AS1A05_013T01_9000005822_42665cztM0_level2.fits | modeM0/AS1A05_013T01_9000005822_42665cztM0_level2_quad_clean.evt |
| Size (bytes) | 326,010,240 | 86,152,320 |
| Size | 310.9 MB | 82.2 MB |
| Events in quadrant A | 2,934,540 | 580,999 |
| Events in quadrant B | 2,616,649 | 593,229 |
| Events in quadrant C | 2,551,444 | 569,907 |
| Events in quadrant D | 3,571,928 | 510,487 |
| Mode M0 | |||
|---|---|---|---|
| Quadrant | BADHDUFLAG | Total packets | Discarded packets |
| A | 0 | 11633 | 2 |
| B | 0 | 11013 | 2 |
| C | 0 | 10627 | 2 |
| D | 0 | 14005 | 2 |
| Mode M9 | |||
|---|---|---|---|
| Quadrant | BADHDUFLAG | Total packets | Discarded packets |
| A | 0 | 33 | 0 |
| B | 0 | 34 | 0 |
| C | 0 | 34 | 0 |
| D | 0 | 34 | 0 |
| Mode SS | |||
|---|---|---|---|
| Quadrant | BADHDUFLAG | Total packets | Discarded packets |
| A | 0 | 104 | 0 |
| B | 0 | 104 | 0 |
| C | 0 | 104 | 0 |
| D | 0 | 104 | 0 |
| Quadrant | Total seconds | Saturated seconds | Saturation percentage |
|---|---|---|---|
| A | 5048 | 43 | 0.851823% |
| B | 5048 | 34 | 0.673534% |
| C | 5047 | 30 | 0.594413% |
| D | 5047 | 218 | 4.319398% |
Noise dominated data is calculated using 1-second bins in cleaned event files. If a bin has >2000 counts, and if more than 50% of those come from <1% of pixels, then it is considered to be noise-dominated and hence unusable.
| Quadrant | # 1 sec bins | Bins with >0 counts | Bins with >2000 counts | High rate bins dominated by noise | Noise dominated (total time) | Noise dominated (detector-on time) | Marked lightcurve |
|---|---|---|---|---|---|---|---|
| A | 7051 | 5049 | 24 | 24 | 0.34% | 0.48% | 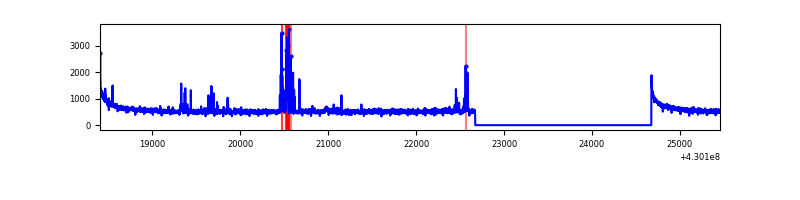 |
| B | 7051 | 5049 | 22 | 22 | 0.31% | 0.44% | 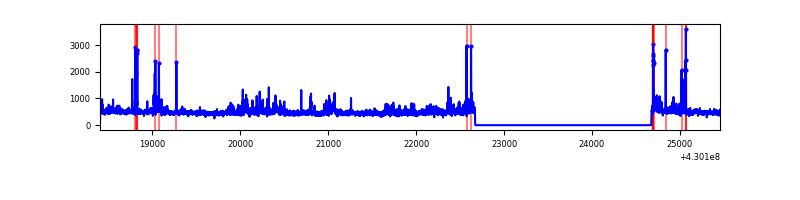 |
| C | 7050 | 5048 | 19 | 19 | 0.27% | 0.38% | 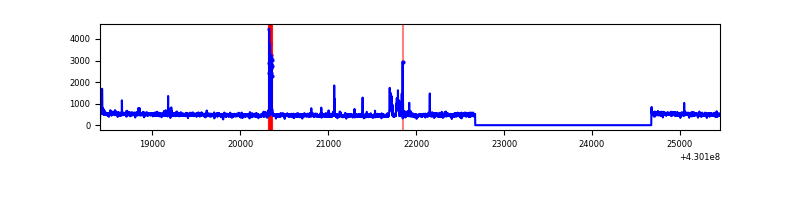 |
| D | 7050 | 5048 | 192 | 192 | 2.72% | 3.80% | 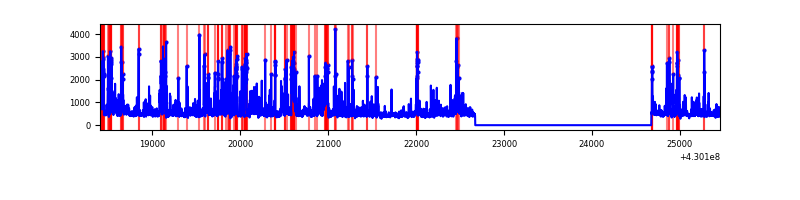 |
Top three noisy pixels from each quadrant. If the there are fewer than three noisy pixels in the level2.evt file, extra rows are filled as -1
| Pixel properties | Quadrant properties | ||||||
|---|---|---|---|---|---|---|---|
| Quadrant | DetID | PixID | Counts | Sigma | Mean | Median | Sigma |
| A | 10 | 83 | 545172 | 4609.74 | 572 | 560 | 118.1 |
| A | 13 | 248 | 161123 | 1359.05 | 572 | 560 | 118.1 |
| A | 13 | 6 | 12864 | 104.14 | 572 | 560 | 118.1 |
| B | 10 | 246 | 110558 | 1000.57 | 563 | 547 | 109.9 |
| B | 0 | 245 | 101591 | 919.02 | 563 | 547 | 109.9 |
| B | 3 | 112 | 72455 | 654.02 | 563 | 547 | 109.9 |
| C | 15 | 214 | 215162 | 1654.91 | 555 | 559 | 129.7 |
| C | 14 | 254 | 151377 | 1163.03 | 555 | 559 | 129.7 |
| C | 3 | 233 | 12444 | 91.65 | 555 | 559 | 129.7 |
| D | 2 | 249 | 437079 | 3240.73 | 551 | 534 | 134.7 |
| D | 12 | 218 | 420160 | 3115.13 | 551 | 534 | 134.7 |
| D | 12 | 6 | 161750 | 1196.8 | 551 | 534 | 134.7 |
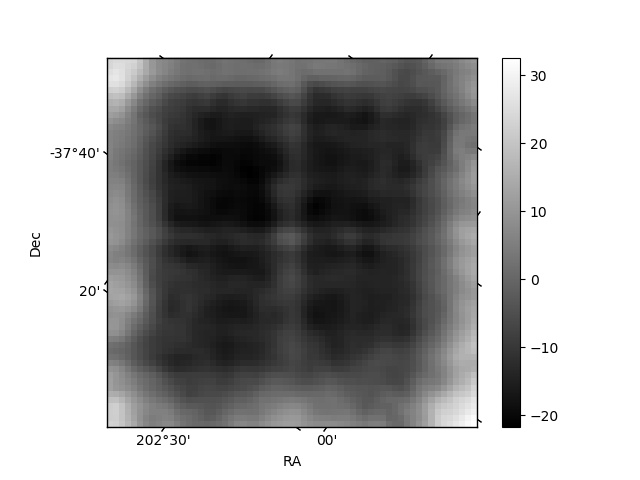
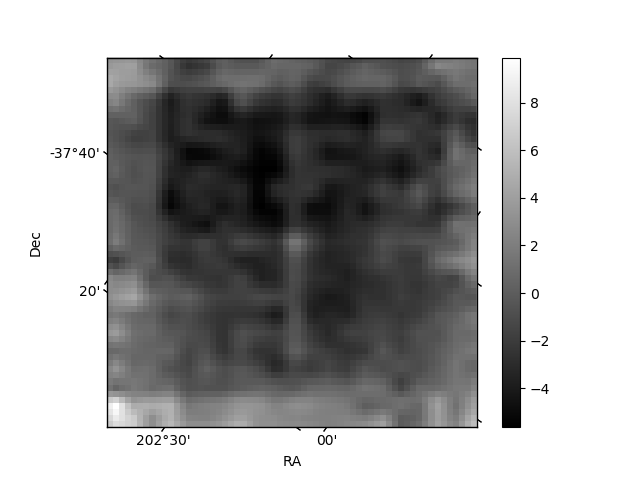
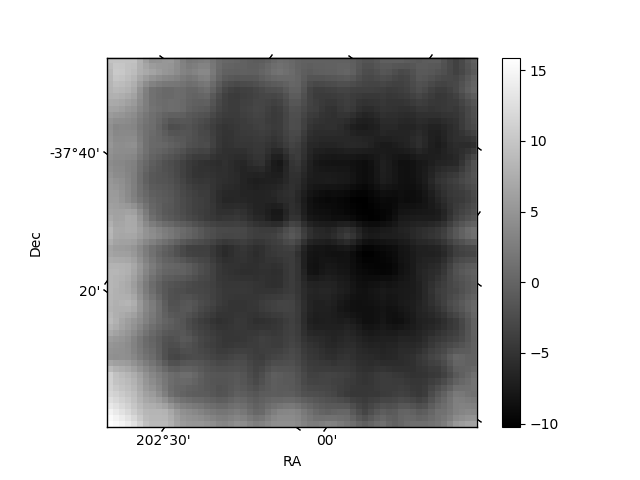
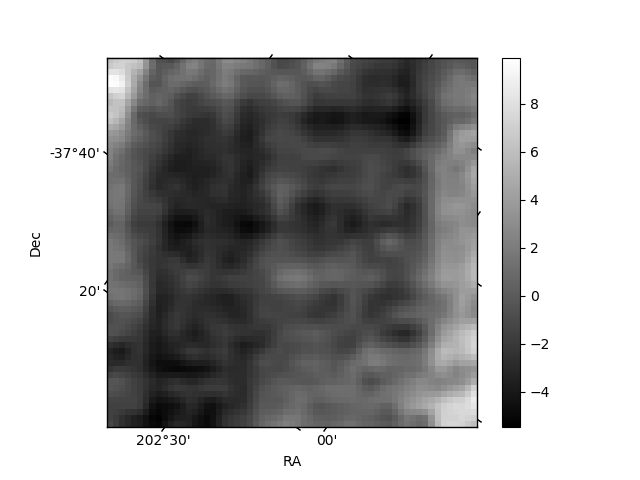
Histogram calculated using DETX and DETY for each event in the final _common_clean file
| Quadrant A | 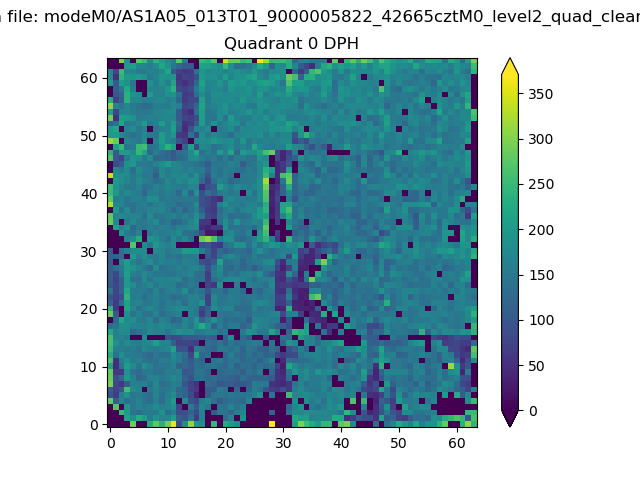 |
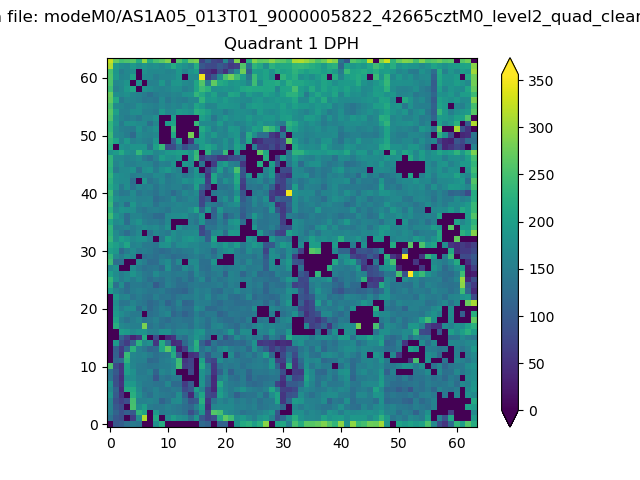 |
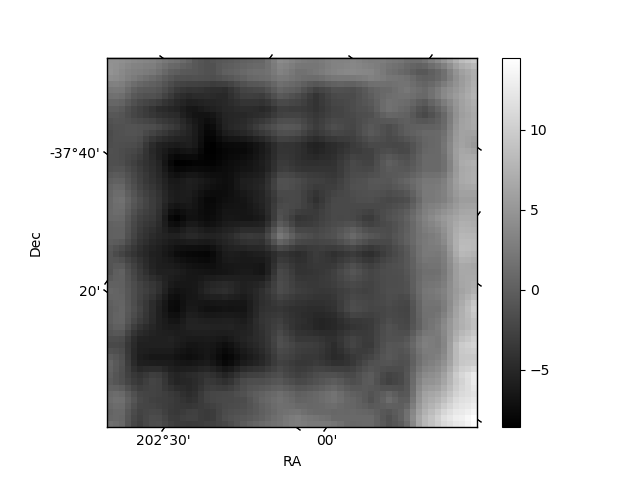
Quadrant B |
|---|---|---|---|
| Quadrant D | 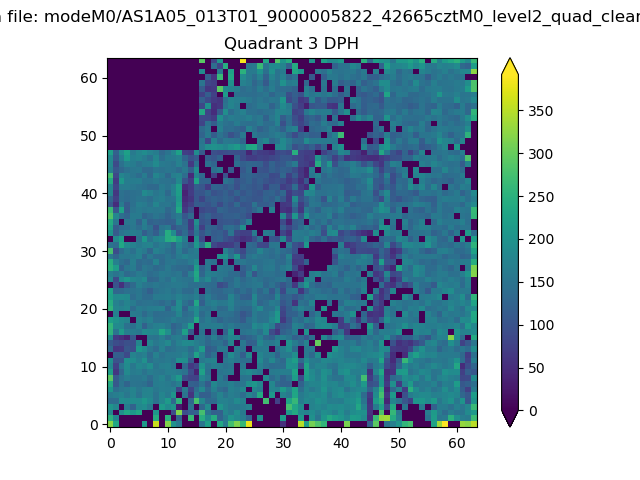 |
 |
Quadrant C |
| Plot type | Count rate plots | Images |
|---|---|---|
| Comparison with Poisson distribution Blue bars denote a histogram of data divided into 1 sec bins. Red curve is a Poisson curve with rate = median count rate of data. |
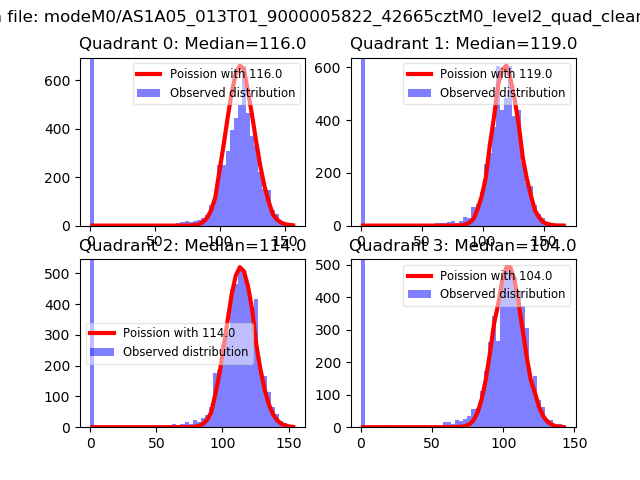 |
 |
| Quadrant-wise count rates Data is divided into 100 sec bins |
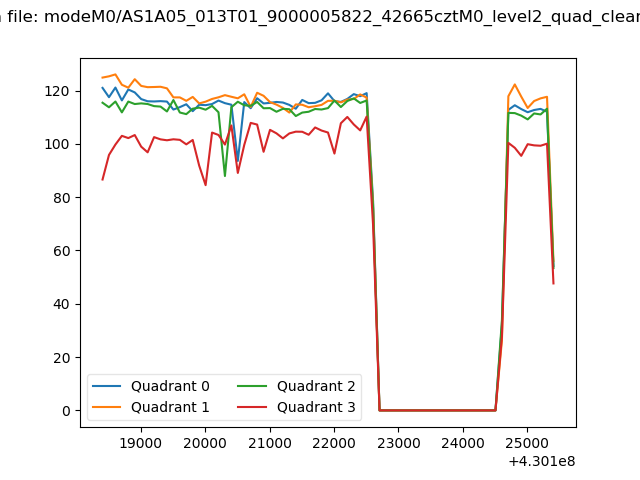 |
|
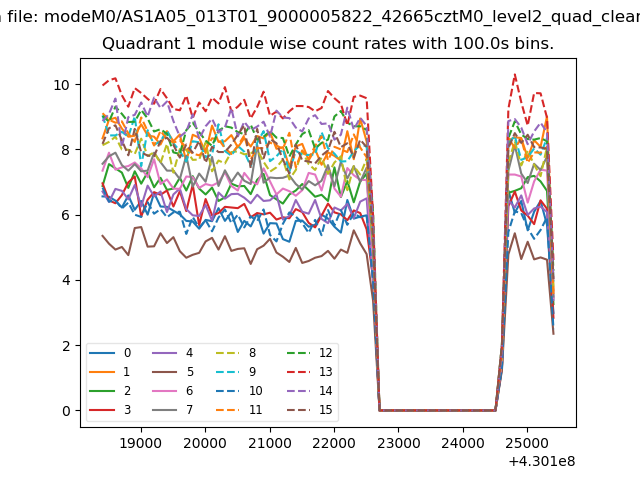
| Module-wise count rates for Quadrant A Data is divided into 100 sec bins |
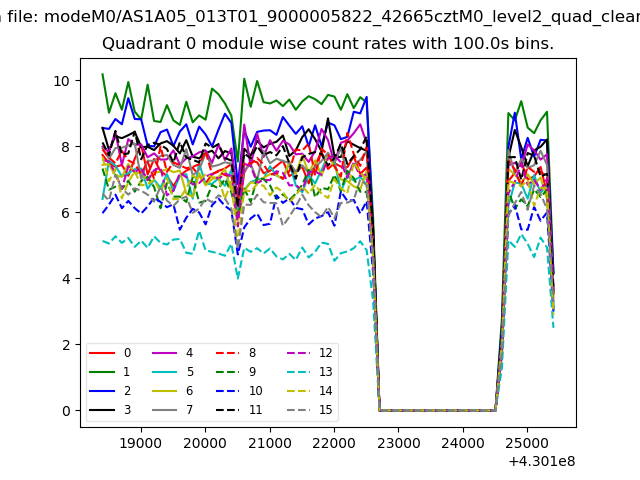 |
 |
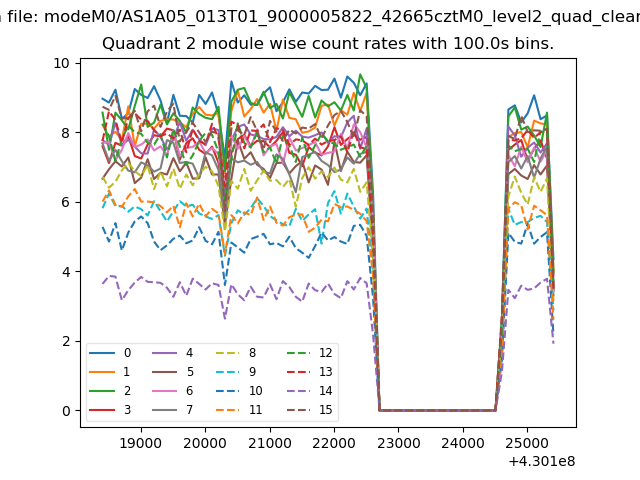
| Module-wise count rates for Quadrant B Data is divided into 100 sec bins |
 |
 |
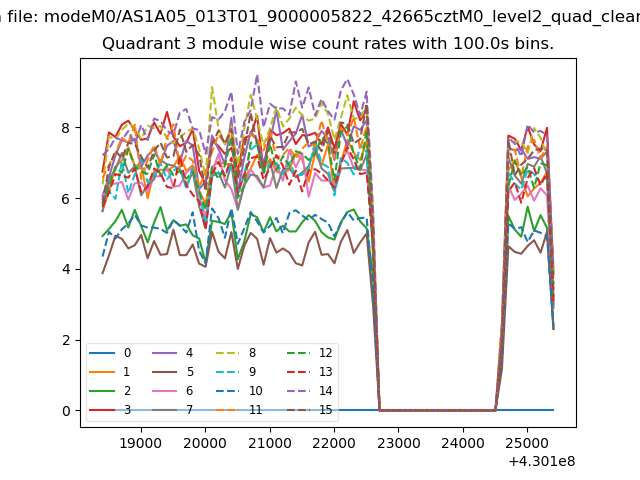
| Module-wise count rates for Quadrant C Data is divided into 100 sec bins |
 |
 |
| Module-wise count rates for Quadrant D Data is divided into 100 sec bins |
 |
 |
| Parameter | Plot |
|---|---|
| CZT HV Monitor | 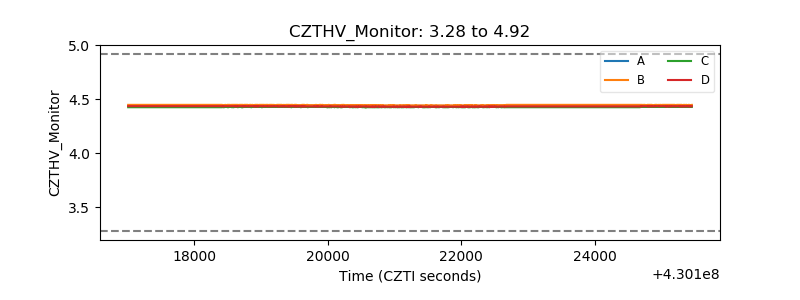 |
| D_VDD | 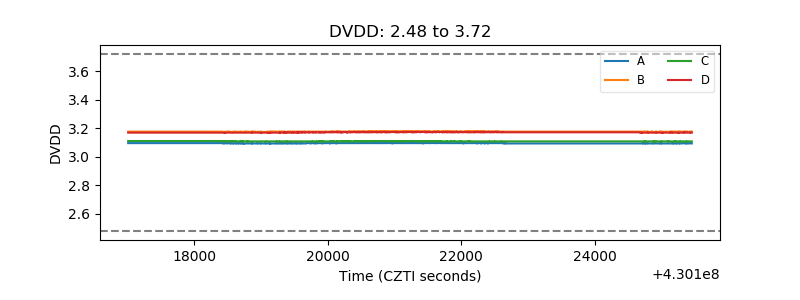 |
| Temperature 1 | 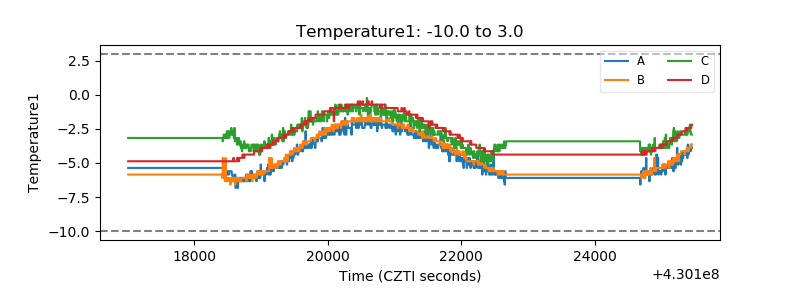 |
| Veto HV Monitor | 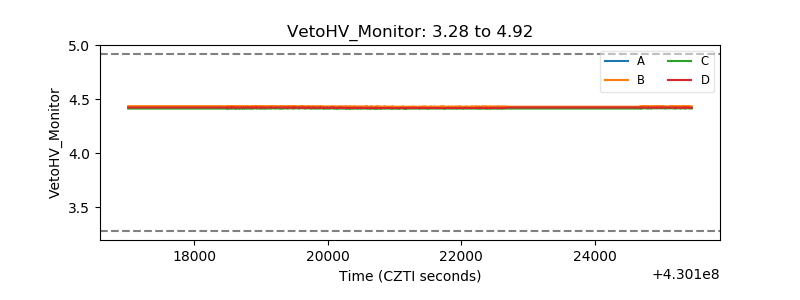 |
| Veto LLD | 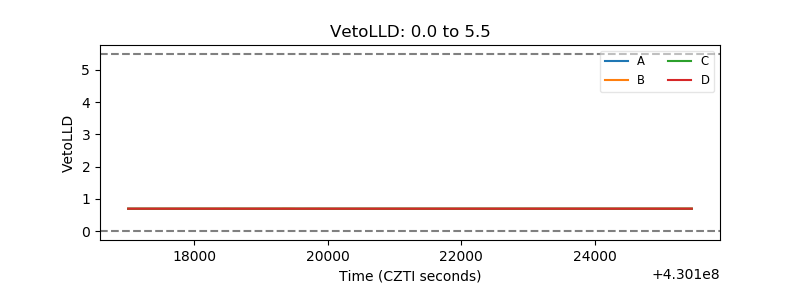 |
| Alpha Counter | 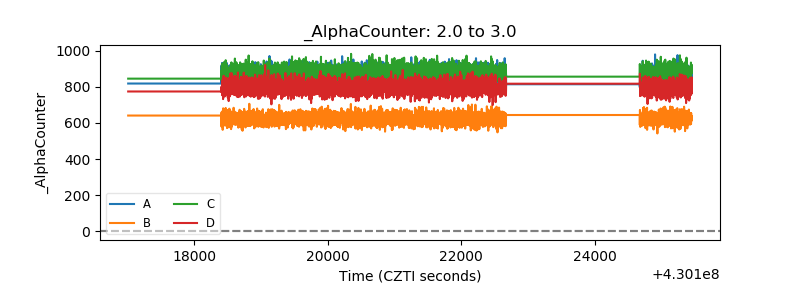 |
| _CPM_Rate | 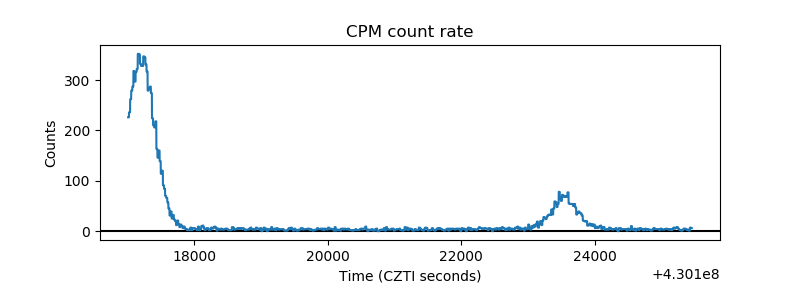 |
| CZT Counter | 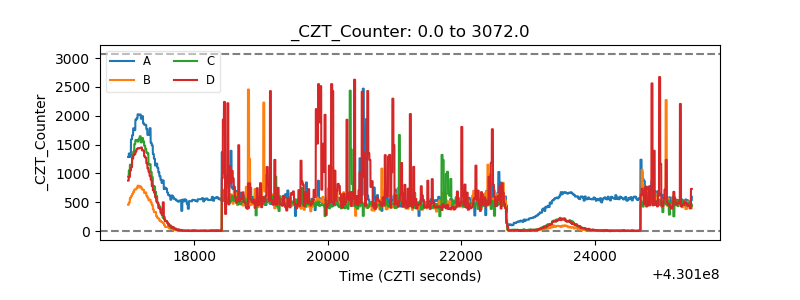 |
| +2.5 Volts monitor | 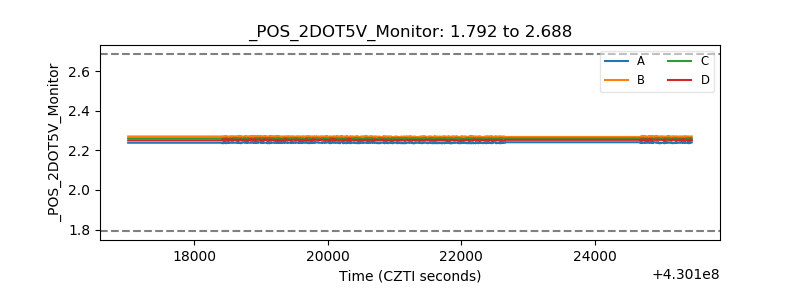 |
| +5 Volts monitor | 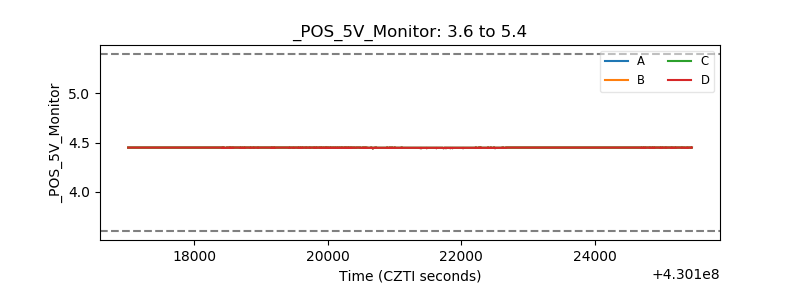 |
| _ROLL_ROT | 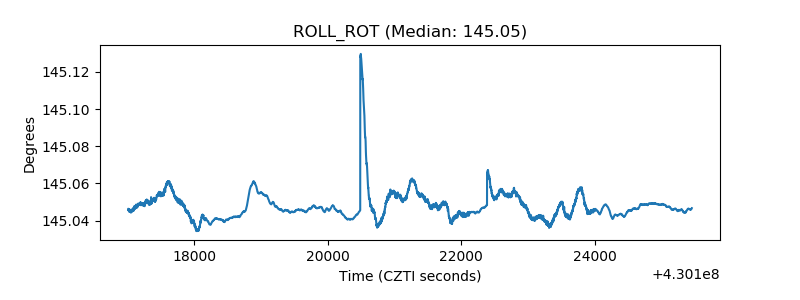 |
| _Roll_DEC | 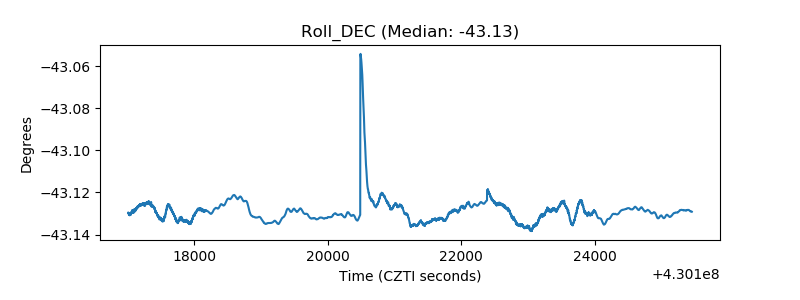 |
| _Roll_RA | 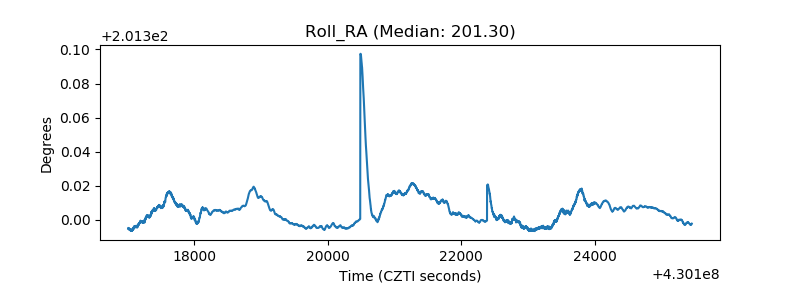 |
| Veto Counter |  |