| Param | Original file | Final file |
|---|---|---|
| Filename | modeM0/AS1A05_013T01_9000005822_42666cztM0_level2.fits | modeM0/AS1A05_013T01_9000005822_42666cztM0_level2_quad_clean.evt |
| Size (bytes) | 330,966,720 | 90,394,560 |
| Size | 315.6 MB | 86.2 MB |
| Events in quadrant A | 3,120,581 | 603,450 |
| Events in quadrant B | 2,921,225 | 612,373 |
| Events in quadrant C | 2,617,811 | 596,228 |
| Events in quadrant D | 3,170,353 | 546,404 |
| Mode M0 | |||
|---|---|---|---|
| Quadrant | BADHDUFLAG | Total packets | Discarded packets |
| A | 0 | 12406 | 2 |
| B | 0 | 12234 | 2 |
| C | 0 | 11200 | 2 |
| D | 0 | 13148 | 2 |
| Mode M9 | |||
|---|---|---|---|
| Quadrant | BADHDUFLAG | Total packets | Discarded packets |
| A | 0 | 24 | 0 |
| B | 0 | 24 | 0 |
| C | 0 | 25 | 0 |
| D | 0 | 25 | 0 |
| Mode SS | |||
|---|---|---|---|
| Quadrant | BADHDUFLAG | Total packets | Discarded packets |
| A | 0 | 110 | 0 |
| B | 0 | 110 | 0 |
| C | 0 | 110 | 0 |
| D | 0 | 110 | 0 |
| Quadrant | Total seconds | Saturated seconds | Saturation percentage |
|---|---|---|---|
| A | 5409 | 65 | 1.201701% |
| B | 5409 | 61 | 1.127750% |
| C | 5409 | 7 | 0.129414% |
| D | 5409 | 74 | 1.368090% |
Noise dominated data is calculated using 1-second bins in cleaned event files. If a bin has >2000 counts, and if more than 50% of those come from <1% of pixels, then it is considered to be noise-dominated and hence unusable.
| Quadrant | # 1 sec bins | Bins with >0 counts | Bins with >2000 counts | High rate bins dominated by noise | Noise dominated (total time) | Noise dominated (detector-on time) | Marked lightcurve |
|---|---|---|---|---|---|---|---|
| A | 7112 | 5410 | 44 | 44 | 0.62% | 0.81% | 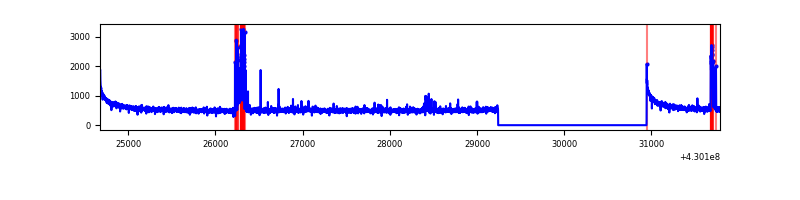 |
| B | 7112 | 5410 | 45 | 45 | 0.63% | 0.83% | 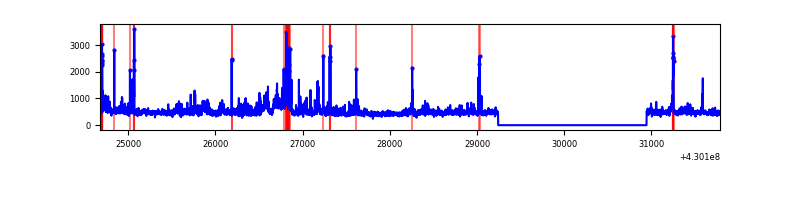 |
| C | 7112 | 5410 | 3 | 3 | 0.04% | 0.06% | 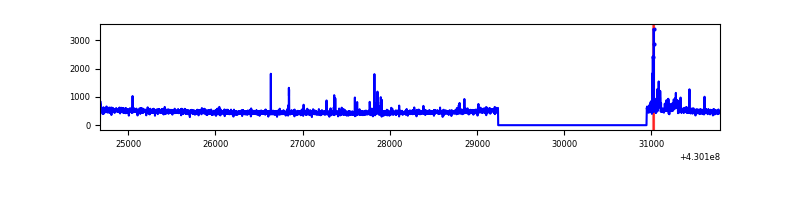 |
| D | 7112 | 5410 | 66 | 66 | 0.93% | 1.22% | 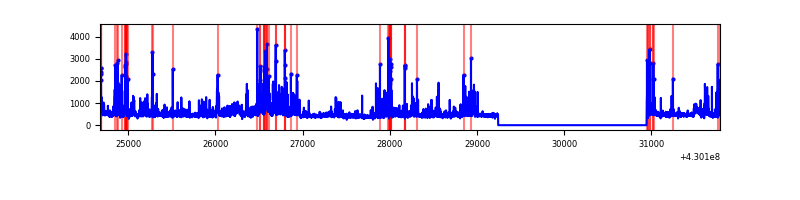 |
Top three noisy pixels from each quadrant. If the there are fewer than three noisy pixels in the level2.evt file, extra rows are filled as -1
| Pixel properties | Quadrant properties | ||||||
|---|---|---|---|---|---|---|---|
| Quadrant | DetID | PixID | Counts | Sigma | Mean | Median | Sigma |
| A | 10 | 83 | 580920 | 4654.78 | 600 | 588 | 124.7 |
| A | 13 | 248 | 142953 | 1141.89 | 600 | 588 | 124.7 |
| A | 15 | 223 | 66541 | 529.0 | 600 | 588 | 124.7 |
| B | 10 | 246 | 228703 | 1985.99 | 590 | 572 | 114.9 |
| B | 0 | 245 | 163511 | 1418.46 | 590 | 572 | 114.9 |
| B | 15 | 85 | 67721 | 584.56 | 590 | 572 | 114.9 |
| C | 15 | 214 | 228715 | 1688.77 | 582 | 586 | 135.1 |
| C | 14 | 254 | 75282 | 552.95 | 582 | 586 | 135.1 |
| C | 3 | 233 | 20751 | 149.28 | 582 | 586 | 135.1 |
| D | 2 | 249 | 337569 | 2357.72 | 583 | 566 | 142.9 |
| D | 1 | 52 | 191930 | 1338.81 | 583 | 566 | 142.9 |
| D | 12 | 218 | 91335 | 635.03 | 583 | 566 | 142.9 |
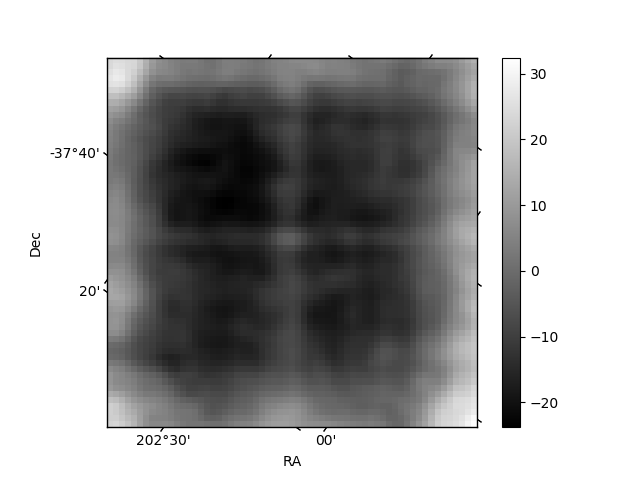
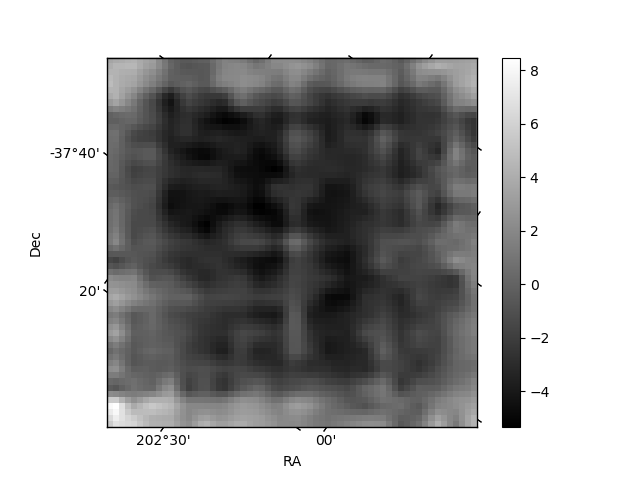
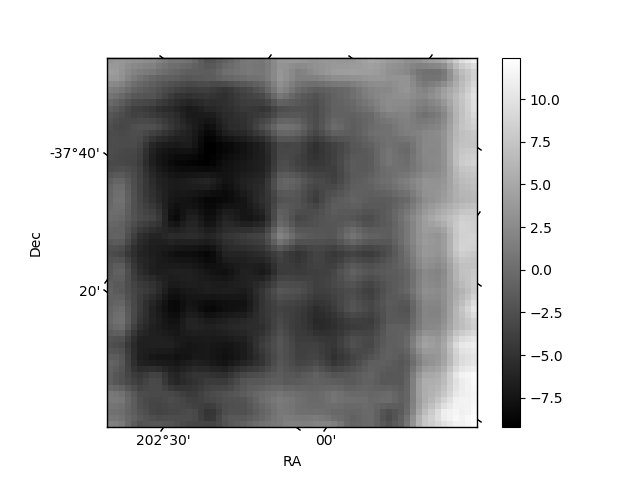
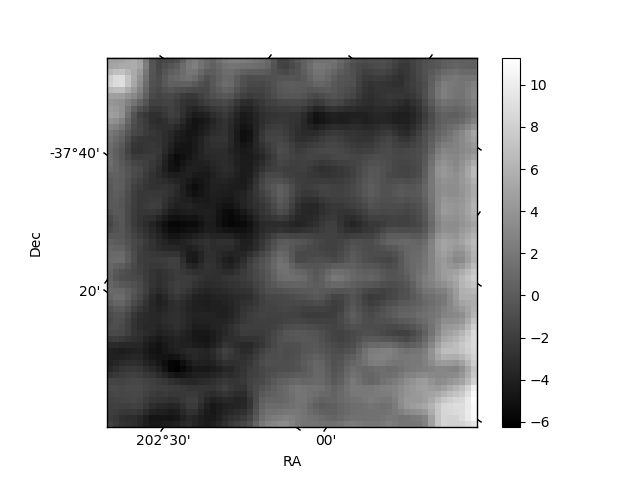
Histogram calculated using DETX and DETY for each event in the final _common_clean file
| Quadrant A | 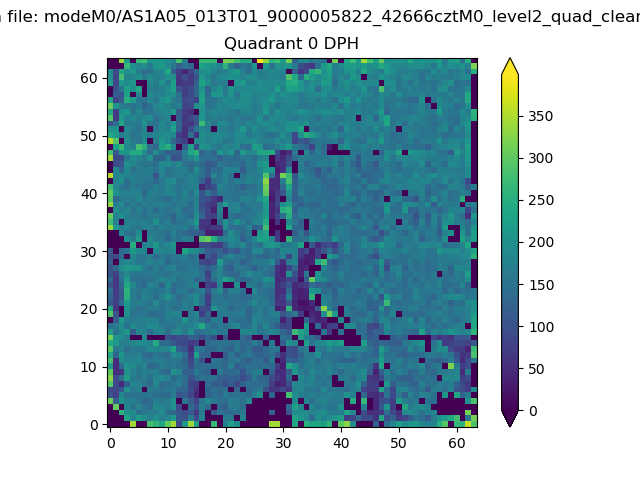 |
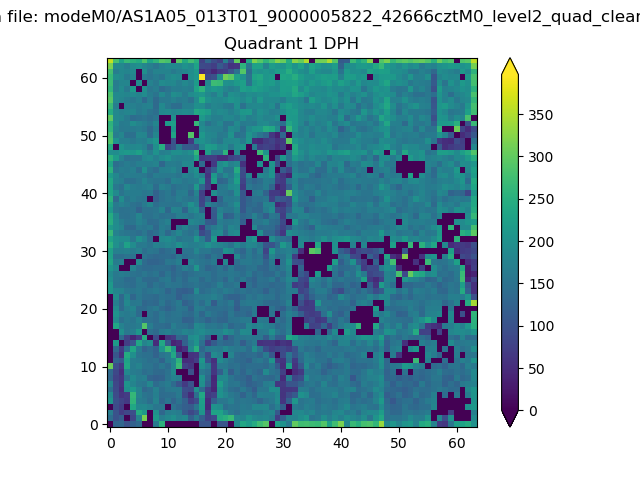 |
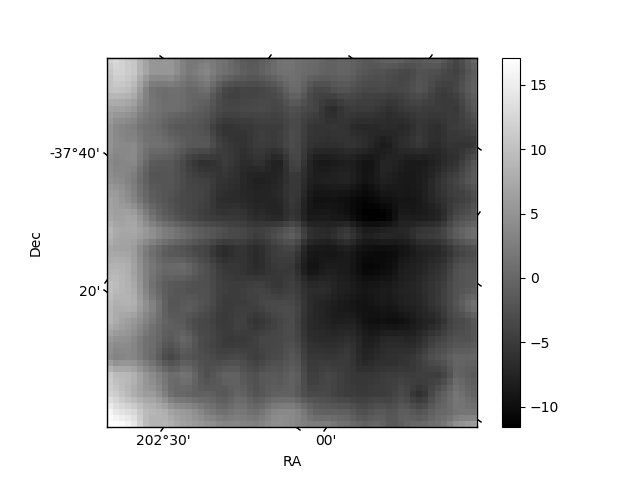
Quadrant B |
|---|---|---|---|
| Quadrant D | 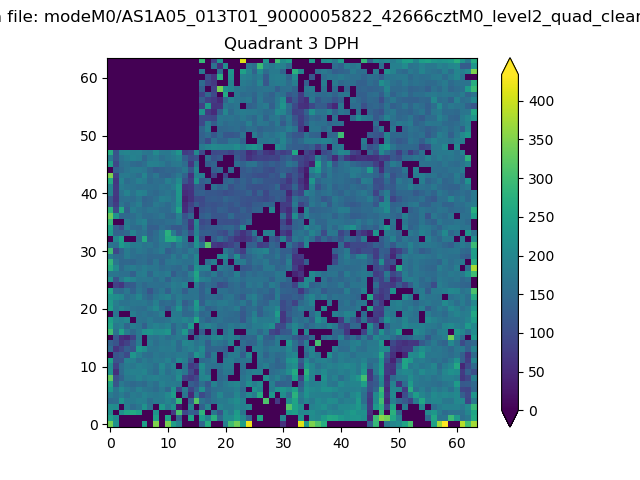 |
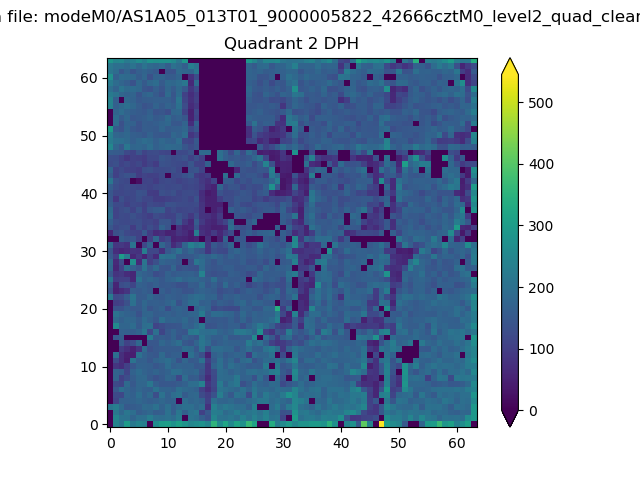 |
Quadrant C |
| Plot type | Count rate plots | Images |
|---|---|---|
| Comparison with Poisson distribution Blue bars denote a histogram of data divided into 1 sec bins. Red curve is a Poisson curve with rate = median count rate of data. |
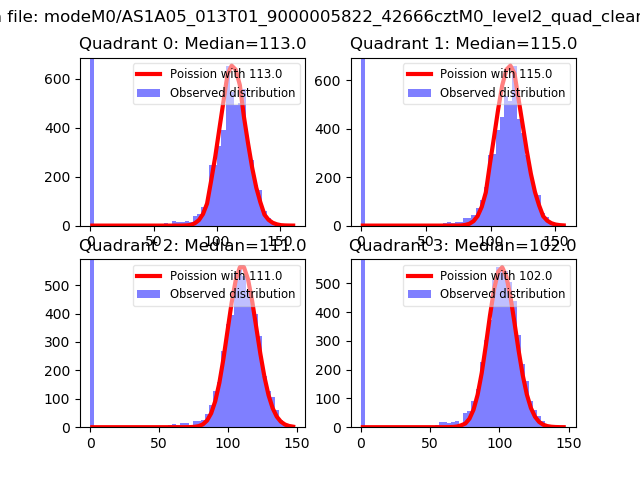 |
 |
| Quadrant-wise count rates Data is divided into 100 sec bins |
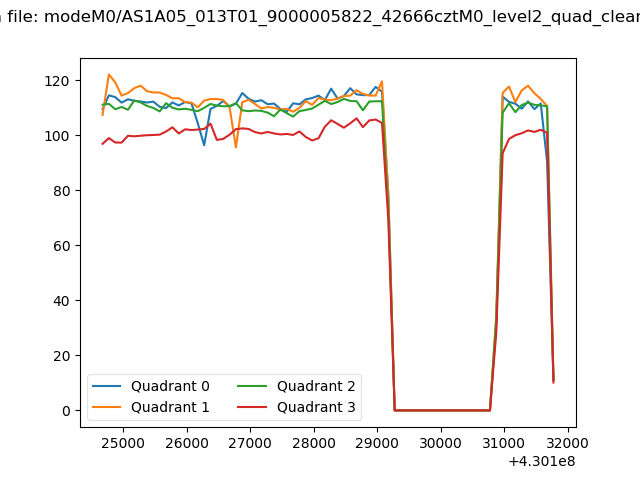 |
|
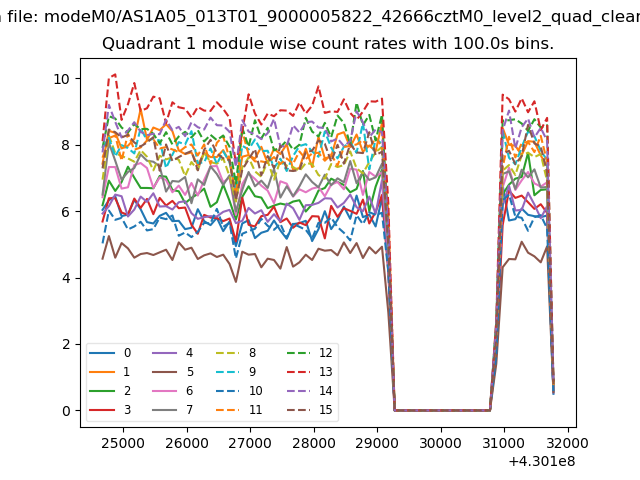
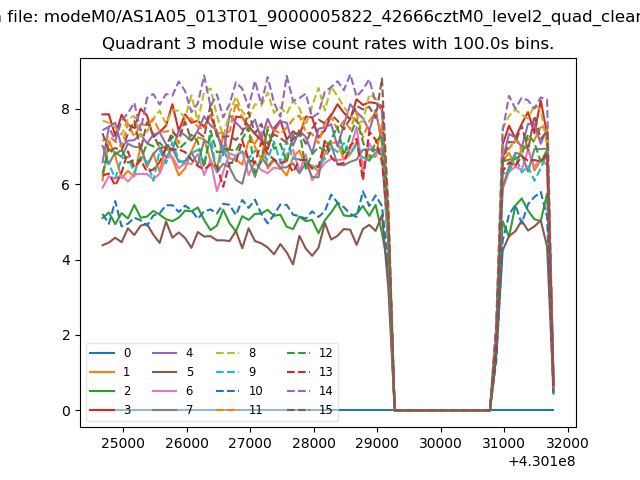
| Module-wise count rates for Quadrant A Data is divided into 100 sec bins |
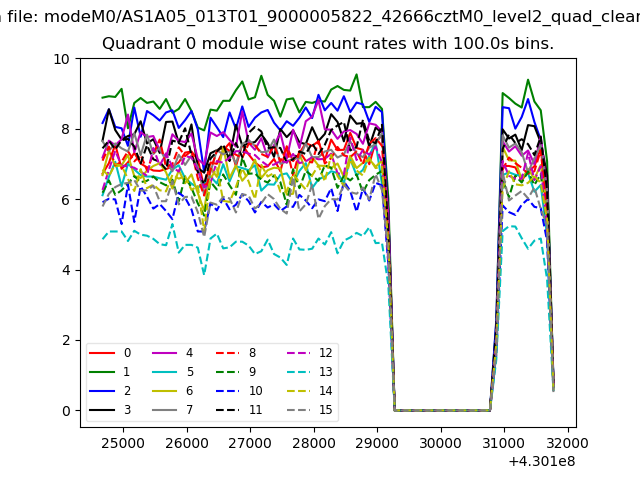 |
 |
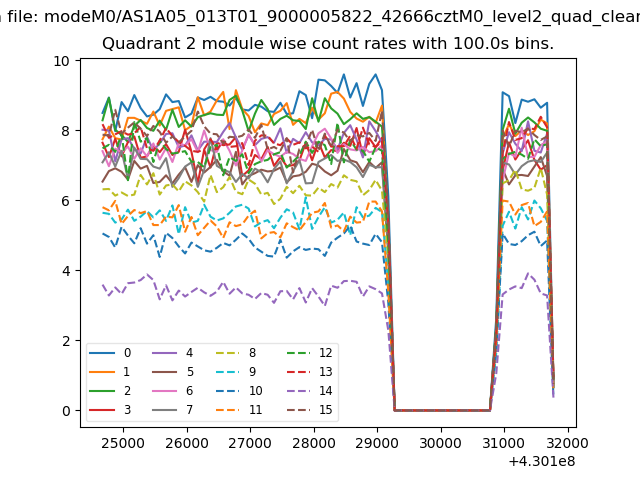
| Module-wise count rates for Quadrant B Data is divided into 100 sec bins |
 |
 |
| Module-wise count rates for Quadrant C Data is divided into 100 sec bins |
 |
 |
| Module-wise count rates for Quadrant D Data is divided into 100 sec bins |
 |
 |
| Parameter | Plot |
|---|---|
| CZT HV Monitor | 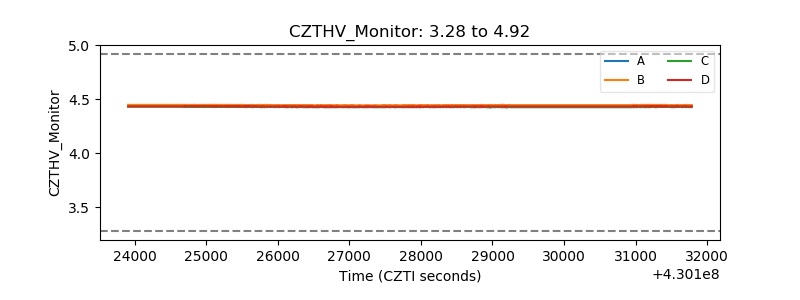 |
| D_VDD | 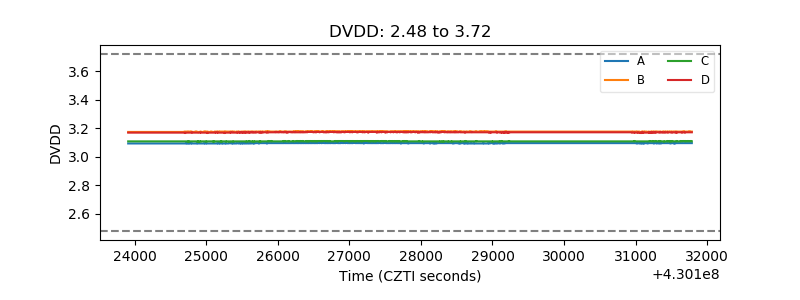 |
| Temperature 1 | 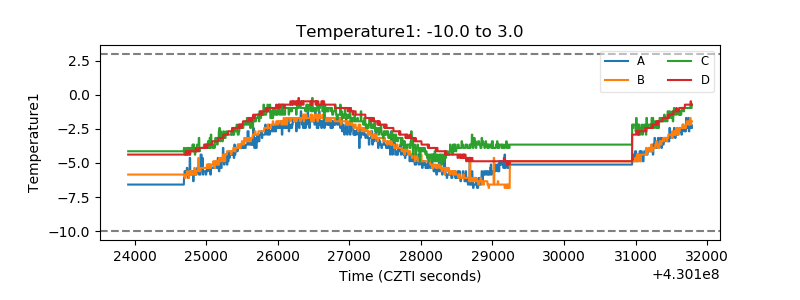 |
| Veto HV Monitor | 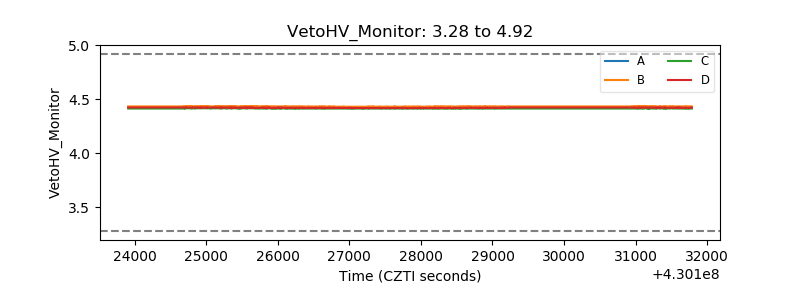 |
| Veto LLD | 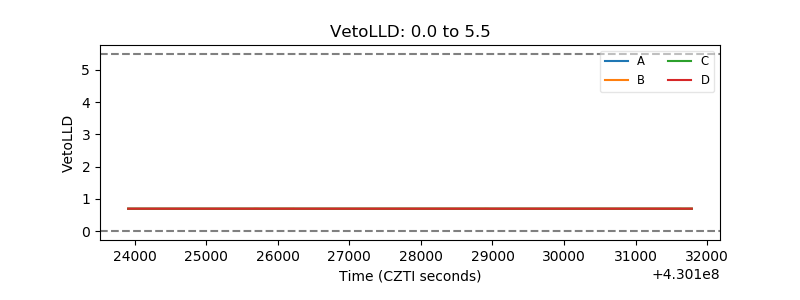 |
| Alpha Counter | 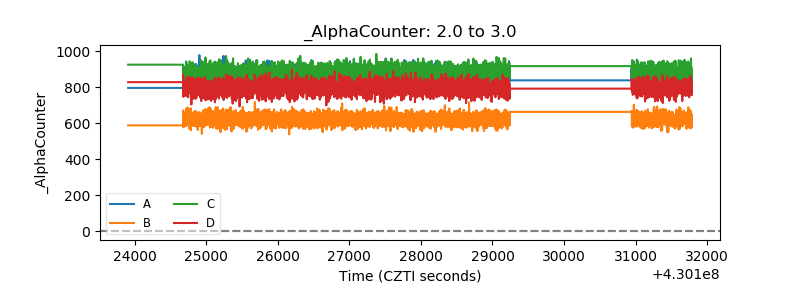 |
| _CPM_Rate | 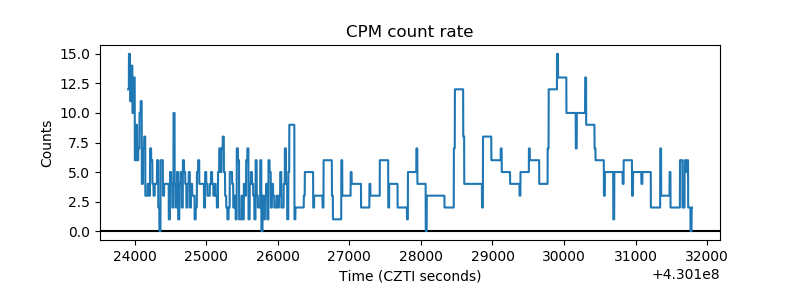 |
| CZT Counter | 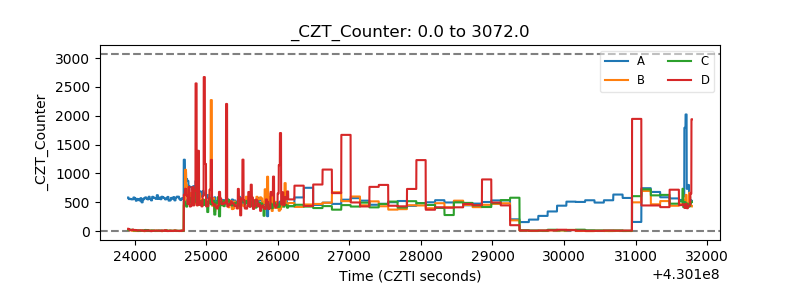 |
| +2.5 Volts monitor | 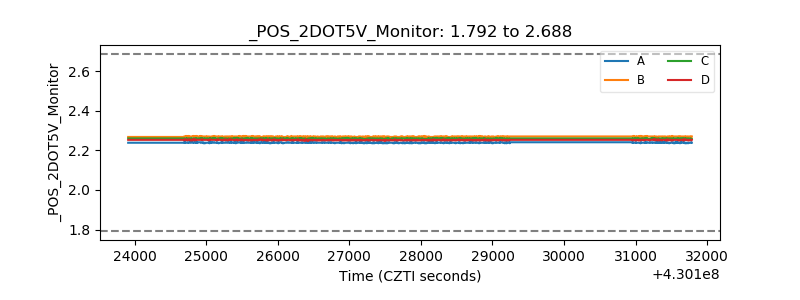 |
| +5 Volts monitor | 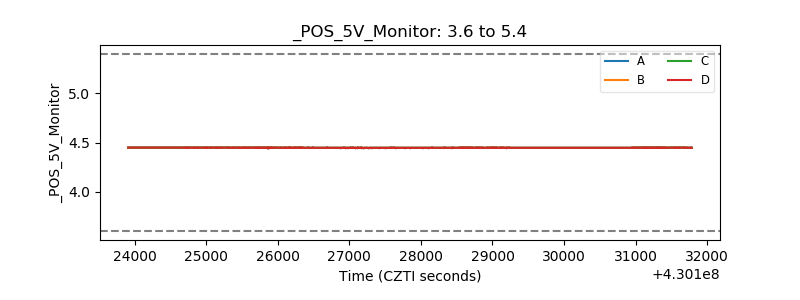 |
| _ROLL_ROT | 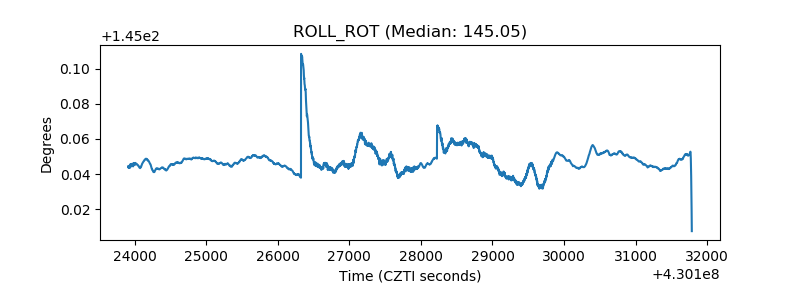 |
| _Roll_DEC | 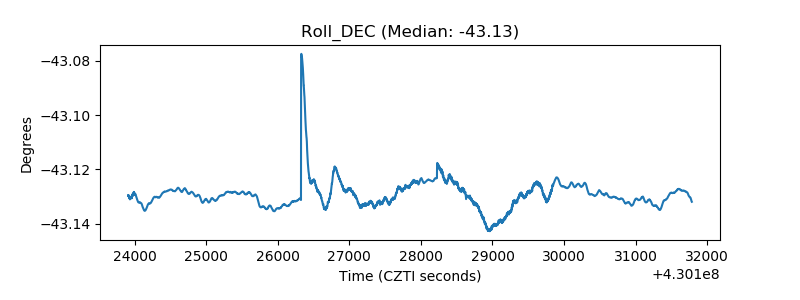 |
| _Roll_RA | 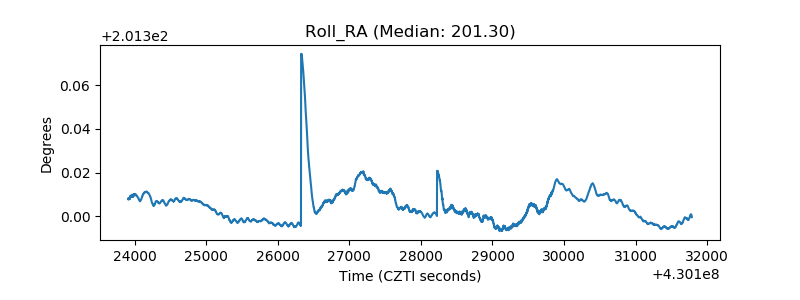 |
| Veto Counter | 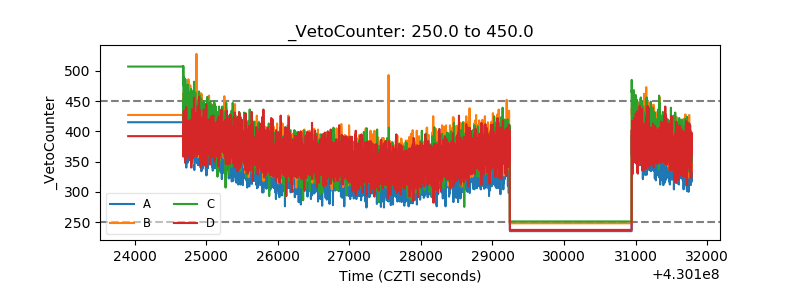 |