| Param | Original file | Final file |
|---|---|---|
| Filename | modeM0/AS1A05_013T01_9000005822_42667cztM0_level2.fits | modeM0/AS1A05_013T01_9000005822_42667cztM0_level2_quad_clean.evt |
| Size (bytes) | 385,637,760 | 95,163,840 |
| Size | 367.8 MB | 90.8 MB |
| Events in quadrant A | 3,600,454 | 638,889 |
| Events in quadrant B | 3,903,211 | 622,263 |
| Events in quadrant C | 2,934,377 | 631,221 |
| Events in quadrant D | 3,384,531 | 582,550 |
| Mode M0 | |||
|---|---|---|---|
| Quadrant | BADHDUFLAG | Total packets | Discarded packets |
| A | 0 | 14168 | 2 |
| B | 0 | 15495 | 2 |
| C | 0 | 12406 | 2 |
| D | 0 | 14014 | 2 |
| Mode M9 | |||
|---|---|---|---|
| Quadrant | BADHDUFLAG | Total packets | Discarded packets |
| A | 0 | 17 | 0 |
| B | 0 | 18 | 0 |
| C | 0 | 18 | 0 |
| D | 0 | 18 | 0 |
| Mode SS | |||
|---|---|---|---|
| Quadrant | BADHDUFLAG | Total packets | Discarded packets |
| A | 0 | 118 | 0 |
| B | 0 | 118 | 0 |
| C | 0 | 118 | 0 |
| D | 0 | 118 | 0 |
| Quadrant | Total seconds | Saturated seconds | Saturation percentage |
|---|---|---|---|
| A | 5816 | 110 | 1.891334% |
| B | 5816 | 325 | 5.588033% |
| C | 5816 | 22 | 0.378267% |
| D | 5816 | 73 | 1.255158% |
Noise dominated data is calculated using 1-second bins in cleaned event files. If a bin has >2000 counts, and if more than 50% of those come from <1% of pixels, then it is considered to be noise-dominated and hence unusable.
| Quadrant | # 1 sec bins | Bins with >0 counts | Bins with >2000 counts | High rate bins dominated by noise | Noise dominated (total time) | Noise dominated (detector-on time) | Marked lightcurve |
|---|---|---|---|---|---|---|---|
| A | 7220 | 5817 | 78 | 78 | 1.08% | 1.34% | 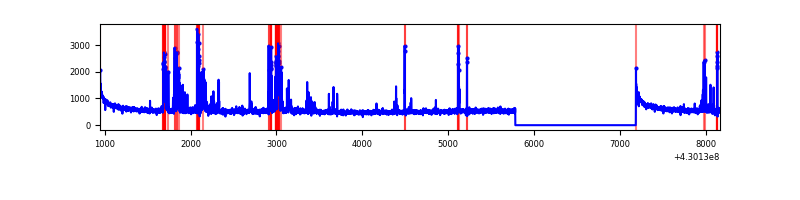 |
| B | 7220 | 5817 | 296 | 296 | 4.10% | 5.09% | 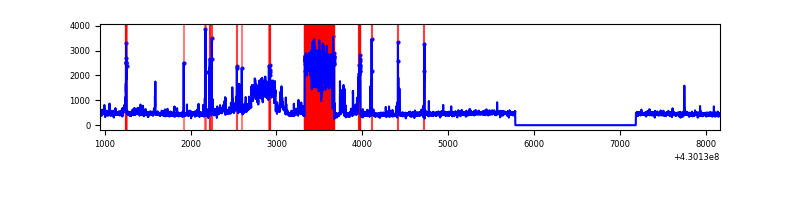 |
| C | 7220 | 5817 | 17 | 17 | 0.24% | 0.29% | 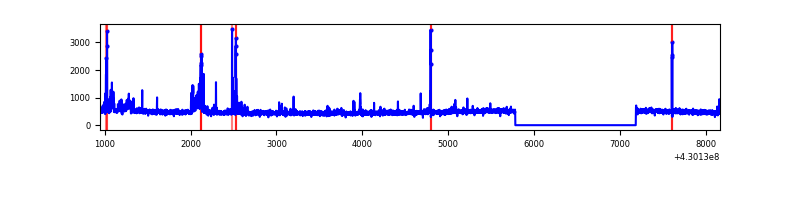 |
| D | 7220 | 5817 | 70 | 70 | 0.97% | 1.20% | 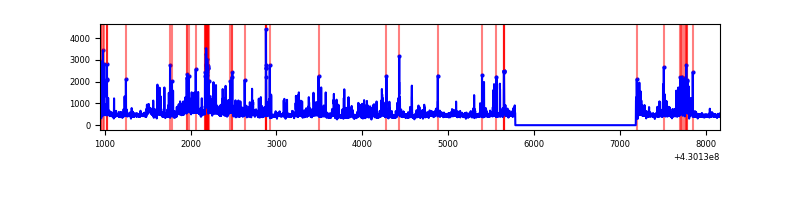 |
Top three noisy pixels from each quadrant. If the there are fewer than three noisy pixels in the level2.evt file, extra rows are filled as -1
| Pixel properties | Quadrant properties | ||||||
|---|---|---|---|---|---|---|---|
| Quadrant | DetID | PixID | Counts | Sigma | Mean | Median | Sigma |
| A | 10 | 83 | 632300 | 4749.5 | 642 | 627 | 133.0 |
| A | 15 | 223 | 232919 | 1746.59 | 642 | 627 | 133.0 |
| A | 13 | 248 | 149769 | 1121.39 | 642 | 627 | 133.0 |
| B | 10 | 246 | 1219279 | 10022.79 | 622 | 604 | 121.6 |
| B | 0 | 245 | 81059 | 661.69 | 622 | 604 | 121.6 |
| B | 15 | 35 | 55890 | 454.69 | 622 | 604 | 121.6 |
| C | 15 | 214 | 245751 | 1684.8 | 622 | 626 | 145.5 |
| C | 14 | 254 | 150206 | 1028.1 | 622 | 626 | 145.5 |
| C | 3 | 233 | 39654 | 268.25 | 622 | 626 | 145.5 |
| D | 2 | 249 | 235485 | 1532.1 | 625 | 606 | 153.3 |
| D | 1 | 52 | 219533 | 1428.04 | 625 | 606 | 153.3 |
| D | 12 | 218 | 202829 | 1319.09 | 625 | 606 | 153.3 |
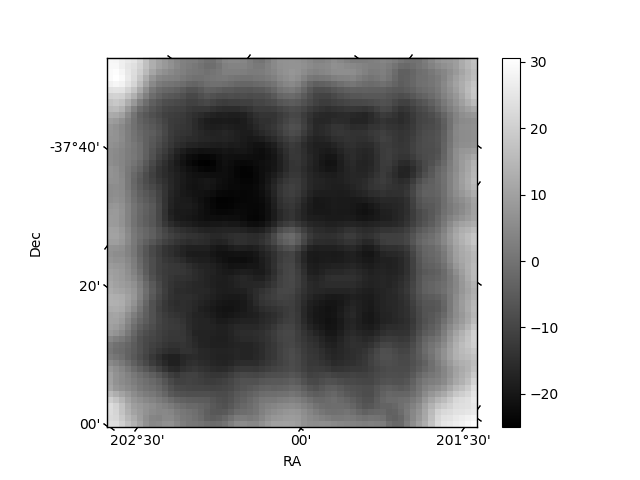
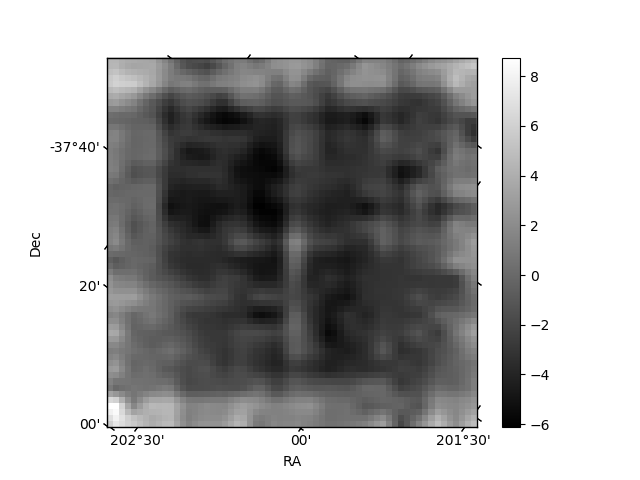
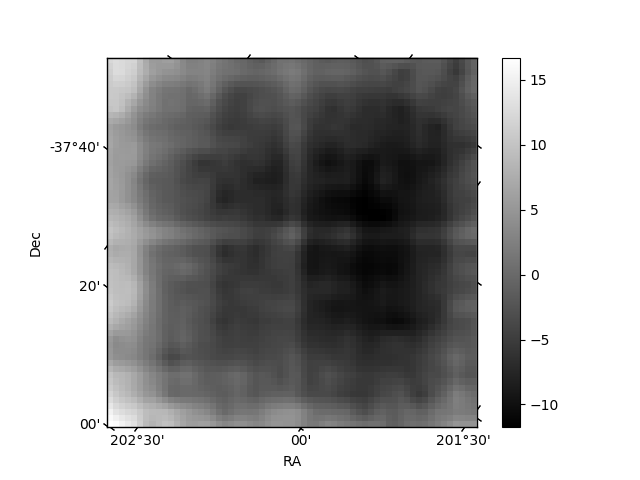
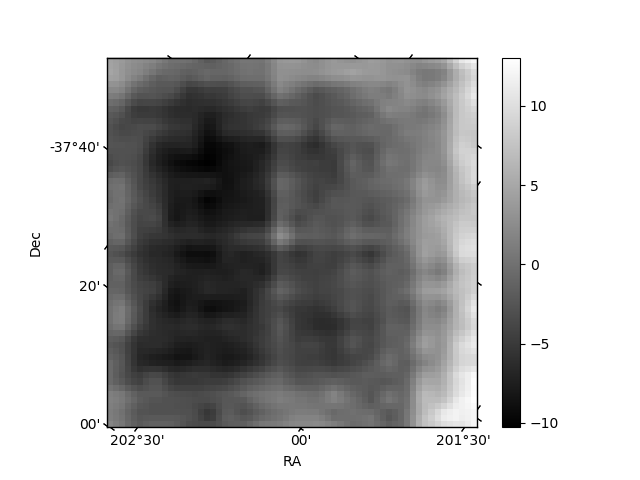
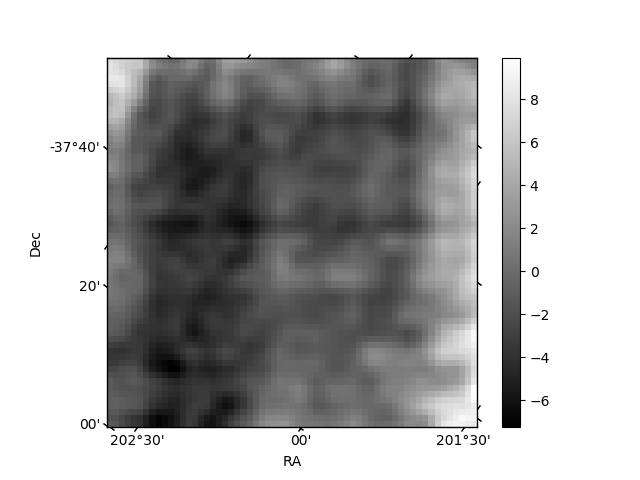
Histogram calculated using DETX and DETY for each event in the final _common_clean file
| Quadrant A | 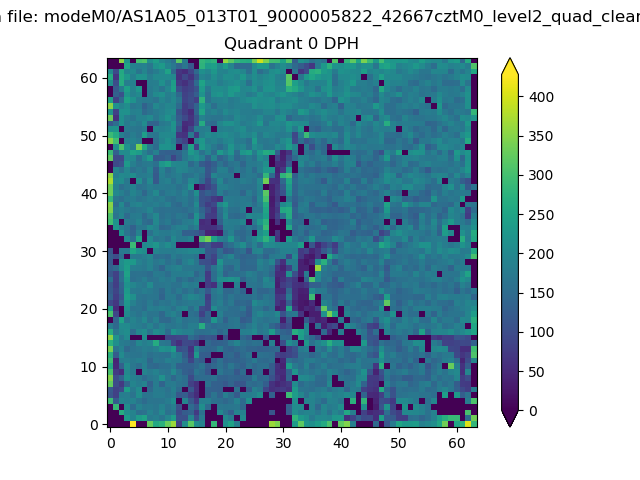 |
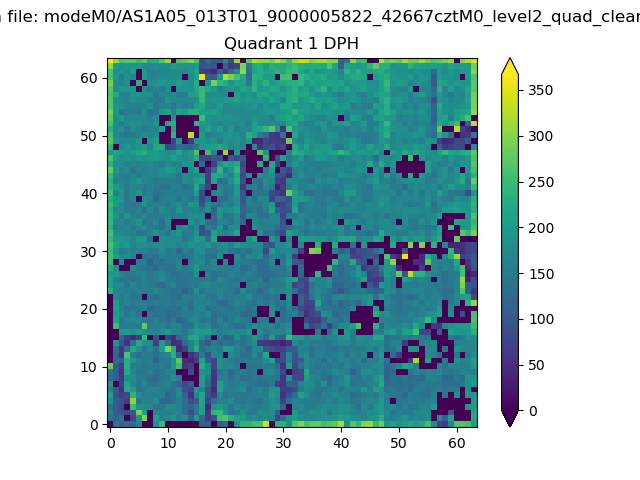 |
Quadrant B |
|---|---|---|---|
| Quadrant D | 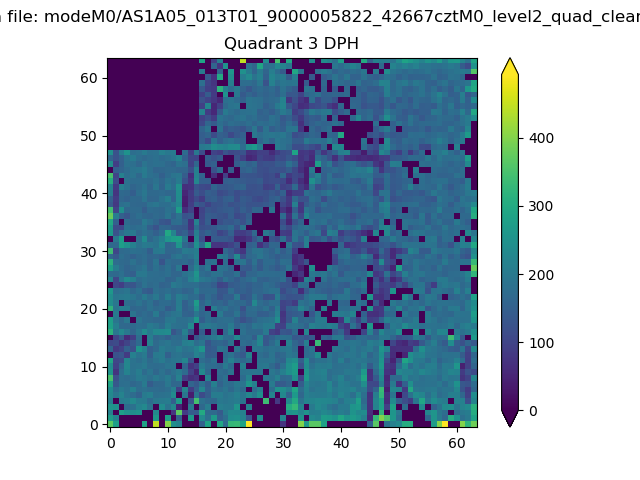 |
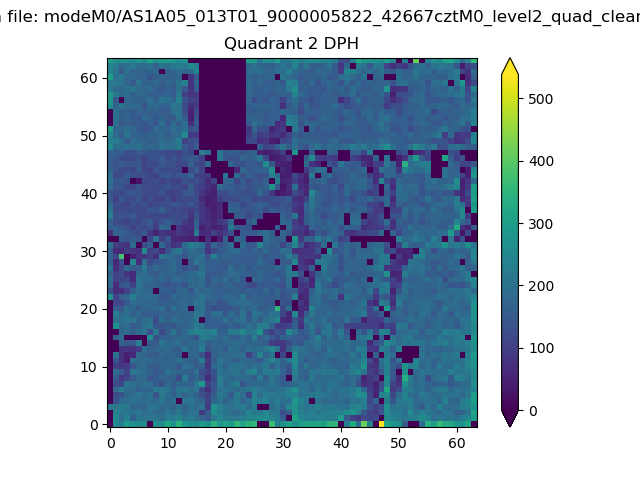 |
Quadrant C |
| Plot type | Count rate plots | Images |
|---|---|---|
| Comparison with Poisson distribution Blue bars denote a histogram of data divided into 1 sec bins. Red curve is a Poisson curve with rate = median count rate of data. |
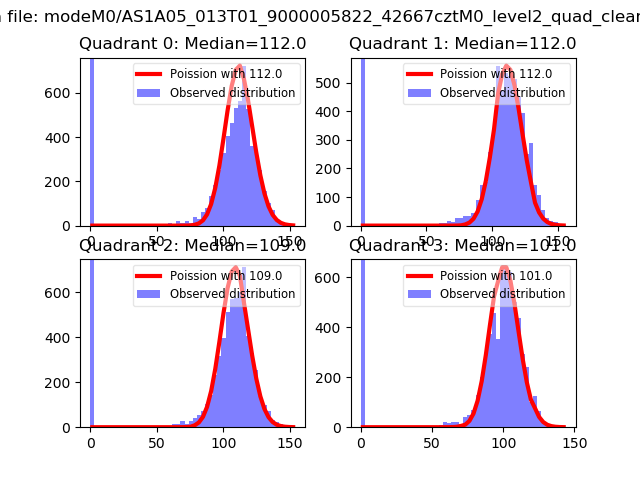 |
 |
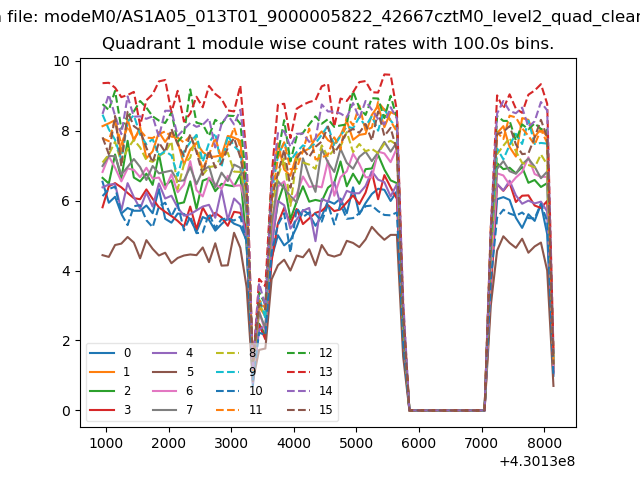
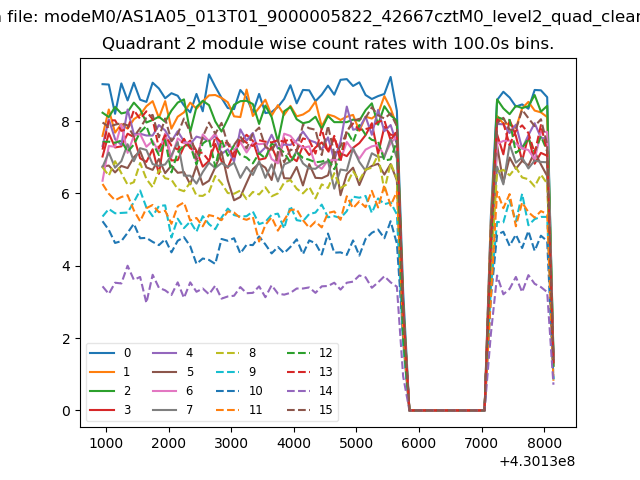
| Quadrant-wise count rates Data is divided into 100 sec bins |
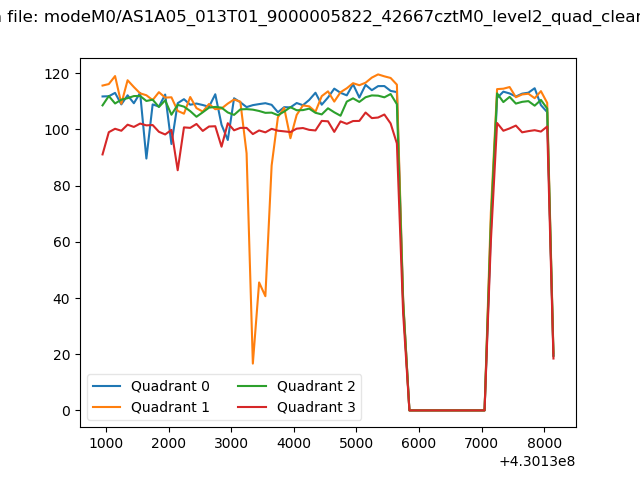 |
|
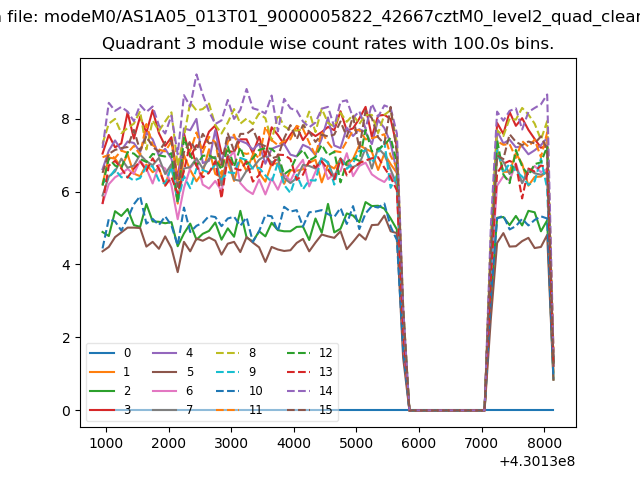
| Module-wise count rates for Quadrant A Data is divided into 100 sec bins |
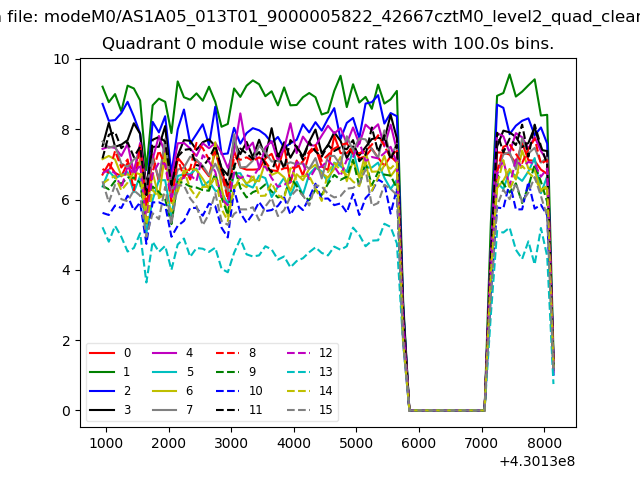 |
 |
| Module-wise count rates for Quadrant B Data is divided into 100 sec bins |
 |
 |
| Module-wise count rates for Quadrant C Data is divided into 100 sec bins |
 |
 |
| Module-wise count rates for Quadrant D Data is divided into 100 sec bins |
 |
 |
| Parameter | Plot |
|---|---|
| CZT HV Monitor | 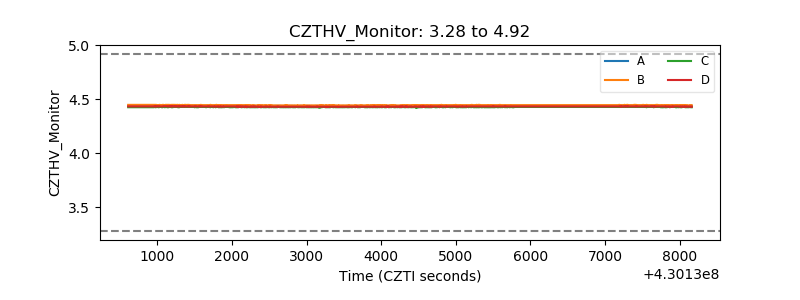 |
| D_VDD | 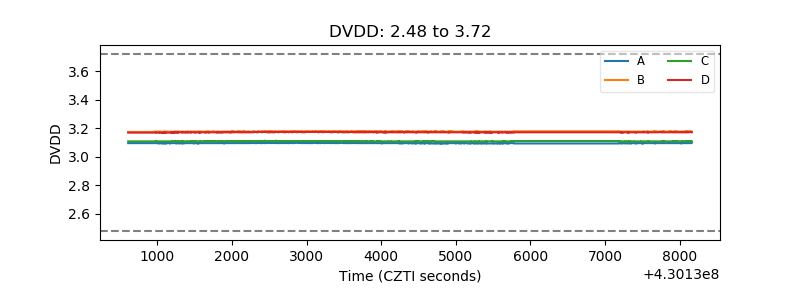 |
| Temperature 1 | 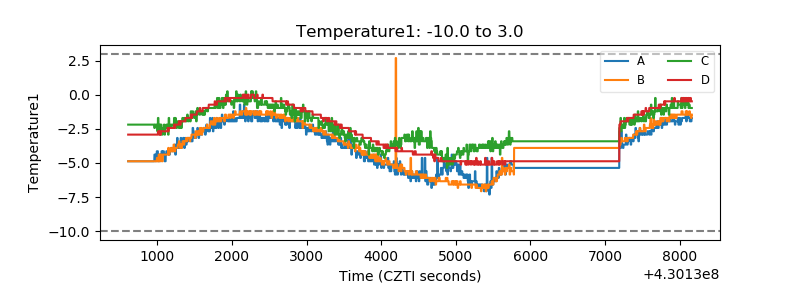 |
| Veto HV Monitor | 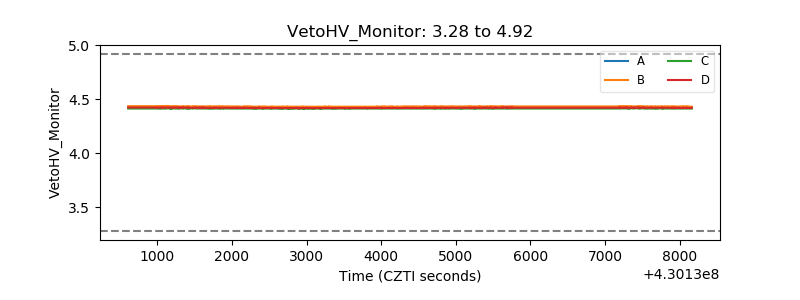 |
| Veto LLD | 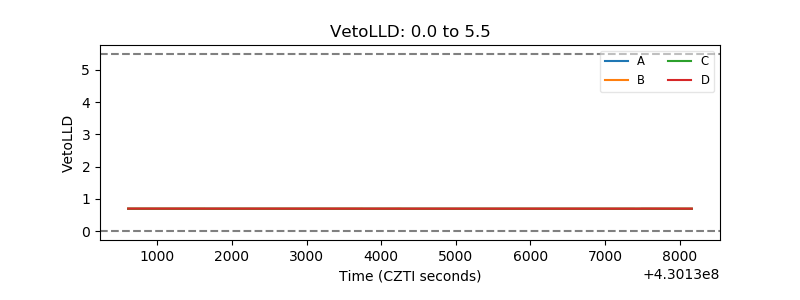 |
| Alpha Counter | 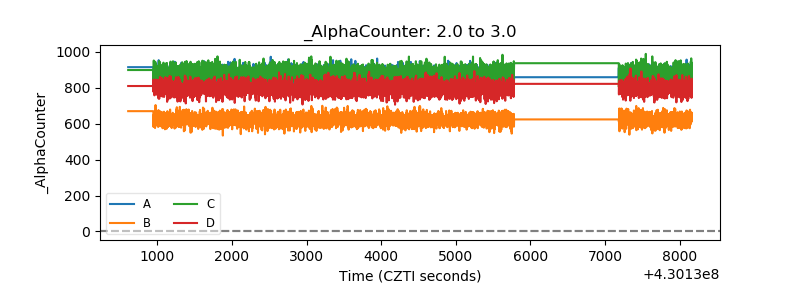 |
| _CPM_Rate | 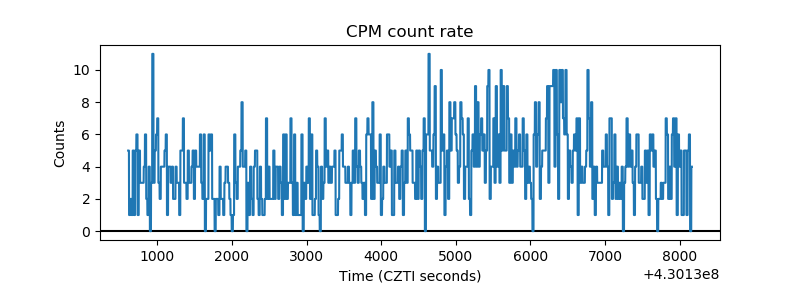 |
| CZT Counter | 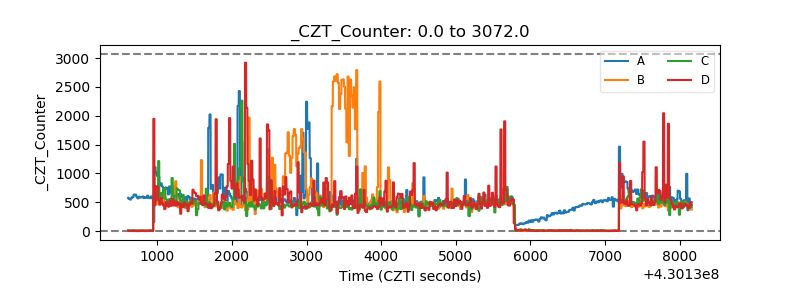 |
| +2.5 Volts monitor | 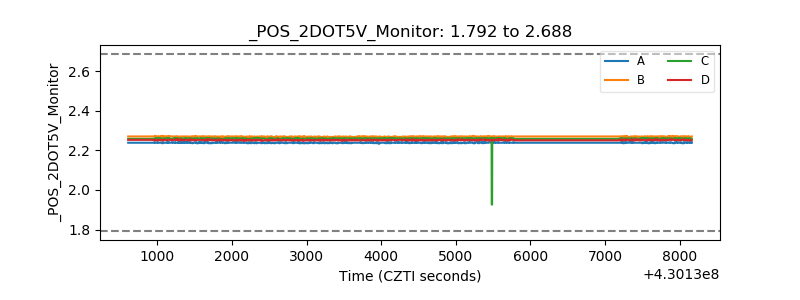 |
| +5 Volts monitor |  |
| _ROLL_ROT |  |
| _Roll_DEC | 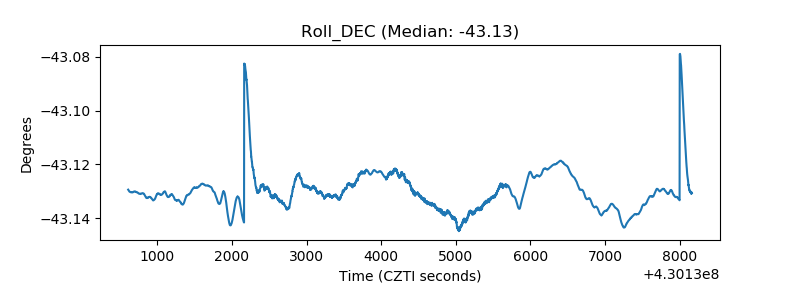 |
| _Roll_RA | 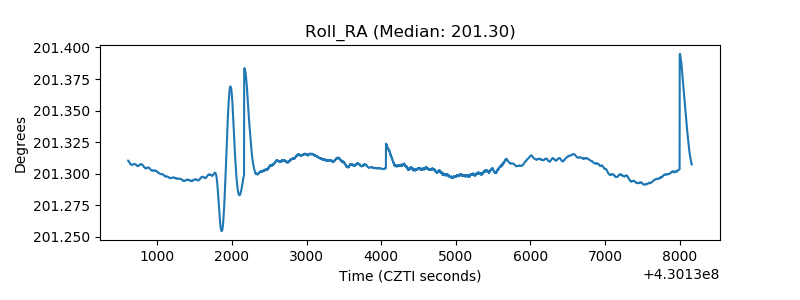 |
| Veto Counter | 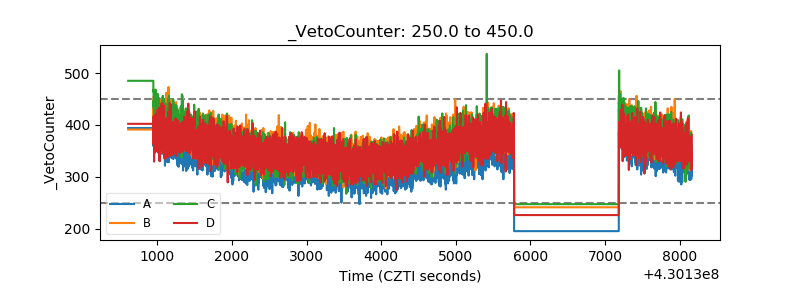 |