| Param | Original file | Final file |
|---|---|---|
| Filename | modeM0/AS1A05_013T01_9000005822_42668cztM0_level2.fits | modeM0/AS1A05_013T01_9000005822_42668cztM0_level2_quad_clean.evt |
| Size (bytes) | 353,721,600 | 97,424,640 |
| Size | 337.3 MB | 92.9 MB |
| Events in quadrant A | 3,406,564 | 651,674 |
| Events in quadrant B | 2,892,523 | 660,741 |
| Events in quadrant C | 3,176,361 | 633,000 |
| Events in quadrant D | 3,156,204 | 589,990 |
| Mode M0 | |||
|---|---|---|---|
| Quadrant | BADHDUFLAG | Total packets | Discarded packets |
| A | 0 | 13594 | 2 |
| B | 0 | 12577 | 2 |
| C | 0 | 13258 | 2 |
| D | 0 | 13583 | 2 |
| Mode M9 | |||
|---|---|---|---|
| Quadrant | BADHDUFLAG | Total packets | Discarded packets |
| A | 0 | 16 | 0 |
| B | 0 | 17 | 0 |
| C | 0 | 17 | 0 |
| D | 0 | 17 | 0 |
| Mode SS | |||
|---|---|---|---|
| Quadrant | BADHDUFLAG | Total packets | Discarded packets |
| A | 0 | 120 | 0 |
| B | 0 | 120 | 0 |
| C | 0 | 120 | 0 |
| D | 0 | 120 | 0 |
| Quadrant | Total seconds | Saturated seconds | Saturation percentage |
|---|---|---|---|
| A | 5934 | 72 | 1.213347% |
| B | 5934 | 25 | 0.421301% |
| C | 5934 | 88 | 1.482979% |
| D | 5934 | 80 | 1.348163% |
Noise dominated data is calculated using 1-second bins in cleaned event files. If a bin has >2000 counts, and if more than 50% of those come from <1% of pixels, then it is considered to be noise-dominated and hence unusable.
| Quadrant | # 1 sec bins | Bins with >0 counts | Bins with >2000 counts | High rate bins dominated by noise | Noise dominated (total time) | Noise dominated (detector-on time) | Marked lightcurve |
|---|---|---|---|---|---|---|---|
| A | 7217 | 5935 | 52 | 52 | 0.72% | 0.88% | 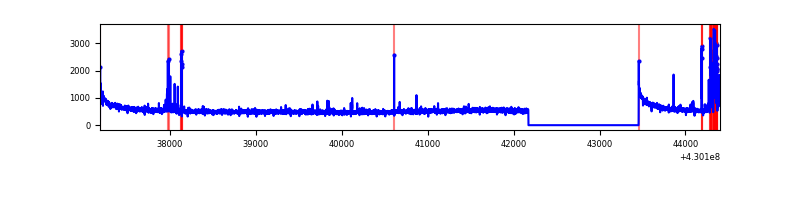 |
| B | 7217 | 5935 | 16 | 16 | 0.22% | 0.27% | 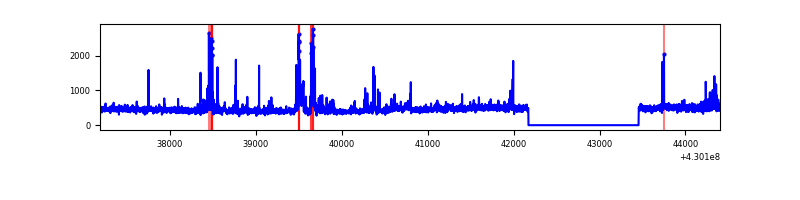 |
| C | 7217 | 5935 | 80 | 80 | 1.11% | 1.35% | 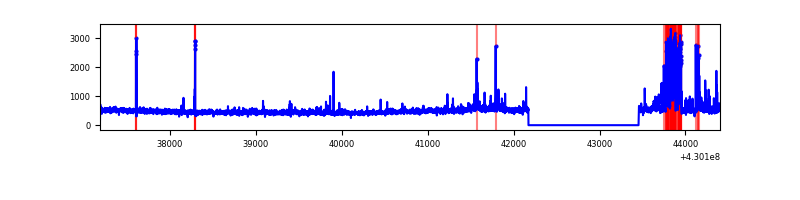 |
| D | 7217 | 5935 | 76 | 76 | 1.05% | 1.28% | 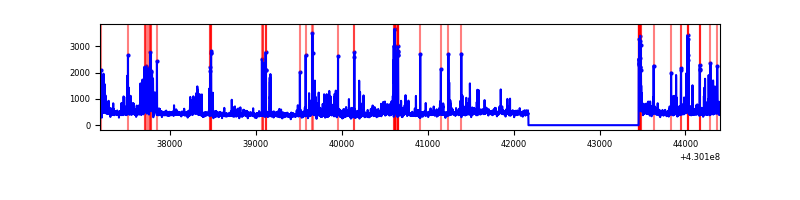 |
Top three noisy pixels from each quadrant. If the there are fewer than three noisy pixels in the level2.evt file, extra rows are filled as -1
| Pixel properties | Quadrant properties | ||||||
|---|---|---|---|---|---|---|---|
| Quadrant | DetID | PixID | Counts | Sigma | Mean | Median | Sigma |
| A | 10 | 83 | 638599 | 4688.84 | 655 | 640 | 136.1 |
| A | 15 | 223 | 163106 | 1194.09 | 655 | 640 | 136.1 |
| A | 13 | 248 | 52238 | 379.23 | 655 | 640 | 136.1 |
| B | 0 | 168 | 200519 | 1585.8 | 646 | 627 | 126.1 |
| B | 15 | 85 | 39543 | 308.73 | 646 | 627 | 126.1 |
| B | 5 | 255 | 35428 | 276.09 | 646 | 627 | 126.1 |
| C | 14 | 254 | 271239 | 1825.79 | 632 | 635 | 148.2 |
| C | 15 | 214 | 247646 | 1666.6 | 632 | 635 | 148.2 |
| C | 8 | 79 | 70399 | 470.7 | 632 | 635 | 148.2 |
| D | 2 | 249 | 227225 | 1457.59 | 636 | 616 | 155.5 |
| D | 1 | 47 | 225524 | 1446.65 | 636 | 616 | 155.5 |
| D | 12 | 233 | 64435 | 410.5 | 636 | 616 | 155.5 |
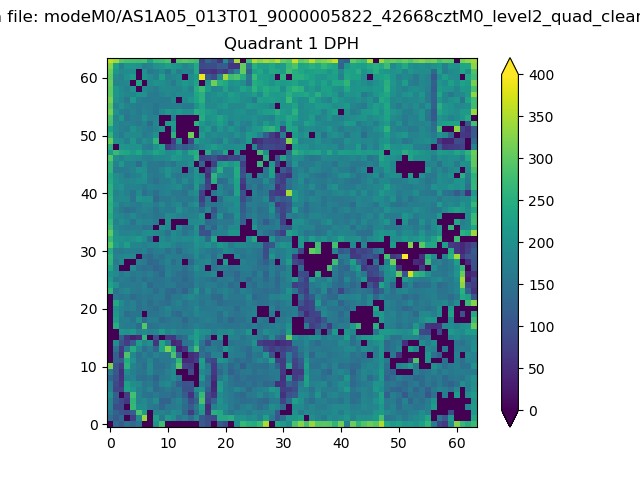
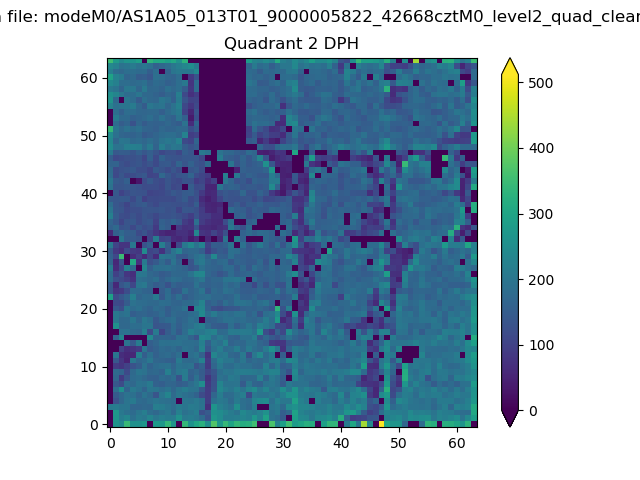
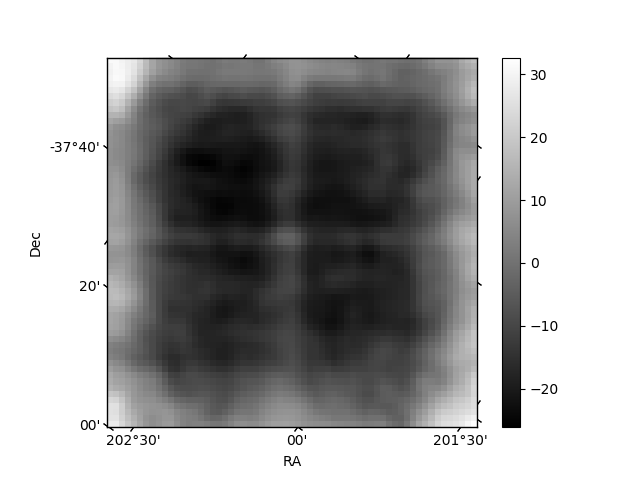
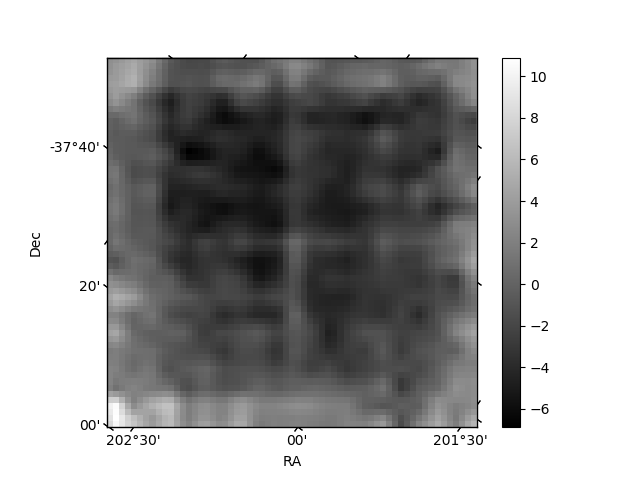
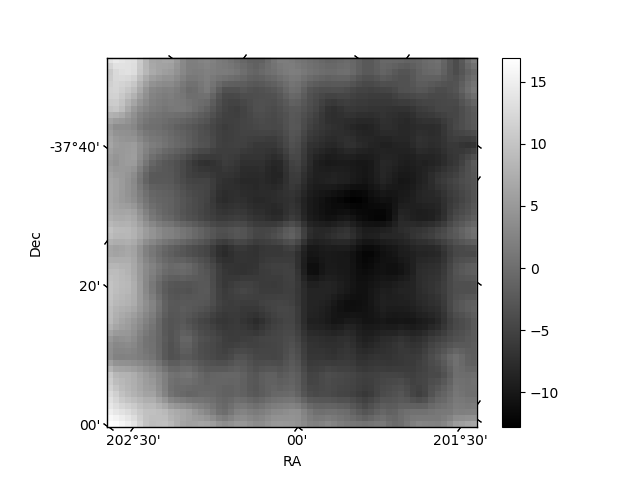
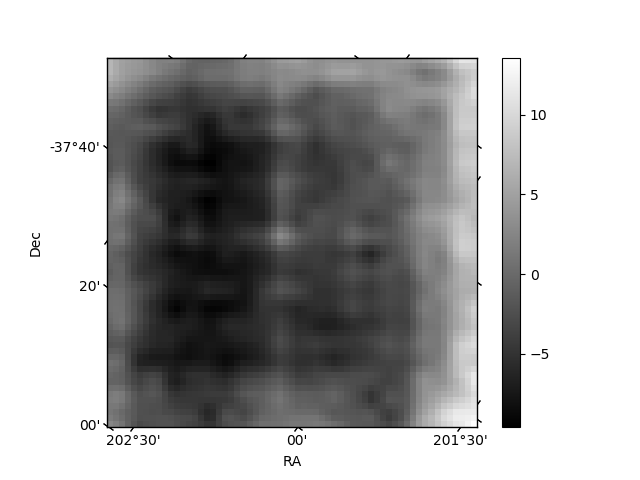
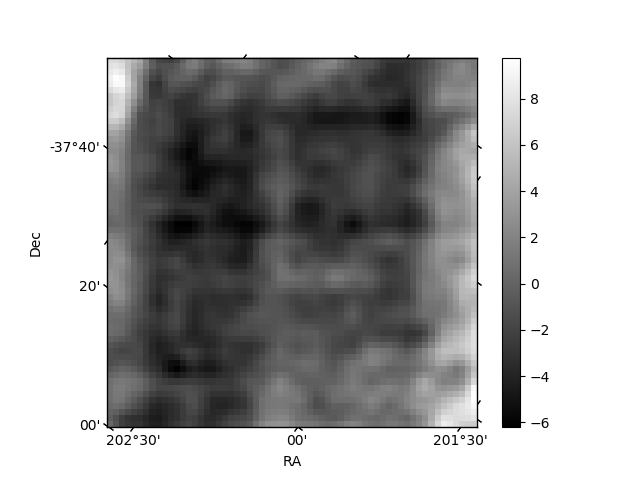
Histogram calculated using DETX and DETY for each event in the final _common_clean file
| Quadrant A |  |
 |
Quadrant B |
|---|---|---|---|
| Quadrant D | 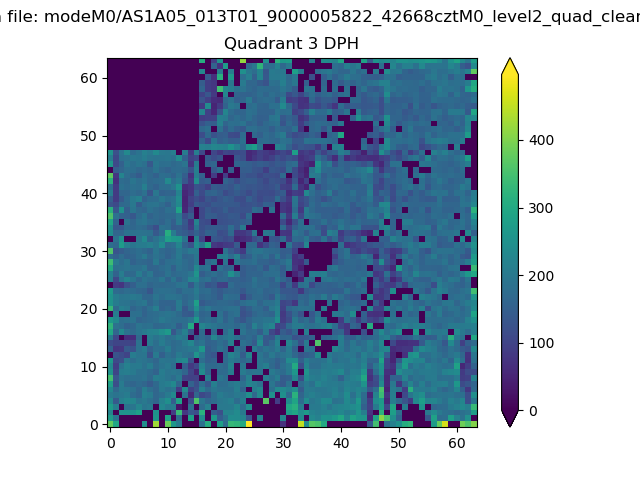 |
 |
Quadrant C |
| Plot type | Count rate plots | Images |
|---|---|---|
| Comparison with Poisson distribution Blue bars denote a histogram of data divided into 1 sec bins. Red curve is a Poisson curve with rate = median count rate of data. |
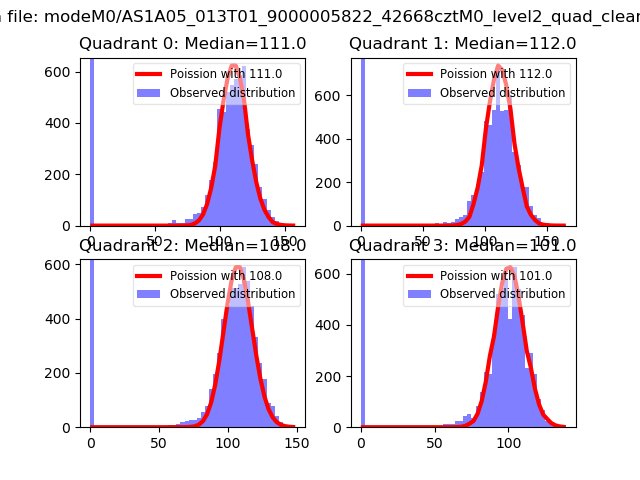 |
 |
| Quadrant-wise count rates Data is divided into 100 sec bins |
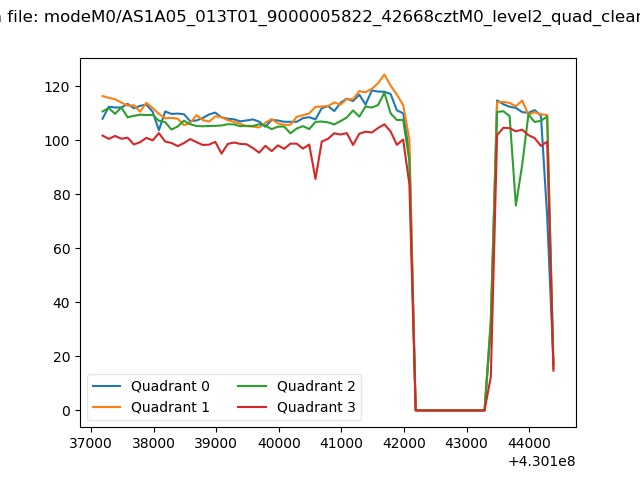 |
|
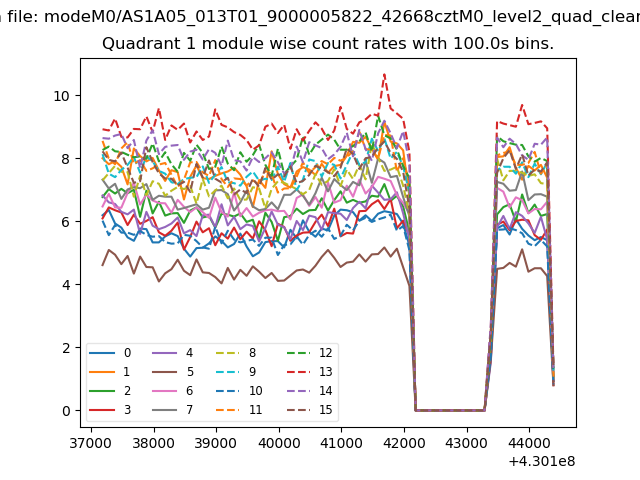
| Module-wise count rates for Quadrant A Data is divided into 100 sec bins |
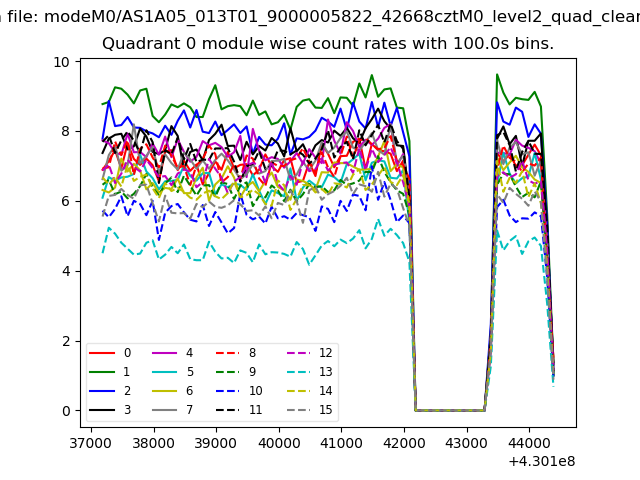 |
 |
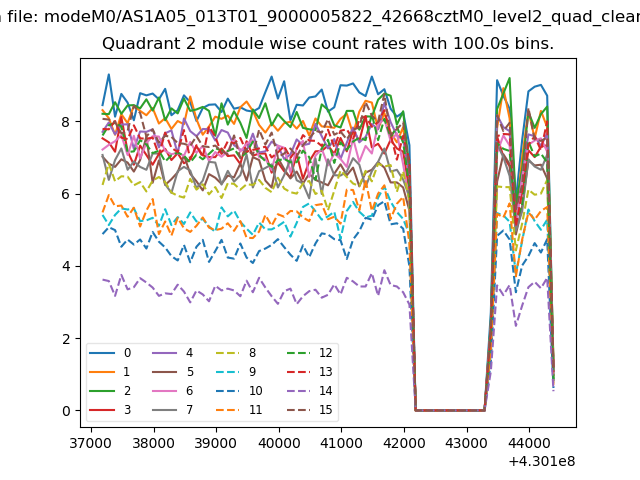
| Module-wise count rates for Quadrant B Data is divided into 100 sec bins |
 |
 |
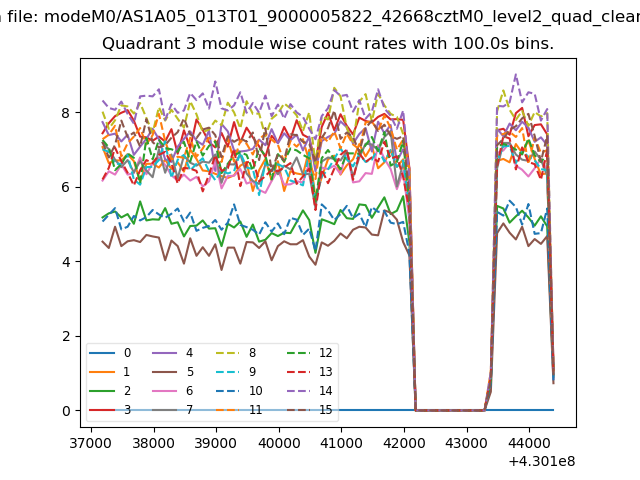
| Module-wise count rates for Quadrant C Data is divided into 100 sec bins |
 |
 |
| Module-wise count rates for Quadrant D Data is divided into 100 sec bins |
 |
 |
| Parameter | Plot |
|---|---|
| CZT HV Monitor | 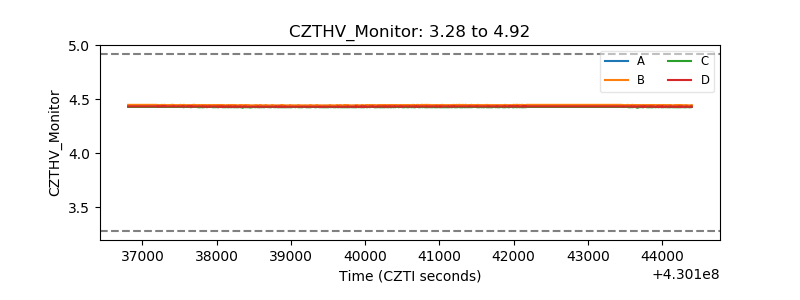 |
| D_VDD | 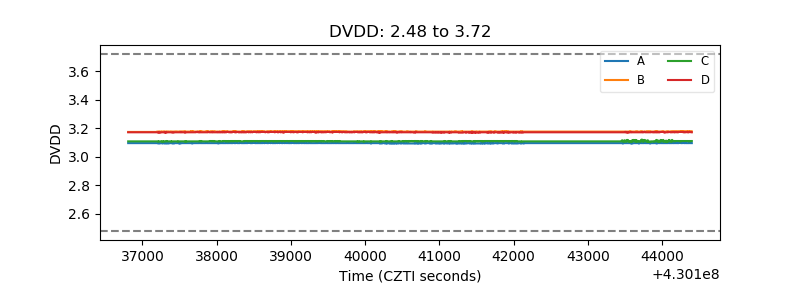 |
| Temperature 1 | 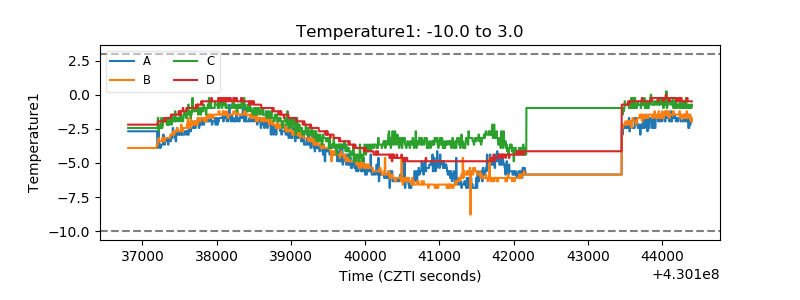 |
| Veto HV Monitor | 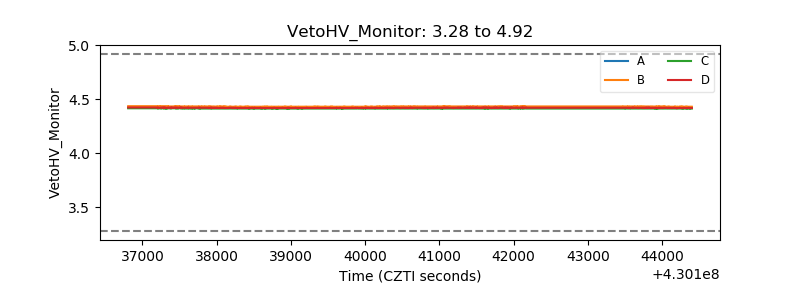 |
| Veto LLD | 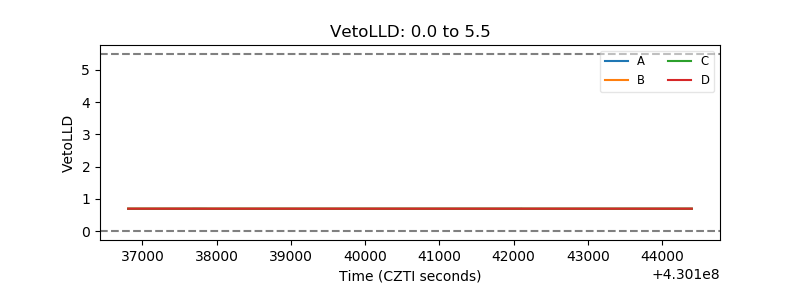 |
| Alpha Counter | 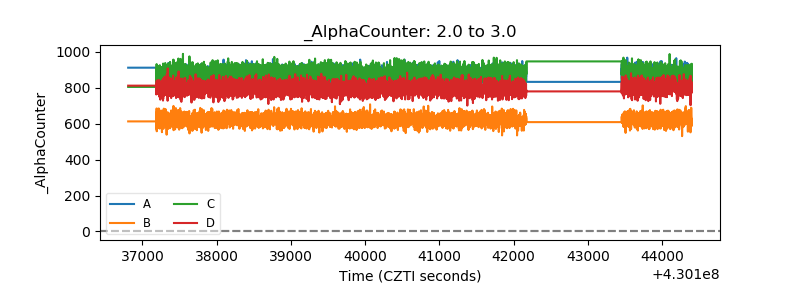 |
| _CPM_Rate | 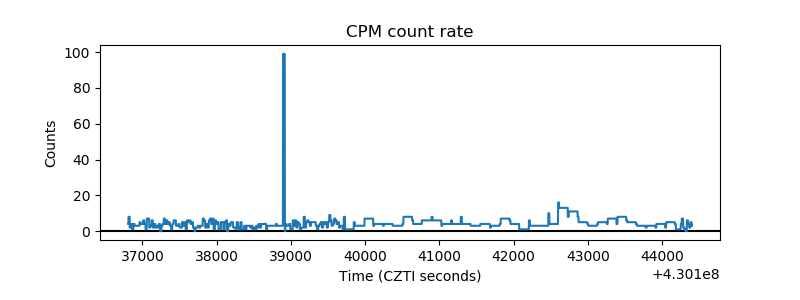 |
| CZT Counter | 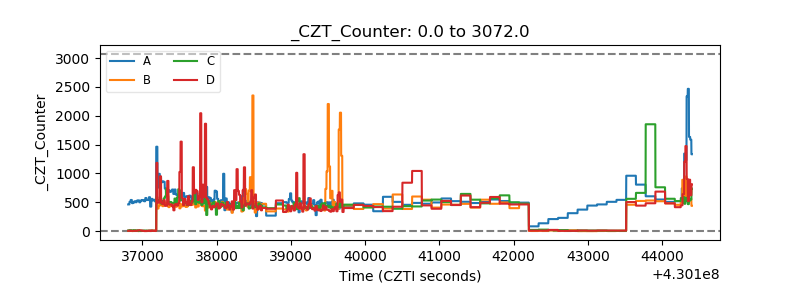 |
| +2.5 Volts monitor | 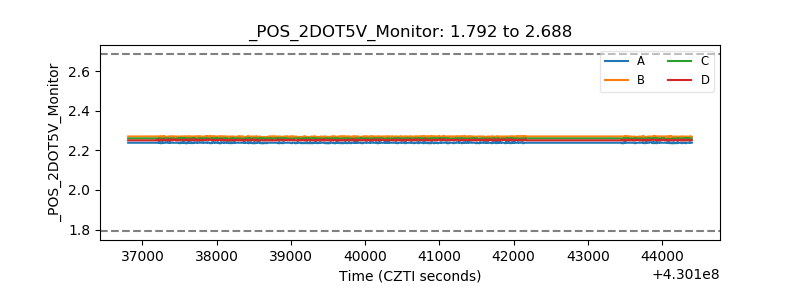 |
| +5 Volts monitor | 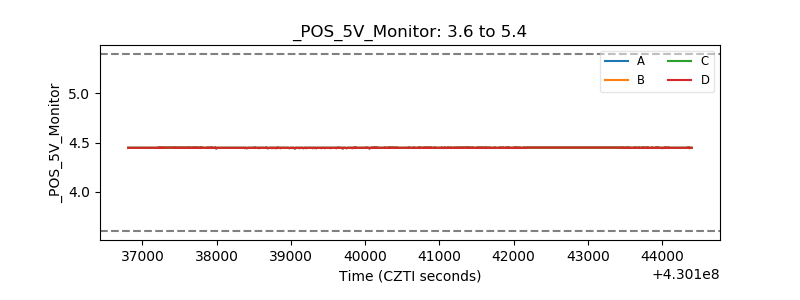 |
| _ROLL_ROT | 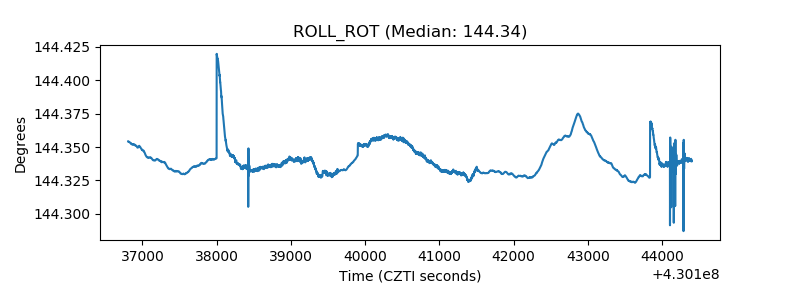 |
| _Roll_DEC | 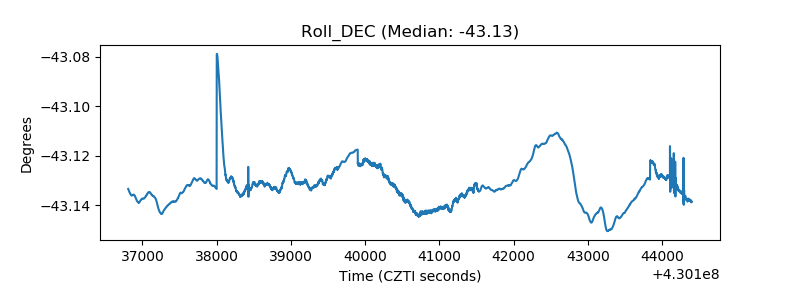 |
| _Roll_RA | 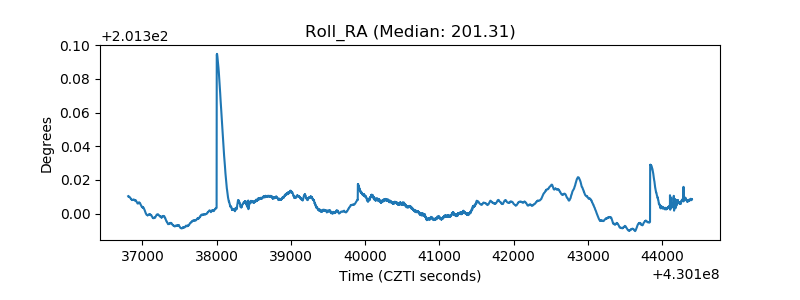 |
| Veto Counter |  |