| Param | Original file | Final file |
|---|---|---|
| Filename | modeM0/AS1A05_013T01_9000005822_42672cztM0_level2.fits | modeM0/AS1A05_013T01_9000005822_42672cztM0_level2_quad_clean.evt |
| Size (bytes) | 319,991,040 | 90,498,240 |
| Size | 305.2 MB | 86.3 MB |
| Events in quadrant A | 2,968,277 | 607,327 |
| Events in quadrant B | 2,738,754 | 613,878 |
| Events in quadrant C | 2,712,061 | 588,570 |
| Events in quadrant D | 2,991,292 | 540,116 |
| Mode M0 | |||
|---|---|---|---|
| Quadrant | BADHDUFLAG | Total packets | Discarded packets |
| A | 0 | 12149 | 2 |
| B | 0 | 11993 | 2 |
| C | 0 | 11667 | 2 |
| D | 0 | 13027 | 2 |
| Mode M9 | |||
|---|---|---|---|
| Quadrant | BADHDUFLAG | Total packets | Discarded packets |
| A | 0 | 22 | 0 |
| B | 0 | 23 | 0 |
| C | 0 | 23 | 0 |
| D | 0 | 23 | 0 |
| Mode SS | |||
|---|---|---|---|
| Quadrant | BADHDUFLAG | Total packets | Discarded packets |
| A | 0 | 114 | 0 |
| B | 0 | 114 | 0 |
| C | 0 | 114 | 0 |
| D | 0 | 114 | 0 |
| Quadrant | Total seconds | Saturated seconds | Saturation percentage |
|---|---|---|---|
| A | 5577 | 16 | 0.286893% |
| B | 5577 | 46 | 0.824816% |
| C | 5577 | 16 | 0.286893% |
| D | 5577 | 121 | 2.169625% |
Noise dominated data is calculated using 1-second bins in cleaned event files. If a bin has >2000 counts, and if more than 50% of those come from <1% of pixels, then it is considered to be noise-dominated and hence unusable.
| Quadrant | # 1 sec bins | Bins with >0 counts | Bins with >2000 counts | High rate bins dominated by noise | Noise dominated (total time) | Noise dominated (detector-on time) | Marked lightcurve |
|---|---|---|---|---|---|---|---|
| A | 7190 | 5578 | 6 | 6 | 0.08% | 0.11% | 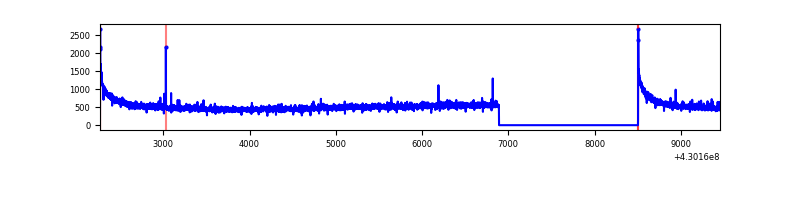 |
| B | 7190 | 5578 | 32 | 32 | 0.45% | 0.57% | 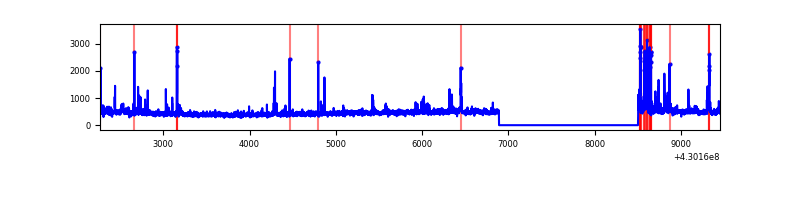 |
| C | 7190 | 5578 | 8 | 8 | 0.11% | 0.14% | 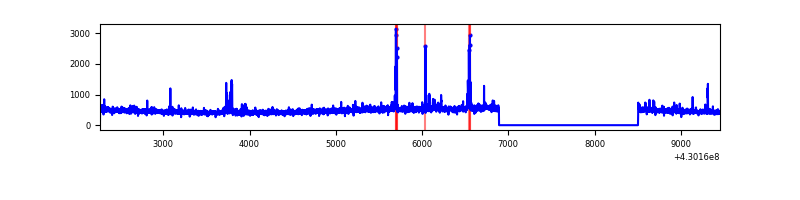 |
| D | 7190 | 5578 | 106 | 106 | 1.47% | 1.90% | 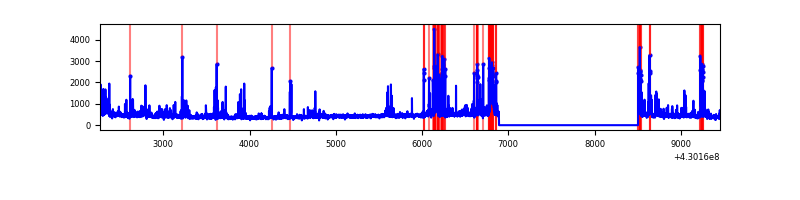 |
Top three noisy pixels from each quadrant. If the there are fewer than three noisy pixels in the level2.evt file, extra rows are filled as -1
| Pixel properties | Quadrant properties | ||||||
|---|---|---|---|---|---|---|---|
| Quadrant | DetID | PixID | Counts | Sigma | Mean | Median | Sigma |
| A | 10 | 83 | 599163 | 4828.21 | 606 | 593 | 124.0 |
| A | 13 | 6 | 9478 | 71.67 | 606 | 593 | 124.0 |
| A | 15 | 223 | 8870 | 66.76 | 606 | 593 | 124.0 |
| B | 0 | 245 | 129940 | 1092.06 | 601 | 584 | 118.5 |
| B | 0 | 229 | 110440 | 927.44 | 601 | 584 | 118.5 |
| B | 10 | 246 | 54462 | 454.86 | 601 | 584 | 118.5 |
| C | 15 | 214 | 232141 | 1685.55 | 585 | 589 | 137.4 |
| C | 14 | 254 | 85677 | 619.39 | 585 | 589 | 137.4 |
| C | 3 | 233 | 53765 | 387.09 | 585 | 589 | 137.4 |
| D | 2 | 249 | 299972 | 2097.87 | 582 | 564 | 142.7 |
| D | 12 | 233 | 269820 | 1886.6 | 582 | 564 | 142.7 |
| D | 1 | 47 | 46219 | 319.89 | 582 | 564 | 142.7 |
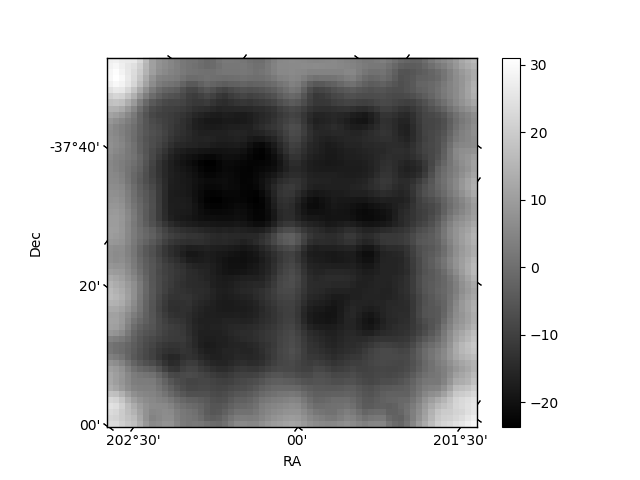
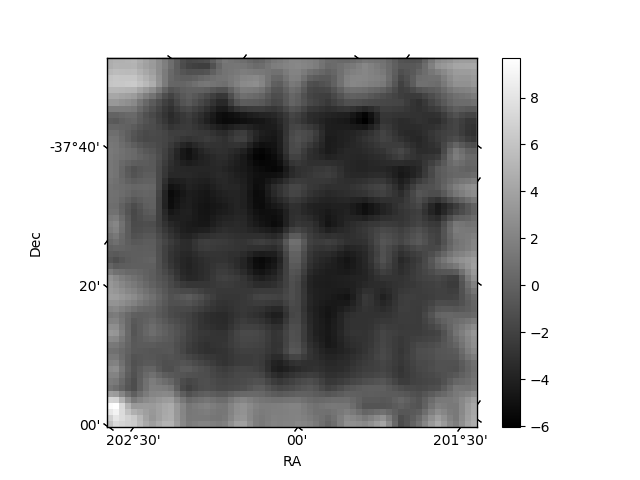
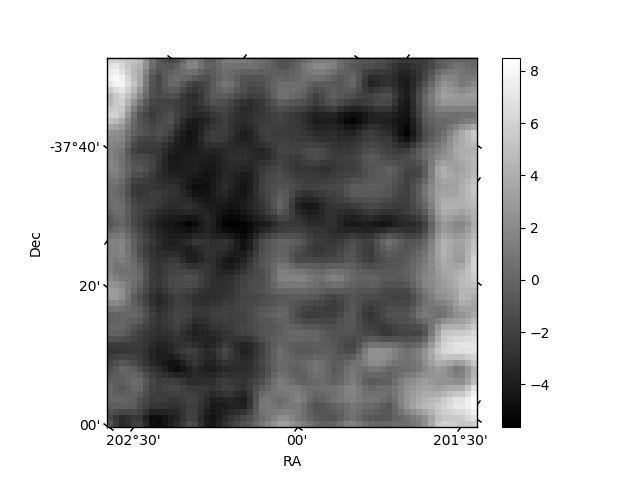
Histogram calculated using DETX and DETY for each event in the final _common_clean file
| Quadrant A | 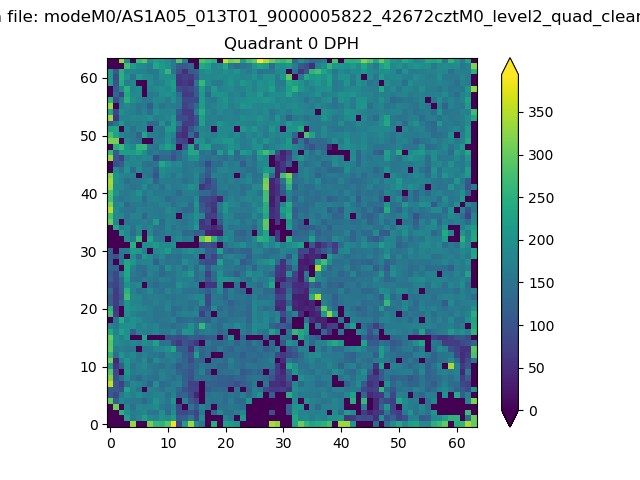 |
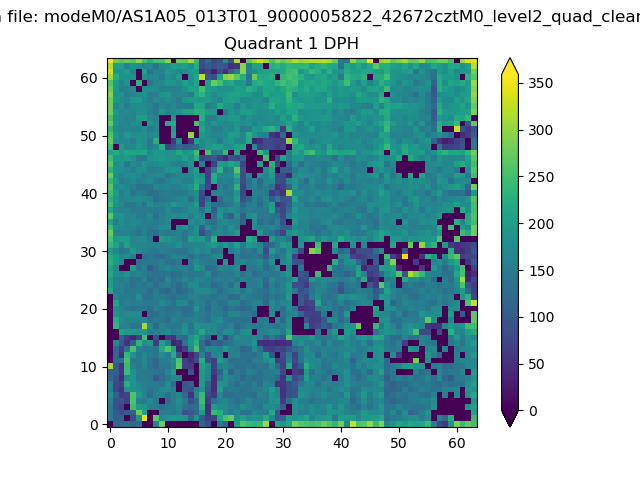 |
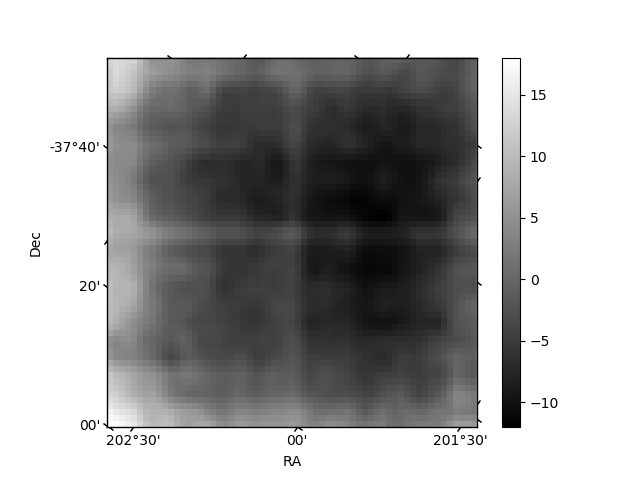
Quadrant B |
|---|---|---|---|
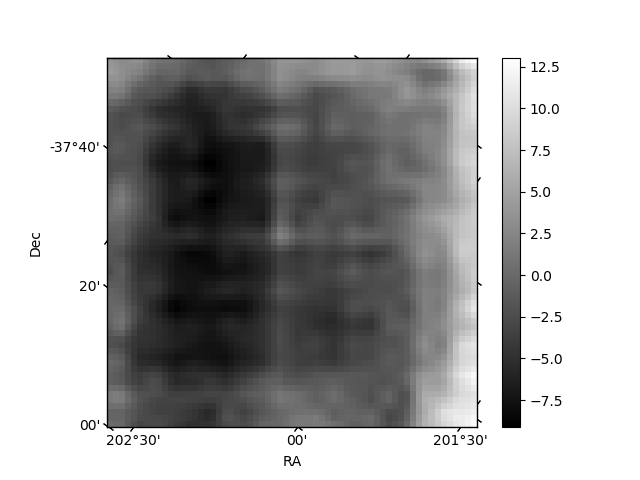
| Quadrant D | 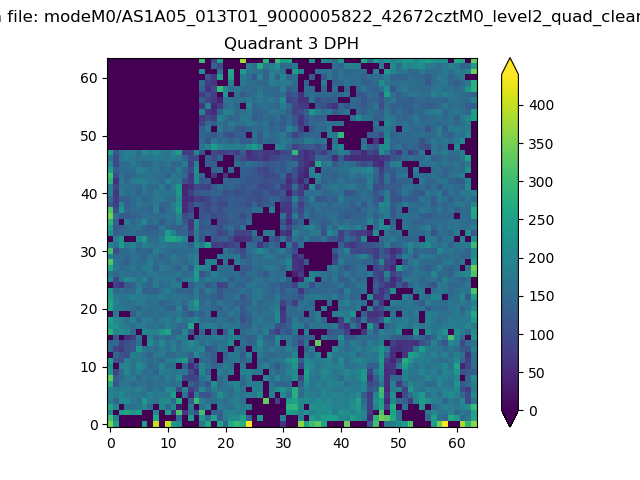 |
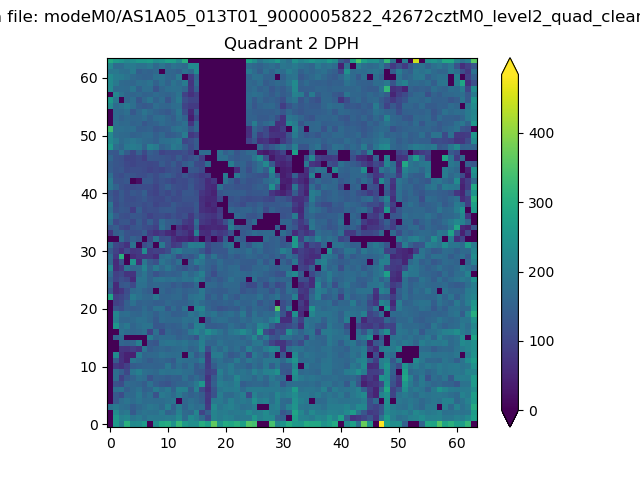 |
Quadrant C |
| Plot type | Count rate plots | Images |
|---|---|---|
| Comparison with Poisson distribution Blue bars denote a histogram of data divided into 1 sec bins. Red curve is a Poisson curve with rate = median count rate of data. |
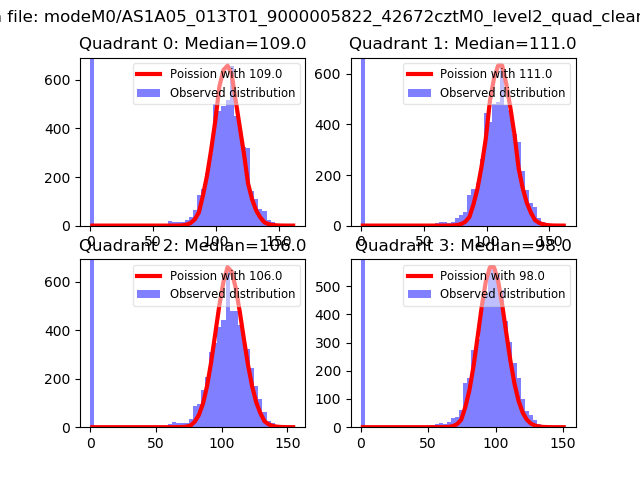 |
 |
| Quadrant-wise count rates Data is divided into 100 sec bins |
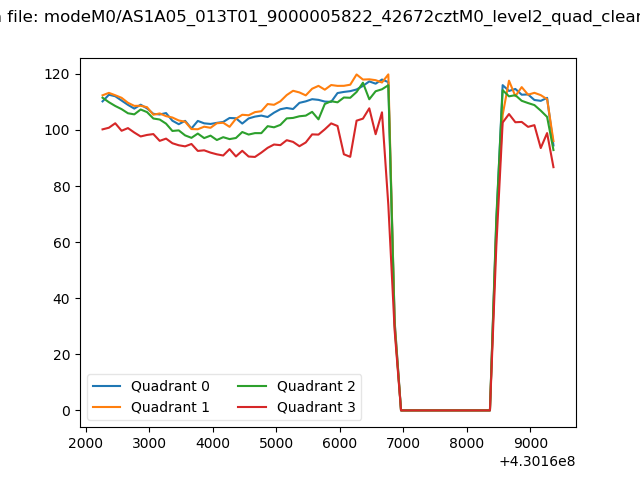 |
|
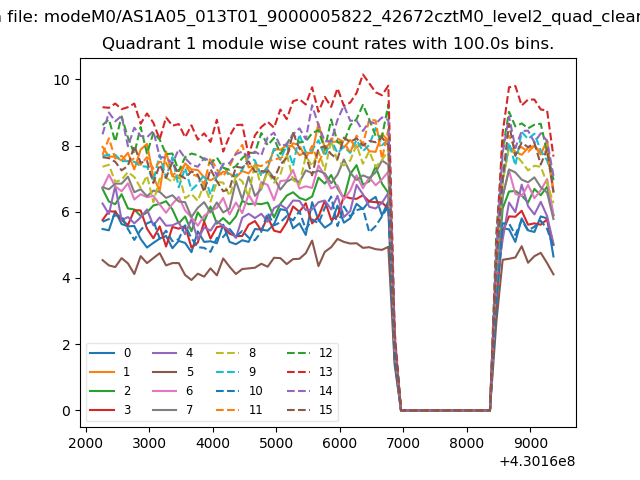
| Module-wise count rates for Quadrant A Data is divided into 100 sec bins |
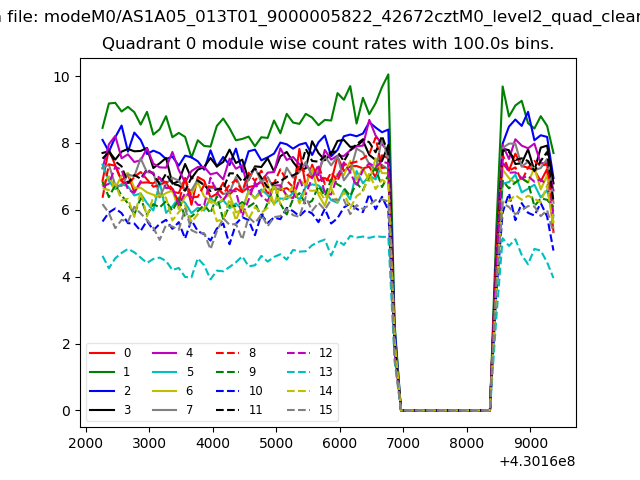 |
 |
| Module-wise count rates for Quadrant B Data is divided into 100 sec bins |
 |
 |
| Module-wise count rates for Quadrant C Data is divided into 100 sec bins |
 |
 |
| Module-wise count rates for Quadrant D Data is divided into 100 sec bins |
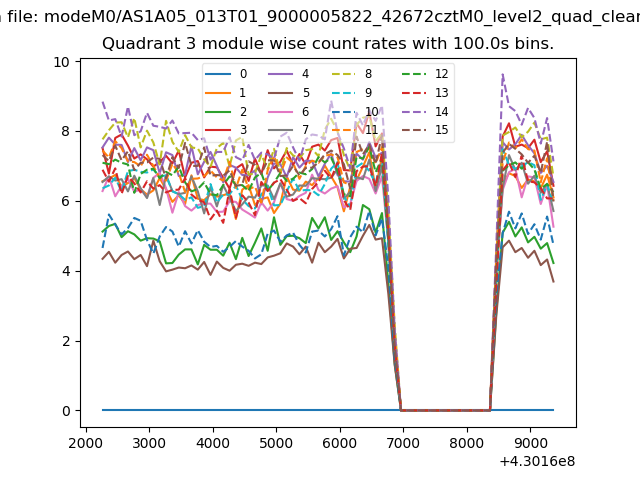 |
 |
| Parameter | Plot |
|---|---|
| CZT HV Monitor | 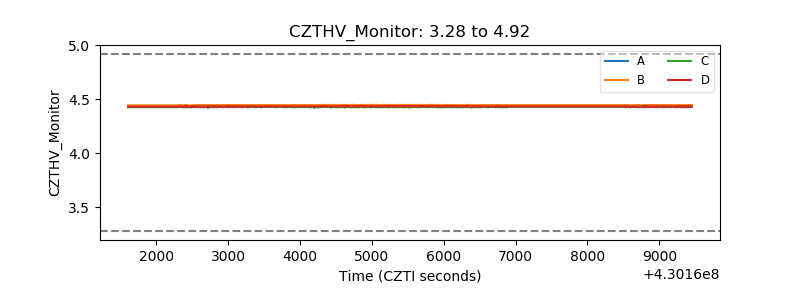 |
| D_VDD | 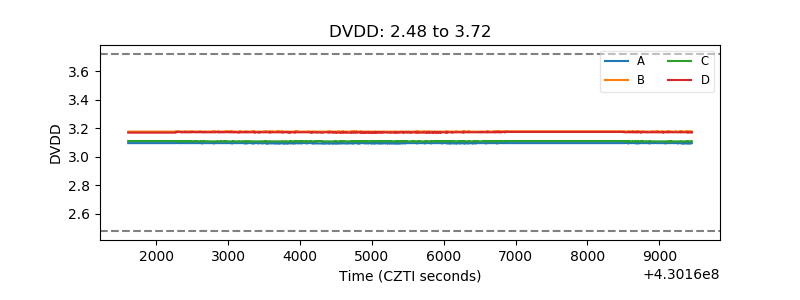 |
| Temperature 1 | 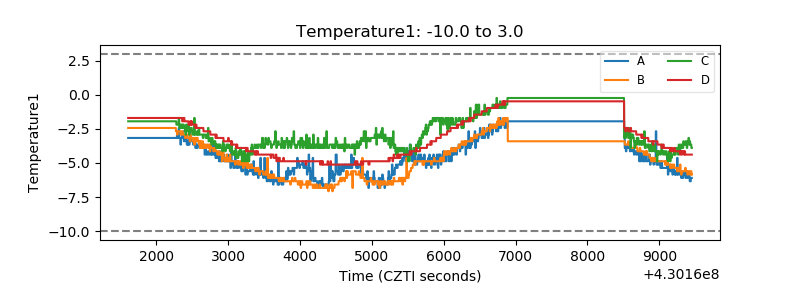 |
| Veto HV Monitor | 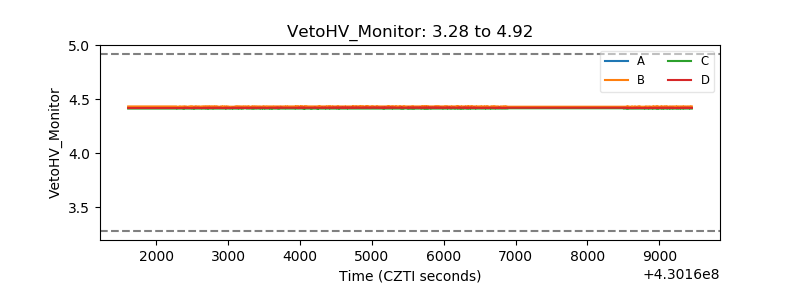 |
| Veto LLD | 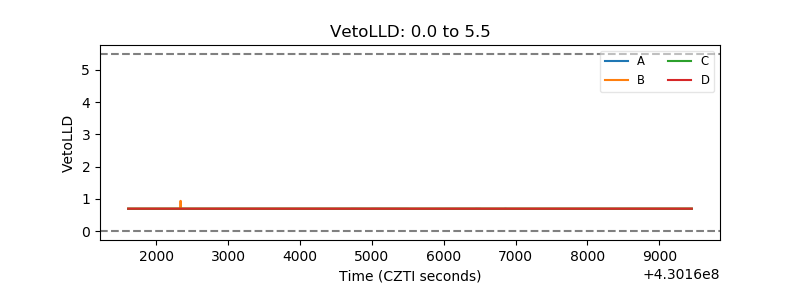 |
| Alpha Counter | 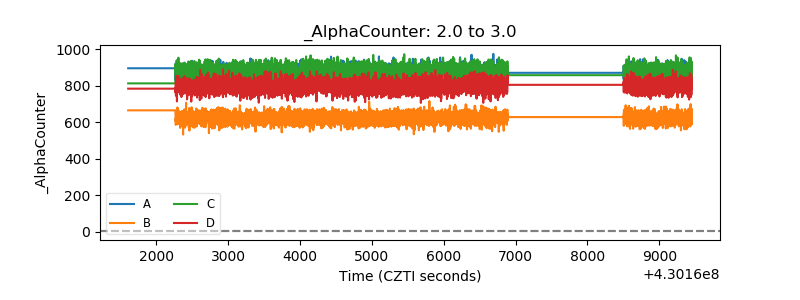 |
| _CPM_Rate | 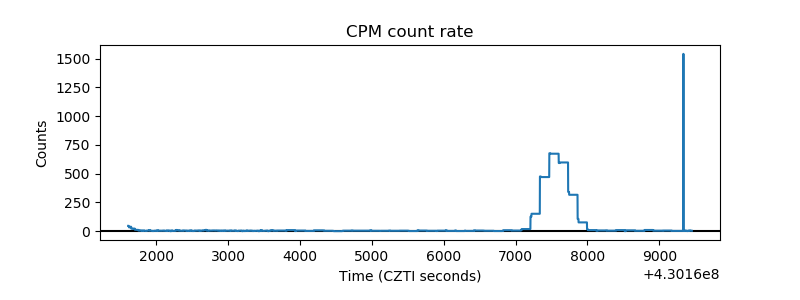 |
| CZT Counter | 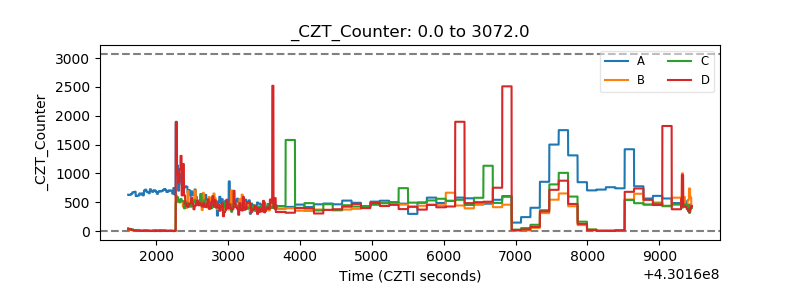 |
| +2.5 Volts monitor | 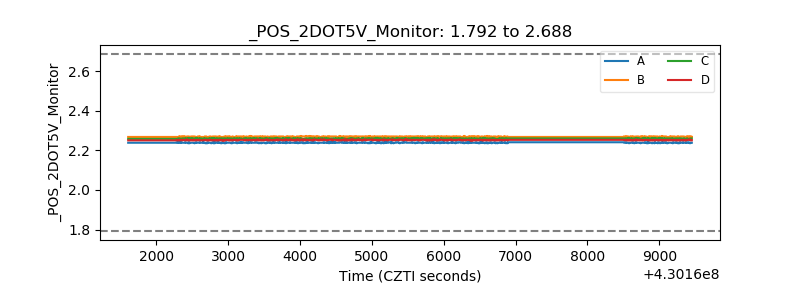 |
| +5 Volts monitor | 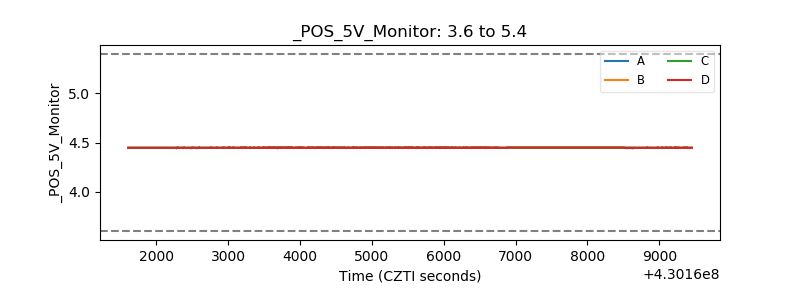 |
| _ROLL_ROT | 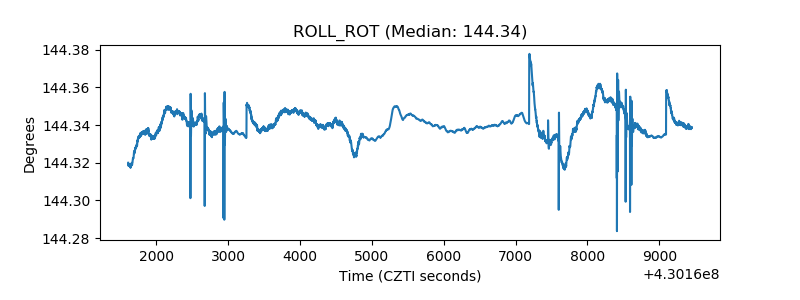 |
| _Roll_DEC | 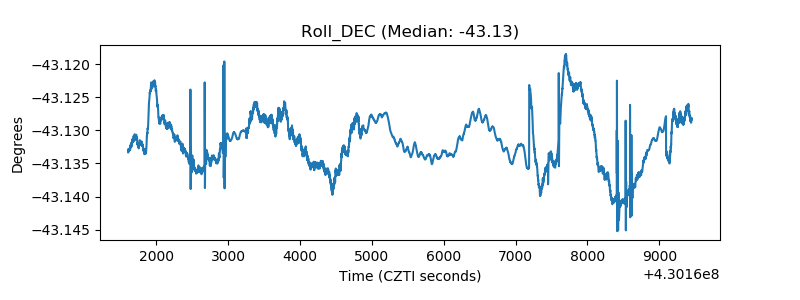 |
| _Roll_RA | 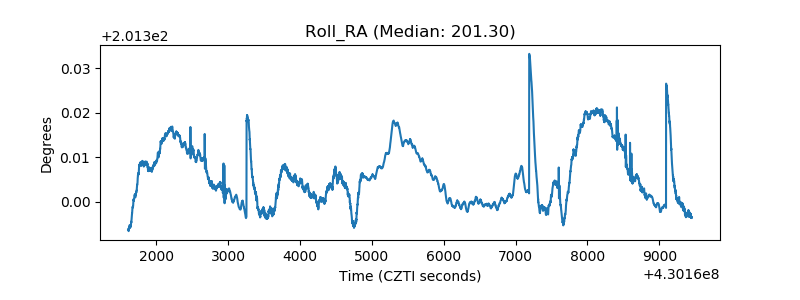 |
| Veto Counter | 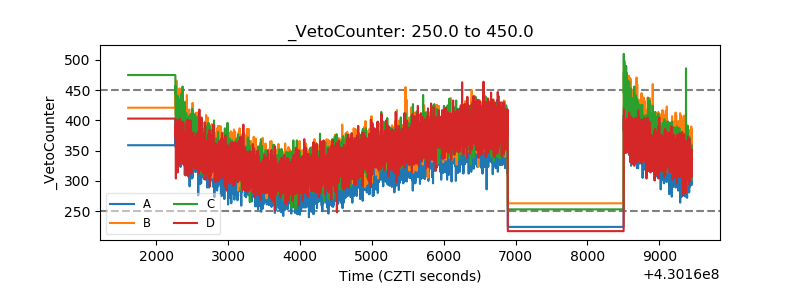 |