| Param | Original file | Final file |
|---|---|---|
| Filename | modeM0/AS1A05_013T01_9000005822_42674cztM0_level2.fits | modeM0/AS1A05_013T01_9000005822_42674cztM0_level2_quad_clean.evt |
| Size (bytes) | 360,889,920 | 87,701,760 |
| Size | 344.2 MB | 83.6 MB |
| Events in quadrant A | 2,912,618 | 605,890 |
| Events in quadrant B | 2,807,093 | 610,756 |
| Events in quadrant C | 2,812,124 | 576,415 |
| Events in quadrant D | 4,406,764 | 484,255 |
| Mode M0 | |||
|---|---|---|---|
| Quadrant | BADHDUFLAG | Total packets | Discarded packets |
| A | 0 | 11831 | 2 |
| B | 0 | 11872 | 2 |
| C | 0 | 11774 | 2 |
| D | 0 | 17051 | 2 |
| Mode M9 | |||
|---|---|---|---|
| Quadrant | BADHDUFLAG | Total packets | Discarded packets |
| A | 0 | 21 | 0 |
| B | 0 | 22 | 0 |
| C | 0 | 22 | 0 |
| D | 0 | 22 | 0 |
| Mode SS | |||
|---|---|---|---|
| Quadrant | BADHDUFLAG | Total packets | Discarded packets |
| A | 0 | 112 | 0 |
| B | 0 | 112 | 0 |
| C | 0 | 112 | 0 |
| D | 0 | 112 | 0 |
| Quadrant | Total seconds | Saturated seconds | Saturation percentage |
|---|---|---|---|
| A | 5396 | 17 | 0.315048% |
| B | 5396 | 68 | 1.260193% |
| C | 5396 | 83 | 1.538176% |
| D | 5396 | 676 | 12.527798% |
Noise dominated data is calculated using 1-second bins in cleaned event files. If a bin has >2000 counts, and if more than 50% of those come from <1% of pixels, then it is considered to be noise-dominated and hence unusable.
| Quadrant | # 1 sec bins | Bins with >0 counts | Bins with >2000 counts | High rate bins dominated by noise | Noise dominated (total time) | Noise dominated (detector-on time) | Marked lightcurve |
|---|---|---|---|---|---|---|---|
| A | 7159 | 5397 | 10 | 10 | 0.14% | 0.19% | 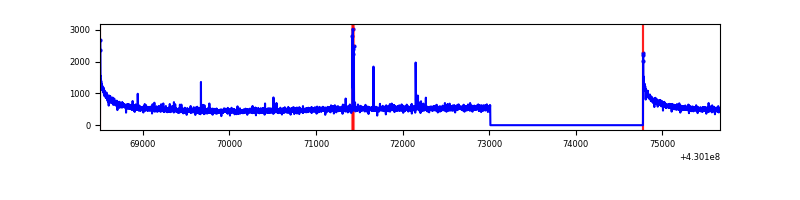 |
| B | 7159 | 5397 | 47 | 47 | 0.66% | 0.87% | 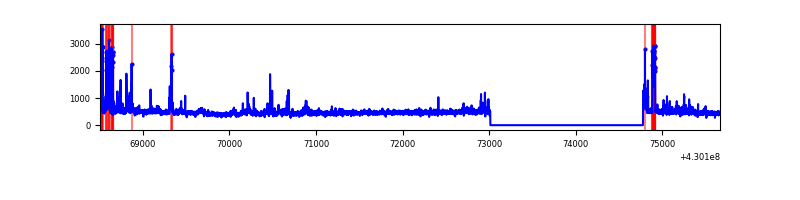 |
| C | 7159 | 5397 | 70 | 70 | 0.98% | 1.30% | 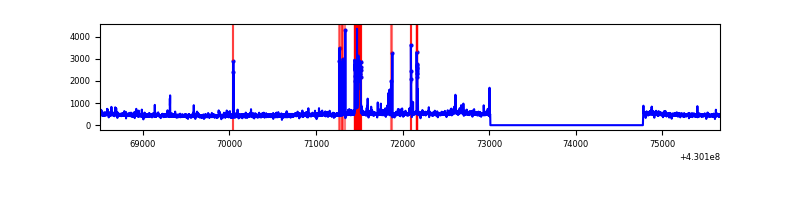 |
| D | 7159 | 5397 | 613 | 613 | 8.56% | 11.36% | 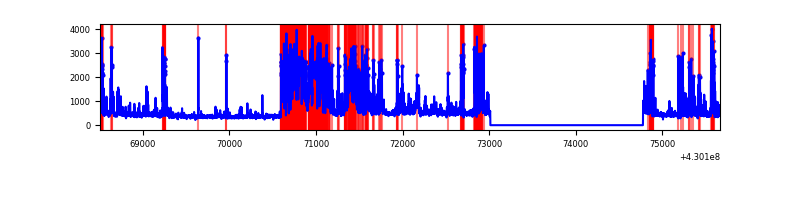 |
Top three noisy pixels from each quadrant. If the there are fewer than three noisy pixels in the level2.evt file, extra rows are filled as -1
| Pixel properties | Quadrant properties | ||||||
|---|---|---|---|---|---|---|---|
| Quadrant | DetID | PixID | Counts | Sigma | Mean | Median | Sigma |
| A | 10 | 83 | 566432 | 4632.62 | 592 | 582 | 122.1 |
| A | 15 | 237 | 41765 | 337.17 | 592 | 582 | 122.1 |
| A | 13 | 6 | 10389 | 80.29 | 592 | 582 | 122.1 |
| B | 10 | 246 | 211453 | 1854.63 | 587 | 572 | 113.7 |
| B | 0 | 245 | 120642 | 1055.98 | 587 | 572 | 113.7 |
| B | 0 | 229 | 102716 | 898.32 | 587 | 572 | 113.7 |
| C | 14 | 254 | 277867 | 2085.03 | 570 | 572 | 133.0 |
| C | 15 | 214 | 223699 | 1677.73 | 570 | 572 | 133.0 |
| C | 3 | 233 | 56291 | 418.96 | 570 | 572 | 133.0 |
| D | 2 | 249 | 1795585 | 13503.95 | 541 | 525 | 132.9 |
| D | 12 | 233 | 388903 | 2921.71 | 541 | 525 | 132.9 |
| D | 1 | 47 | 43534 | 323.55 | 541 | 525 | 132.9 |
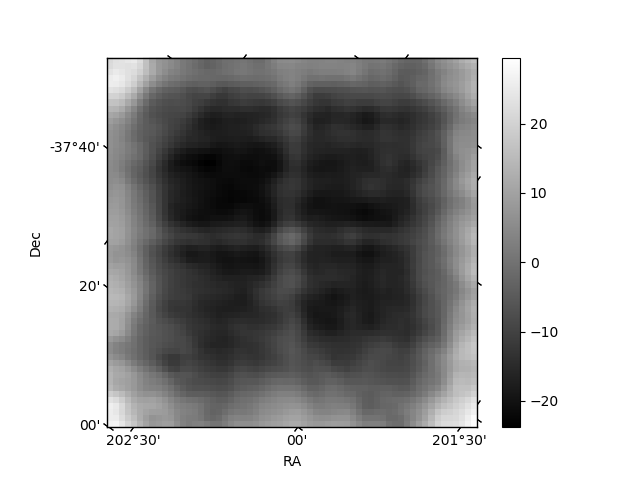
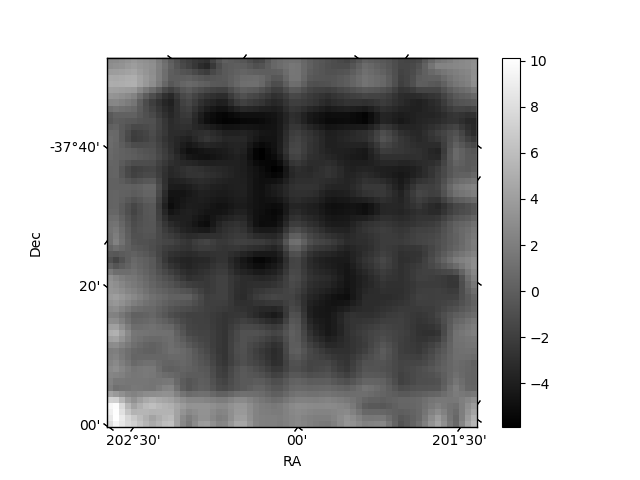
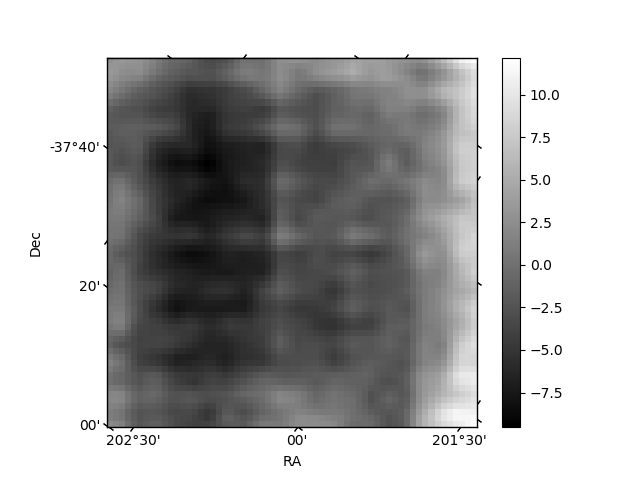
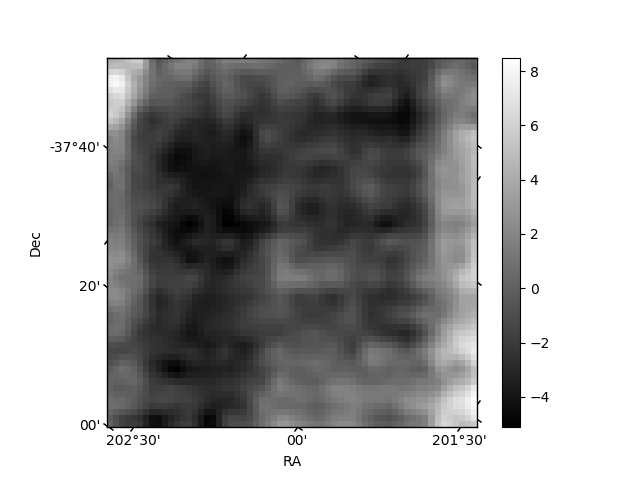
Histogram calculated using DETX and DETY for each event in the final _common_clean file
| Quadrant A | 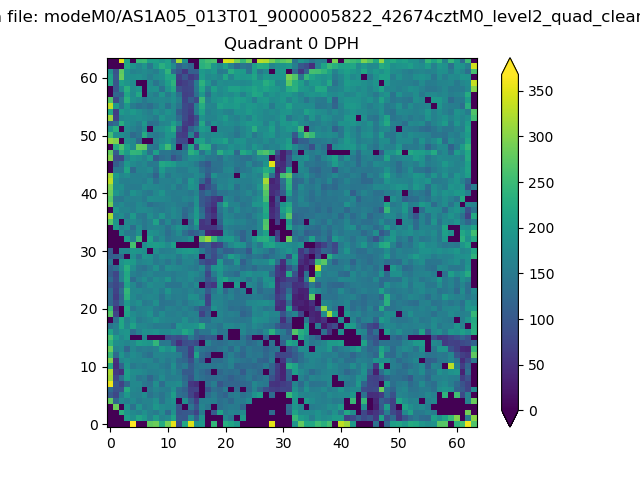 |
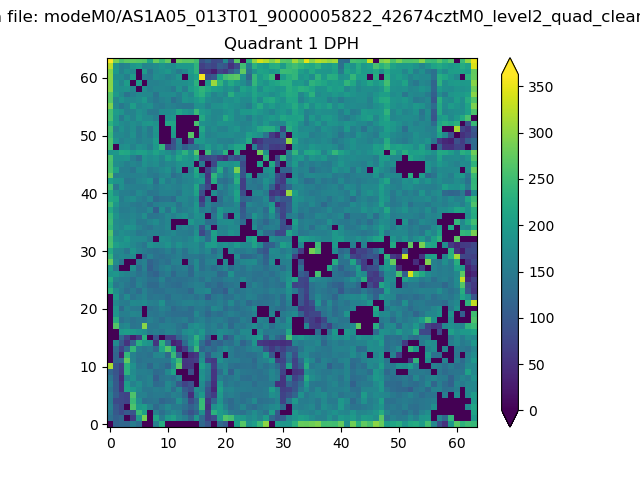 |
Quadrant B |
|---|---|---|---|
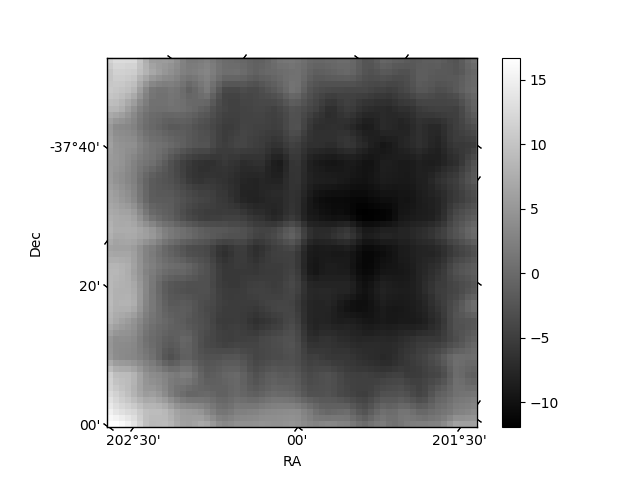
| Quadrant D | 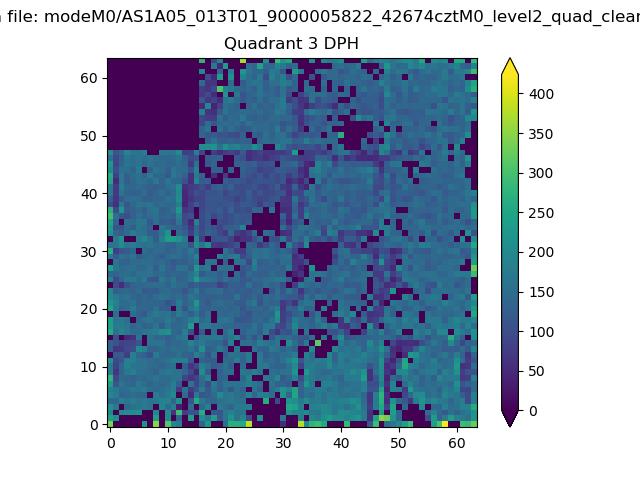 |
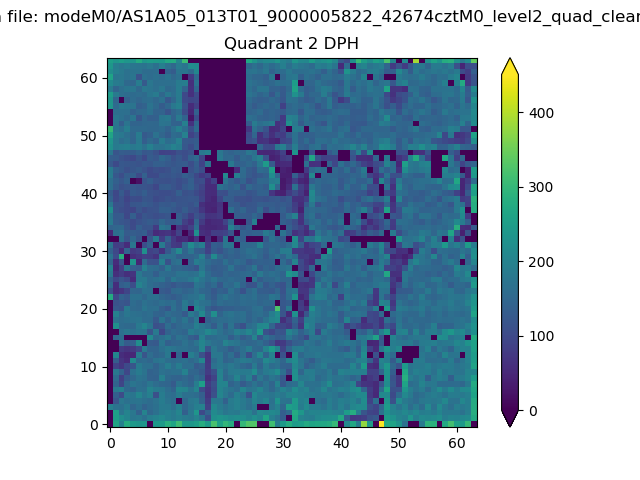 |
Quadrant C |
| Plot type | Count rate plots | Images |
|---|---|---|
| Comparison with Poisson distribution Blue bars denote a histogram of data divided into 1 sec bins. Red curve is a Poisson curve with rate = median count rate of data. |
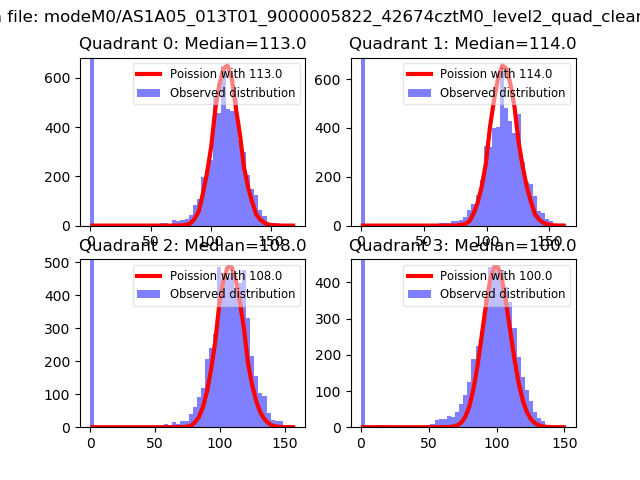 |
 |
| Quadrant-wise count rates Data is divided into 100 sec bins |
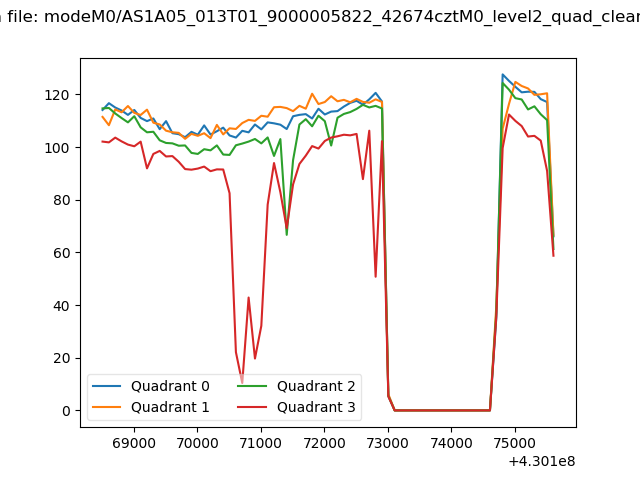 |
|
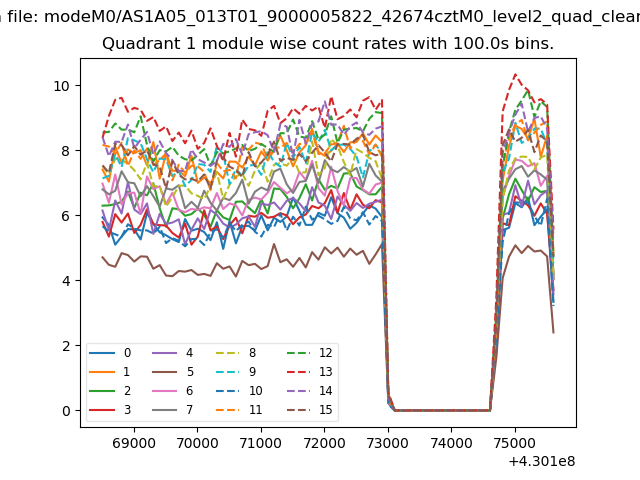
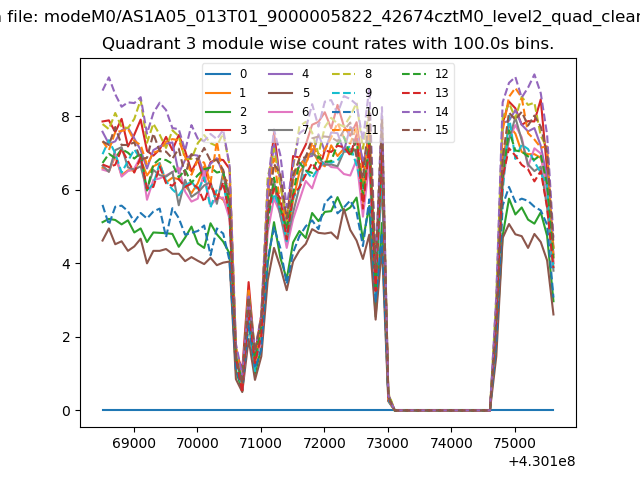
| Module-wise count rates for Quadrant A Data is divided into 100 sec bins |
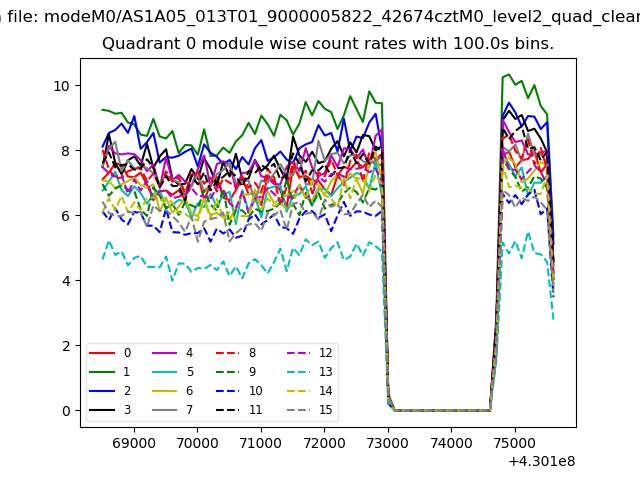 |
 |
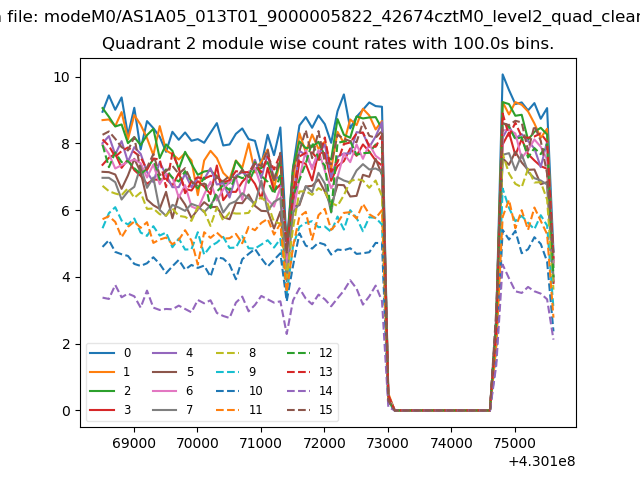
| Module-wise count rates for Quadrant B Data is divided into 100 sec bins |
 |
 |
| Module-wise count rates for Quadrant C Data is divided into 100 sec bins |
 |
 |
| Module-wise count rates for Quadrant D Data is divided into 100 sec bins |
 |
 |
| Parameter | Plot |
|---|---|
| CZT HV Monitor | 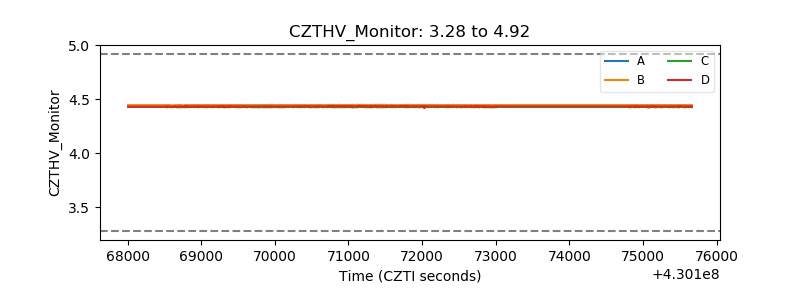 |
| D_VDD | 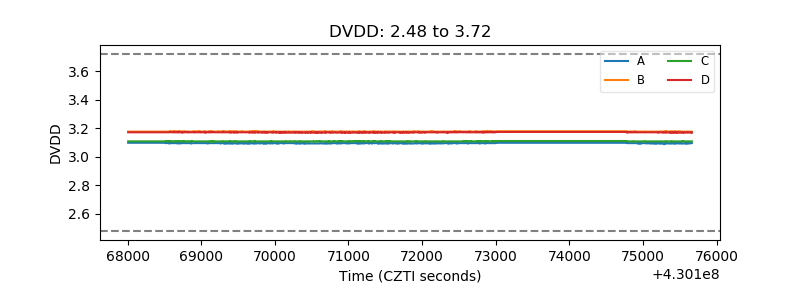 |
| Temperature 1 | 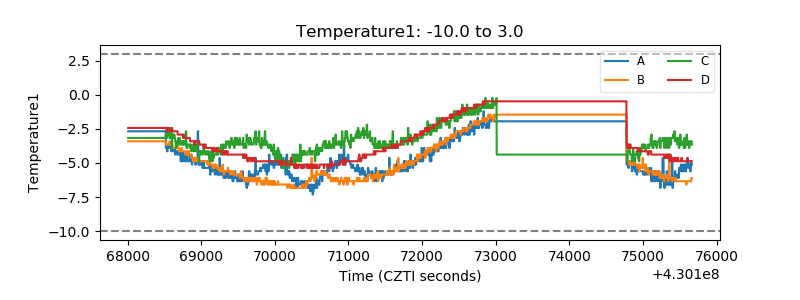 |
| Veto HV Monitor | 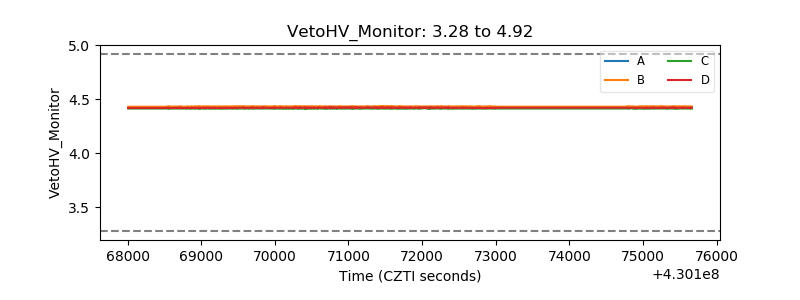 |
| Veto LLD | 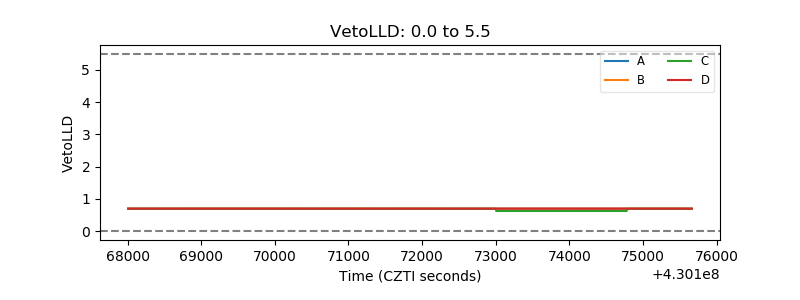 |
| Alpha Counter | 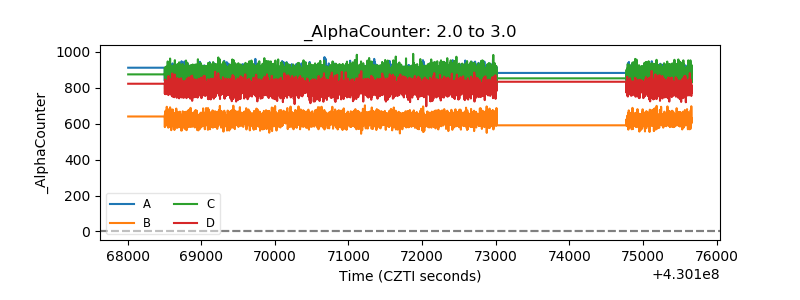 |
| _CPM_Rate | 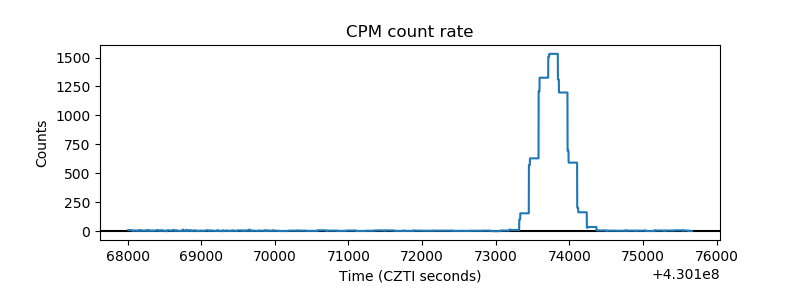 |
| CZT Counter | 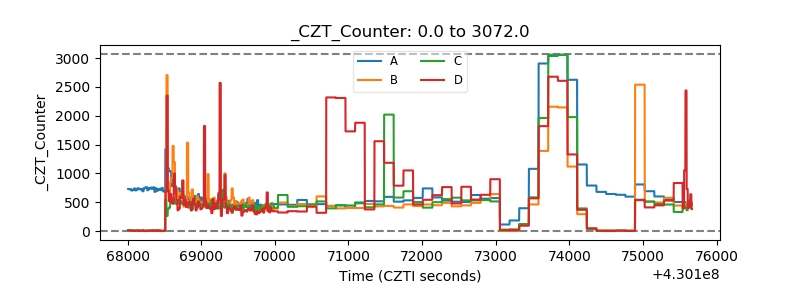 |
| +2.5 Volts monitor | 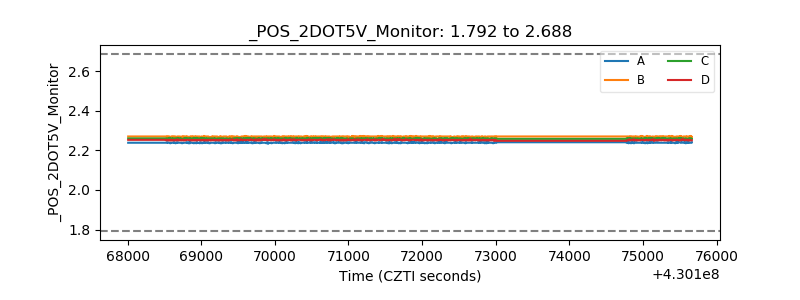 |
| +5 Volts monitor | 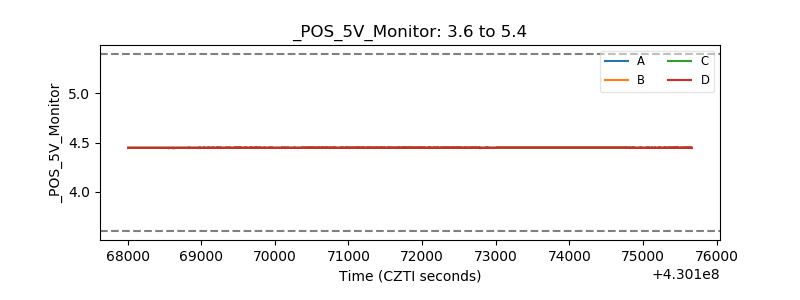 |
| _ROLL_ROT | 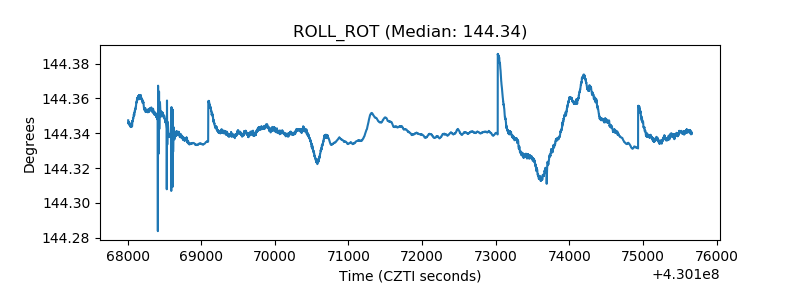 |
| _Roll_DEC | 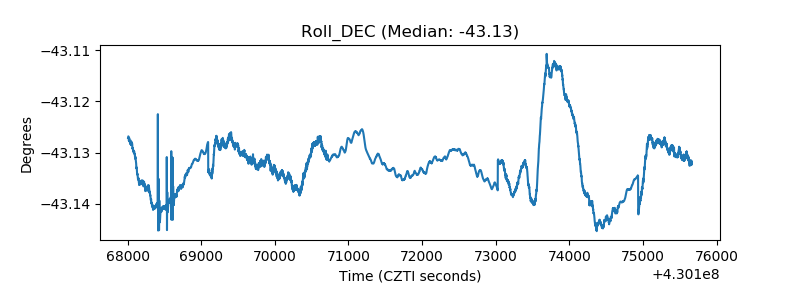 |
| _Roll_RA | 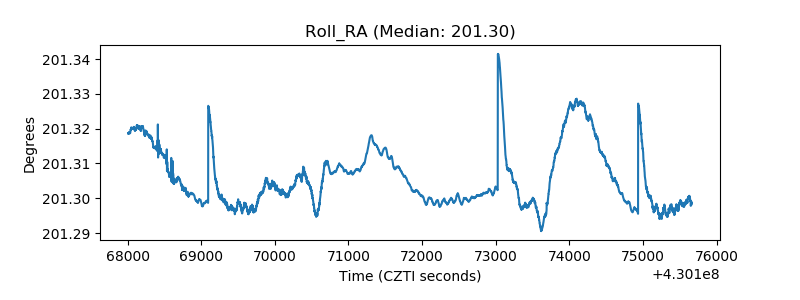 |
| Veto Counter | 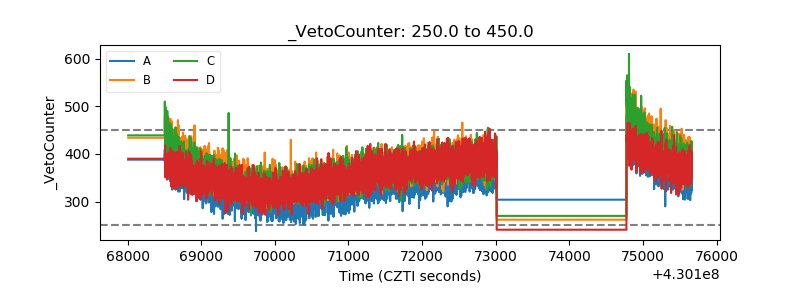 |