| Param | Original file | Final file |
|---|---|---|
| Filename | modeM0/AS1A05_013T01_9000005822_42675cztM0_level2.fits | modeM0/AS1A05_013T01_9000005822_42675cztM0_level2_quad_clean.evt |
| Size (bytes) | 313,200,000 | 88,505,280 |
| Size | 298.7 MB | 84.4 MB |
| Events in quadrant A | 2,842,211 | 603,706 |
| Events in quadrant B | 3,086,530 | 609,886 |
| Events in quadrant C | 2,510,880 | 578,681 |
| Events in quadrant D | 2,755,086 | 529,198 |
| Mode M0 | |||
|---|---|---|---|
| Quadrant | BADHDUFLAG | Total packets | Discarded packets |
| A | 0 | 11419 | 2 |
| B | 0 | 12457 | 2 |
| C | 0 | 10426 | 2 |
| D | 0 | 11903 | 2 |
| Mode M9 | |||
|---|---|---|---|
| Quadrant | BADHDUFLAG | Total packets | Discarded packets |
| A | 0 | 34 | 0 |
| B | 0 | 35 | 0 |
| C | 0 | 35 | 0 |
| D | 0 | 35 | 0 |
| Mode SS | |||
|---|---|---|---|
| Quadrant | BADHDUFLAG | Total packets | Discarded packets |
| A | 0 | 104 | 0 |
| B | 0 | 104 | 0 |
| C | 0 | 104 | 0 |
| D | 0 | 104 | 0 |
| Quadrant | Total seconds | Saturated seconds | Saturation percentage |
|---|---|---|---|
| A | 5120 | 18 | 0.351562% |
| B | 5120 | 90 | 1.757812% |
| C | 5120 | 4 | 0.078125% |
| D | 5120 | 90 | 1.757812% |
Noise dominated data is calculated using 1-second bins in cleaned event files. If a bin has >2000 counts, and if more than 50% of those come from <1% of pixels, then it is considered to be noise-dominated and hence unusable.
| Quadrant | # 1 sec bins | Bins with >0 counts | Bins with >2000 counts | High rate bins dominated by noise | Noise dominated (total time) | Noise dominated (detector-on time) | Marked lightcurve |
|---|---|---|---|---|---|---|---|
| A | 7003 | 5121 | 11 | 11 | 0.16% | 0.21% | 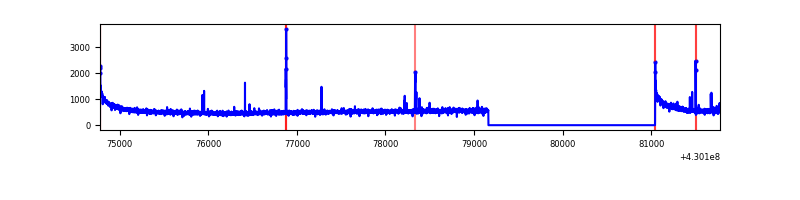 |
| B | 7003 | 5121 | 56 | 56 | 0.80% | 1.09% | 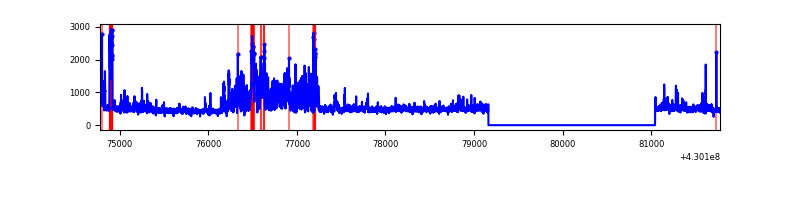 |
| C | 7003 | 5121 | 0 | 0 | 0.00% | 0.00% | 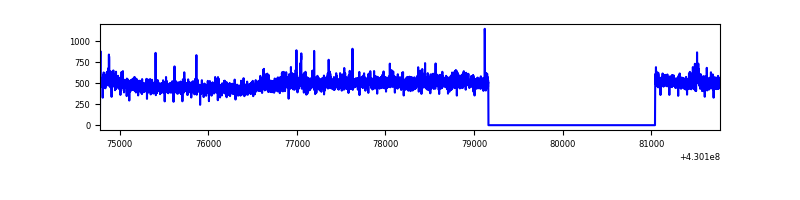 |
| D | 7003 | 5121 | 89 | 89 | 1.27% | 1.74% | 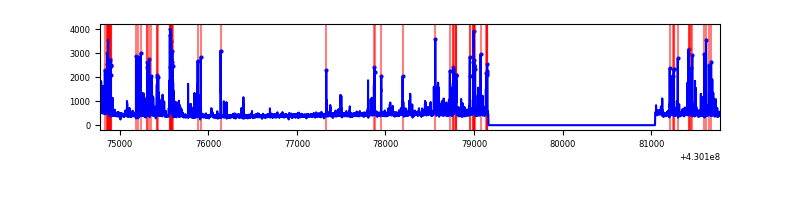 |
Top three noisy pixels from each quadrant. If the there are fewer than three noisy pixels in the level2.evt file, extra rows are filled as -1
| Pixel properties | Quadrant properties | ||||||
|---|---|---|---|---|---|---|---|
| Quadrant | DetID | PixID | Counts | Sigma | Mean | Median | Sigma |
| A | 10 | 83 | 537020 | 4510.95 | 579 | 567 | 118.9 |
| A | 15 | 237 | 34357 | 284.13 | 579 | 567 | 118.9 |
| A | 15 | 223 | 21359 | 174.84 | 579 | 567 | 118.9 |
| B | 0 | 245 | 664392 | 6006.6 | 575 | 560 | 110.5 |
| B | 10 | 246 | 96293 | 866.23 | 575 | 560 | 110.5 |
| B | 5 | 255 | 18057 | 158.32 | 575 | 560 | 110.5 |
| C | 15 | 214 | 220471 | 1684.19 | 562 | 567 | 130.6 |
| C | 3 | 233 | 35230 | 265.48 | 562 | 567 | 130.6 |
| C | 8 | 79 | 34478 | 259.72 | 562 | 567 | 130.6 |
| D | 2 | 249 | 411557 | 3053.28 | 555 | 540 | 134.6 |
| D | 1 | 52 | 70502 | 519.72 | 555 | 540 | 134.6 |
| D | 1 | 47 | 65275 | 480.89 | 555 | 540 | 134.6 |
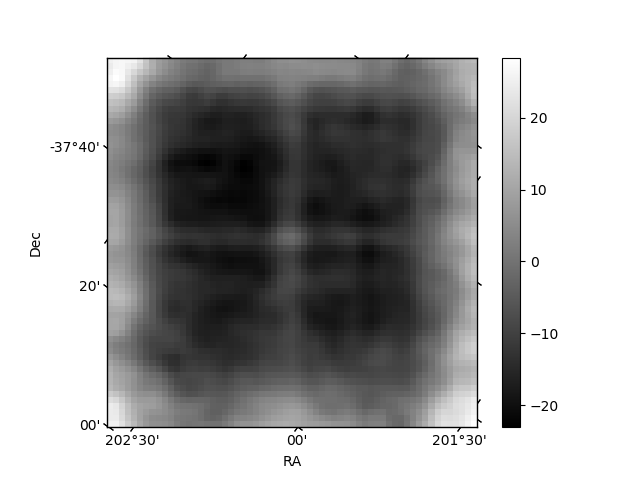
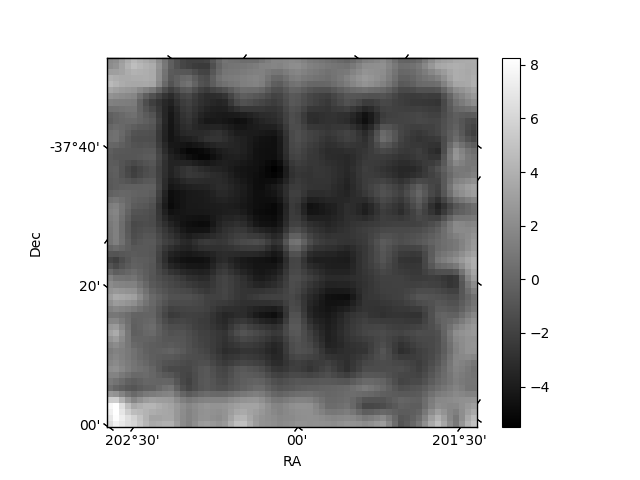
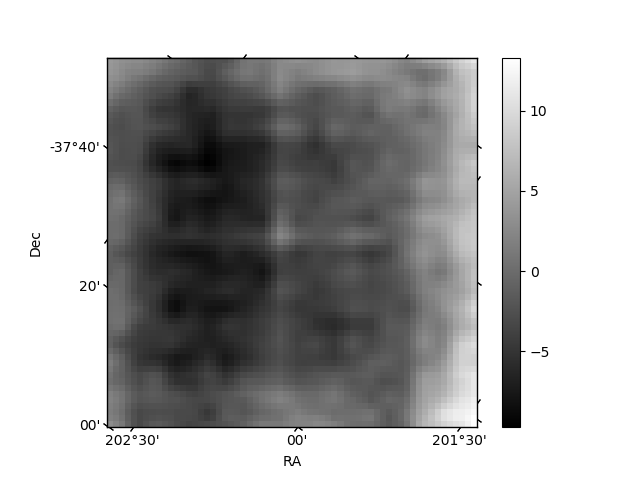
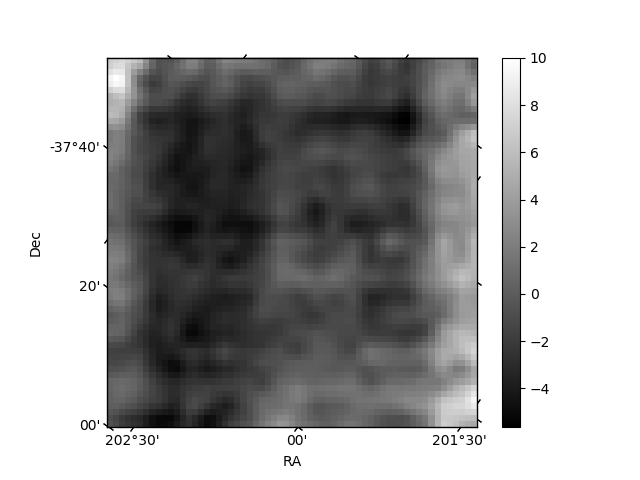
Histogram calculated using DETX and DETY for each event in the final _common_clean file
| Quadrant A | 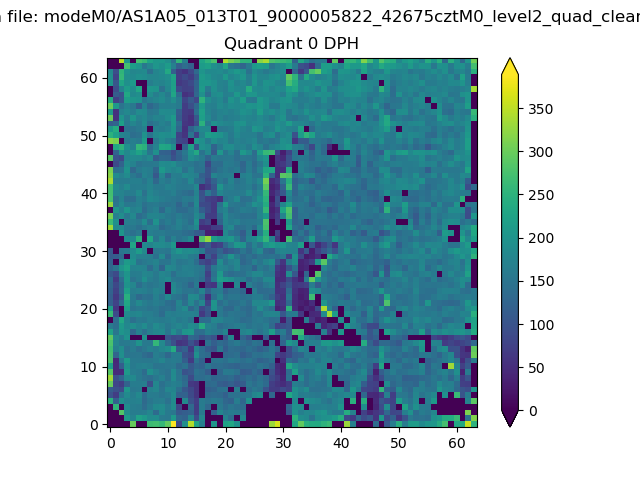 |
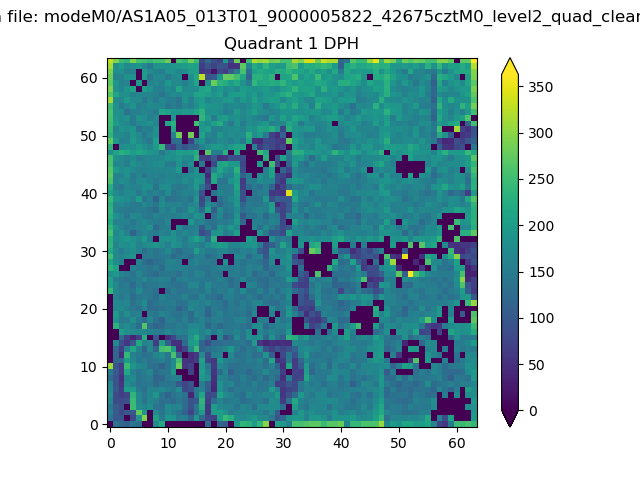 |
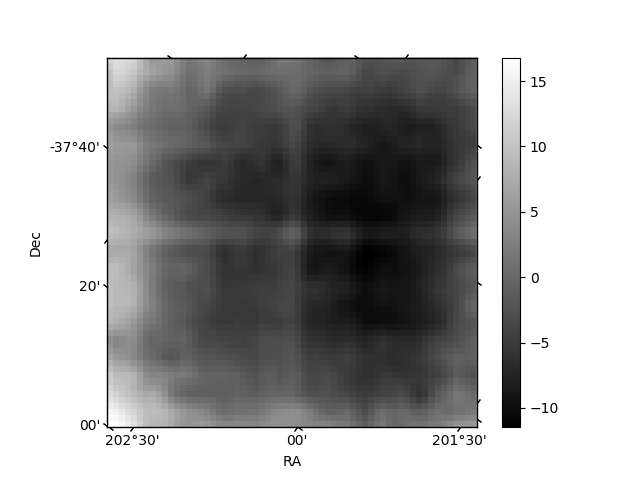
Quadrant B |
|---|---|---|---|
| Quadrant D | 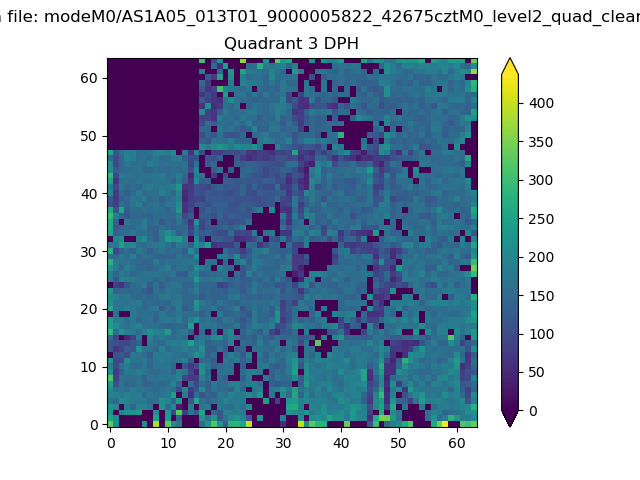 |
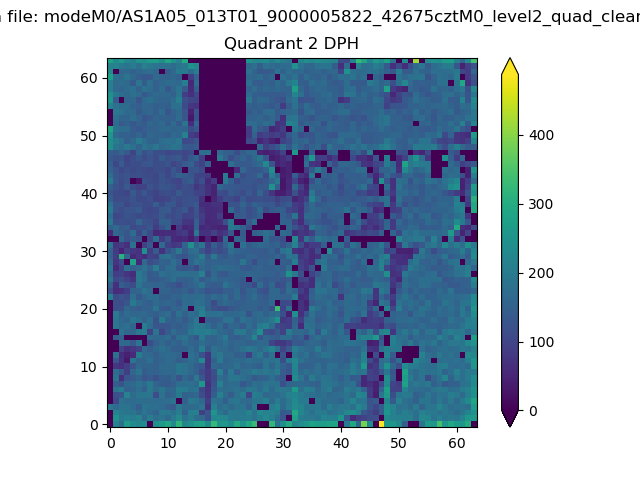 |
Quadrant C |
| Plot type | Count rate plots | Images |
|---|---|---|
| Comparison with Poisson distribution Blue bars denote a histogram of data divided into 1 sec bins. Red curve is a Poisson curve with rate = median count rate of data. |
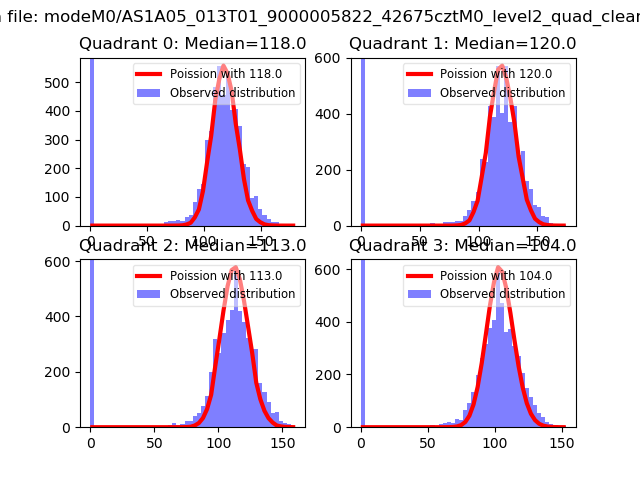 |
 |
| Quadrant-wise count rates Data is divided into 100 sec bins |
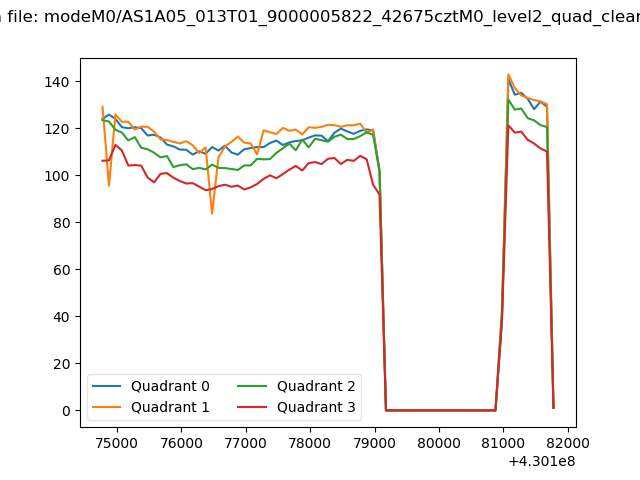 |
|
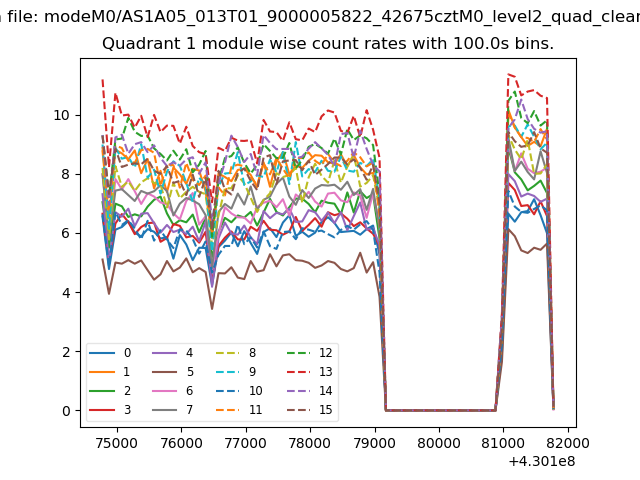
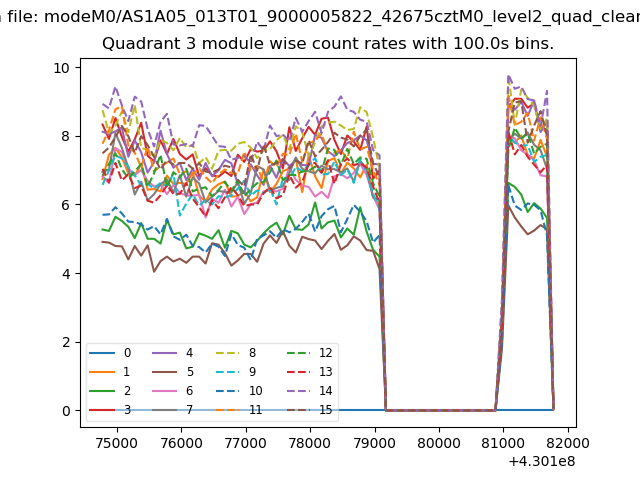
| Module-wise count rates for Quadrant A Data is divided into 100 sec bins |
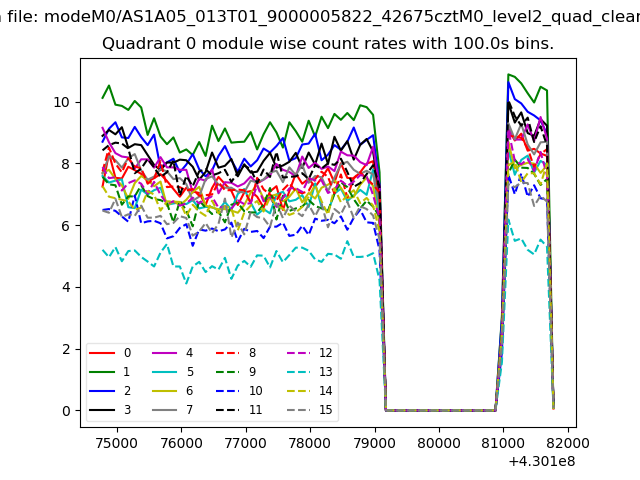 |
 |
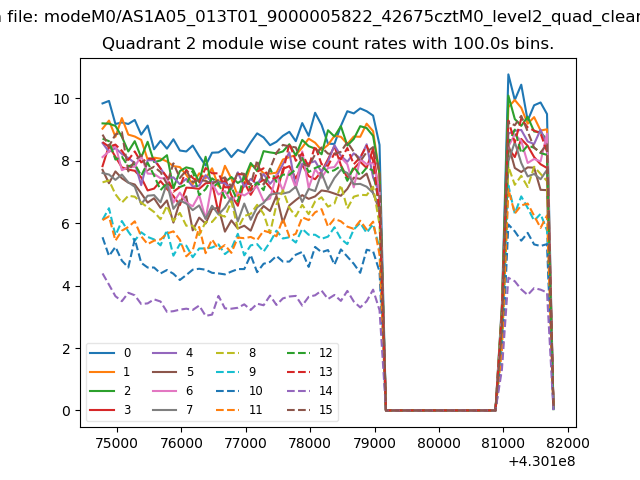
| Module-wise count rates for Quadrant B Data is divided into 100 sec bins |
 |
 |
| Module-wise count rates for Quadrant C Data is divided into 100 sec bins |
 |
 |
| Module-wise count rates for Quadrant D Data is divided into 100 sec bins |
 |
 |
| Parameter | Plot |
|---|---|
| CZT HV Monitor | 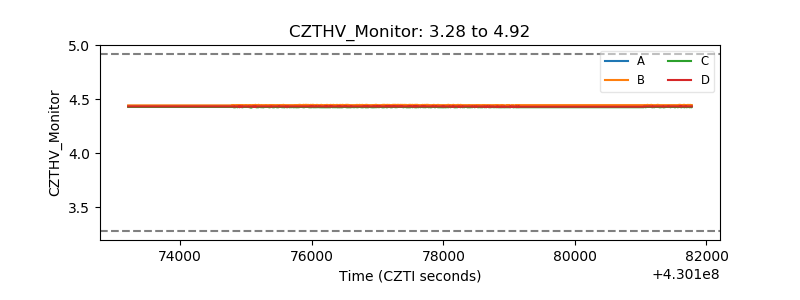 |
| D_VDD | 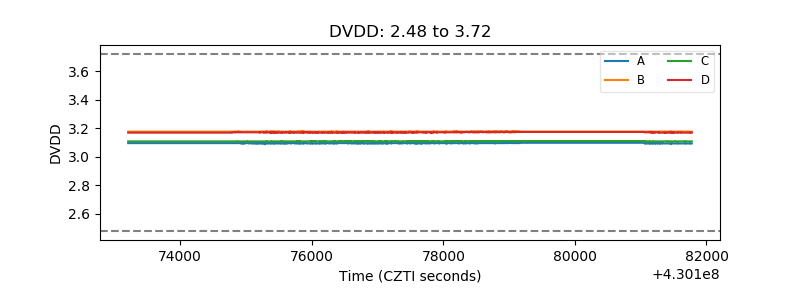 |
| Temperature 1 | 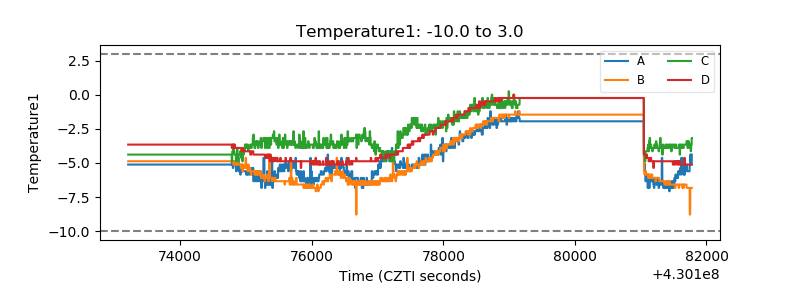 |
| Veto HV Monitor | 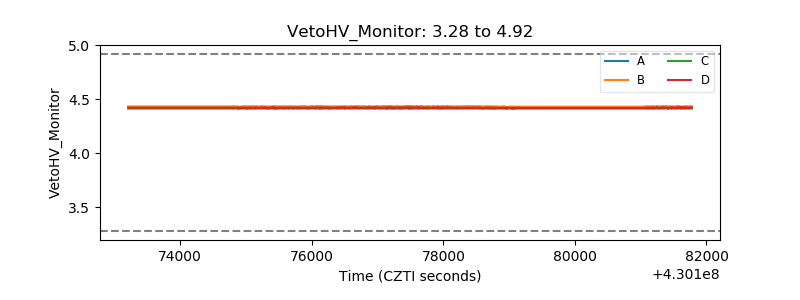 |
| Veto LLD | 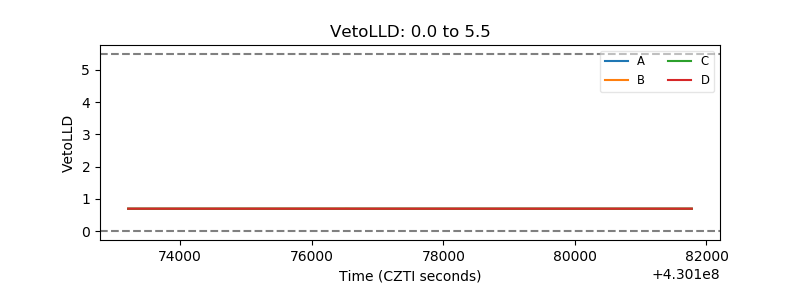 |
| Alpha Counter | 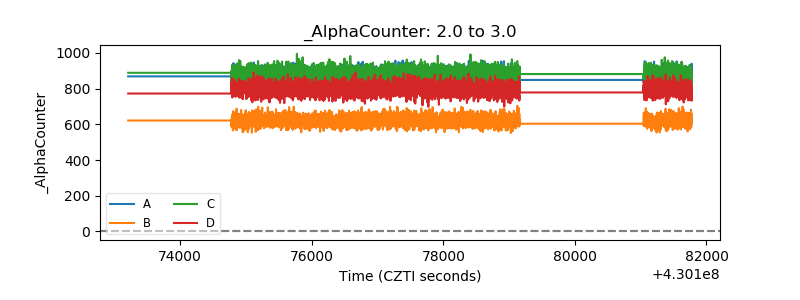 |
| _CPM_Rate | 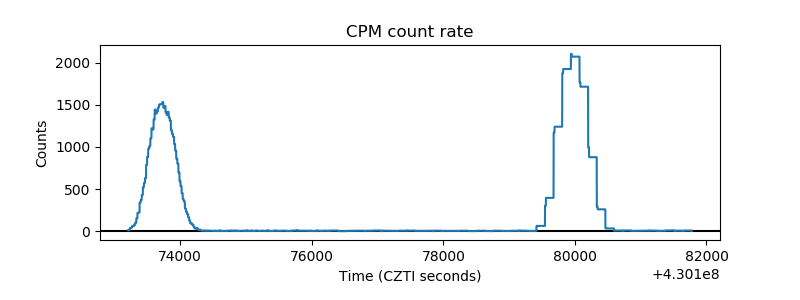 |
| CZT Counter | 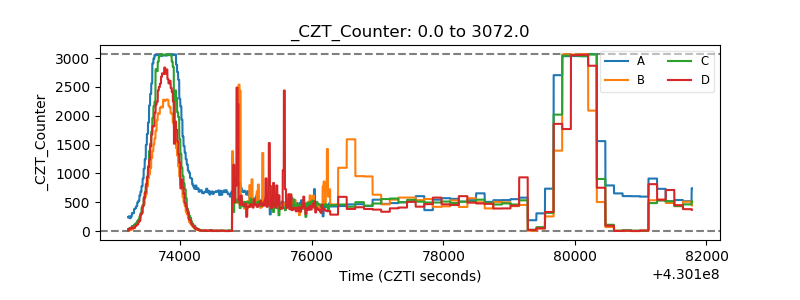 |
| +2.5 Volts monitor | 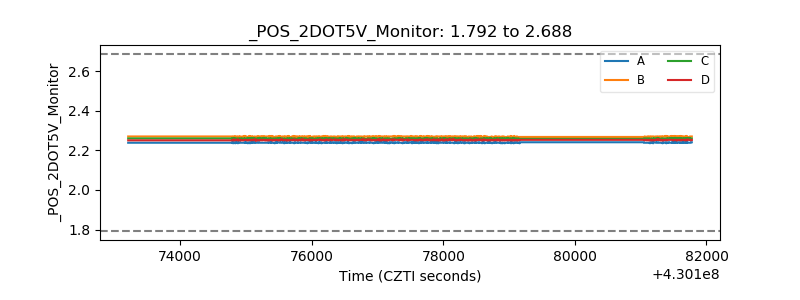 |
| +5 Volts monitor | 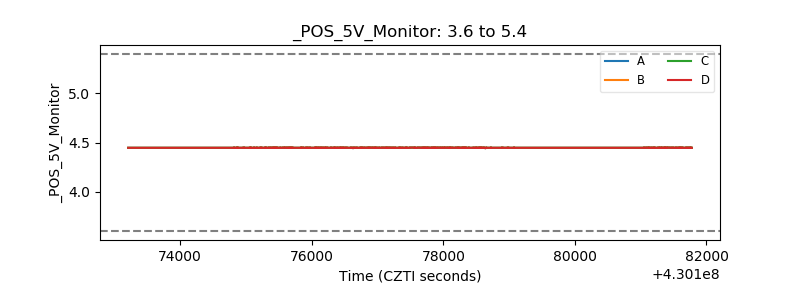 |
| _ROLL_ROT | 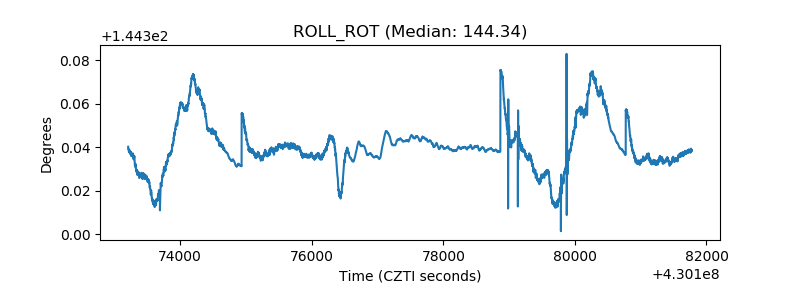 |
| _Roll_DEC | 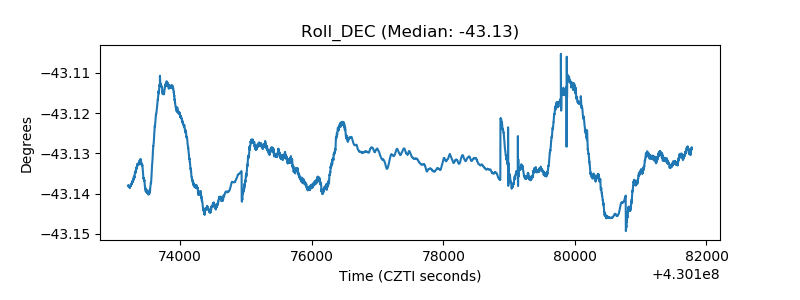 |
| _Roll_RA | 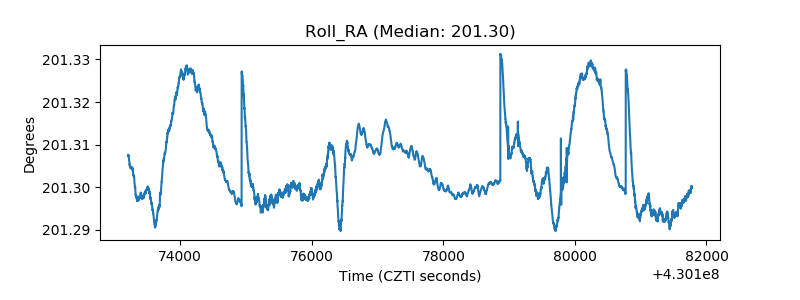 |
| Veto Counter | 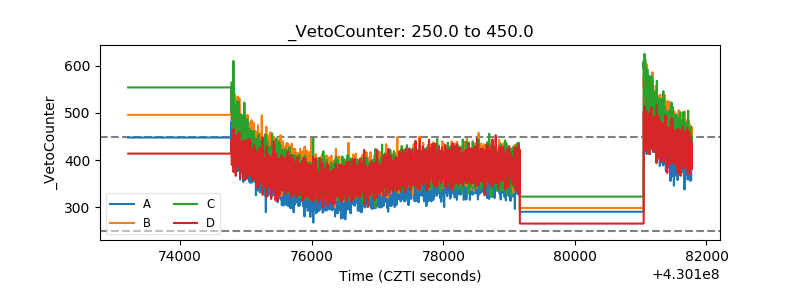 |