| Param | Original file | Final file |
|---|---|---|
| Filename | modeM0/AS1A05_013T01_9000005822_42676cztM0_level2.fits | modeM0/AS1A05_013T01_9000005822_42676cztM0_level2_quad_clean.evt |
| Size (bytes) | 331,873,920 | 91,209,600 |
| Size | 316.5 MB | 87.0 MB |
| Events in quadrant A | 3,155,195 | 626,790 |
| Events in quadrant B | 2,972,762 | 637,660 |
| Events in quadrant C | 2,656,322 | 602,728 |
| Events in quadrant D | 3,105,090 | 538,926 |
| Mode M0 | |||
|---|---|---|---|
| Quadrant | BADHDUFLAG | Total packets | Discarded packets |
| A | 0 | 12275 | 2 |
| B | 0 | 12081 | 2 |
| C | 0 | 10694 | 2 |
| D | 0 | 12689 | 2 |
| Mode M9 | |||
|---|---|---|---|
| Quadrant | BADHDUFLAG | Total packets | Discarded packets |
| A | 0 | 34 | 0 |
| B | 0 | 35 | 0 |
| C | 0 | 35 | 0 |
| D | 0 | 35 | 0 |
| Mode SS | |||
|---|---|---|---|
| Quadrant | BADHDUFLAG | Total packets | Discarded packets |
| A | 0 | 104 | 0 |
| B | 0 | 104 | 0 |
| C | 0 | 104 | 0 |
| D | 0 | 104 | 0 |
| Quadrant | Total seconds | Saturated seconds | Saturation percentage |
|---|---|---|---|
| A | 5076 | 59 | 1.162333% |
| B | 5076 | 133 | 2.620173% |
| C | 5076 | 13 | 0.256107% |
| D | 5076 | 192 | 3.782506% |
Noise dominated data is calculated using 1-second bins in cleaned event files. If a bin has >2000 counts, and if more than 50% of those come from <1% of pixels, then it is considered to be noise-dominated and hence unusable.
| Quadrant | # 1 sec bins | Bins with >0 counts | Bins with >2000 counts | High rate bins dominated by noise | Noise dominated (total time) | Noise dominated (detector-on time) | Marked lightcurve |
|---|---|---|---|---|---|---|---|
| A | 7079 | 5077 | 53 | 53 | 0.75% | 1.04% | 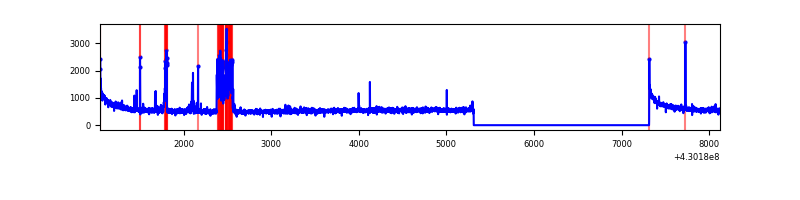 |
| B | 7079 | 5077 | 112 | 112 | 1.58% | 2.21% | 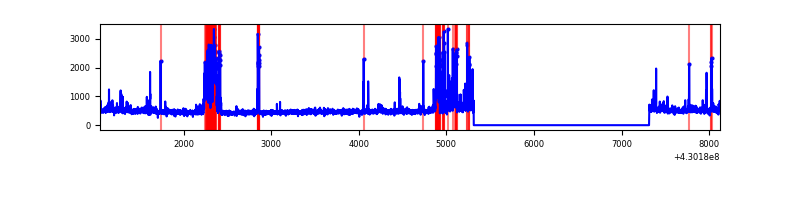 |
| C | 7079 | 5077 | 11 | 11 | 0.16% | 0.22% | 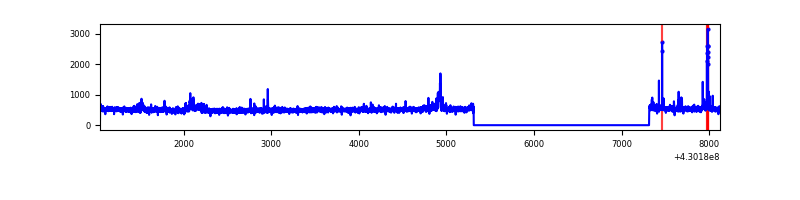 |
| D | 7079 | 5077 | 184 | 184 | 2.60% | 3.62% | 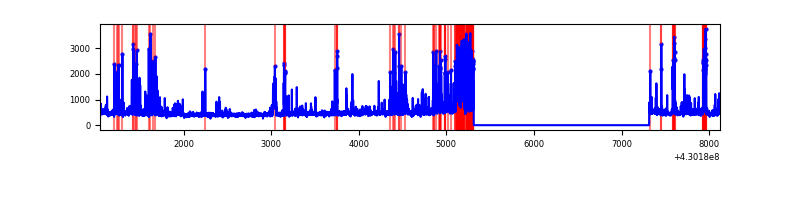 |
Top three noisy pixels from each quadrant. If the there are fewer than three noisy pixels in the level2.evt file, extra rows are filled as -1
| Pixel properties | Quadrant properties | ||||||
|---|---|---|---|---|---|---|---|
| Quadrant | DetID | PixID | Counts | Sigma | Mean | Median | Sigma |
| A | 10 | 83 | 539200 | 4408.22 | 594 | 583 | 122.2 |
| A | 15 | 223 | 247084 | 2017.45 | 594 | 583 | 122.2 |
| A | 15 | 237 | 57875 | 468.9 | 594 | 583 | 122.2 |
| B | 10 | 246 | 246424 | 2170.35 | 590 | 575 | 113.3 |
| B | 0 | 229 | 176363 | 1551.86 | 590 | 575 | 113.3 |
| B | 0 | 245 | 109722 | 963.55 | 590 | 575 | 113.3 |
| C | 15 | 214 | 226560 | 1684.49 | 578 | 581 | 134.2 |
| C | 14 | 254 | 116903 | 867.09 | 578 | 581 | 134.2 |
| C | 8 | 79 | 20219 | 146.39 | 578 | 581 | 134.2 |
| D | 2 | 249 | 416148 | 3025.85 | 567 | 552 | 137.3 |
| D | 12 | 233 | 189216 | 1373.61 | 567 | 552 | 137.3 |
| D | 12 | 6 | 84115 | 608.4 | 567 | 552 | 137.3 |
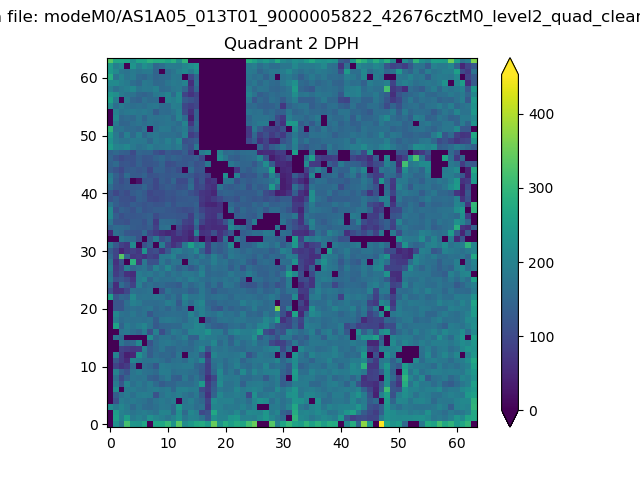
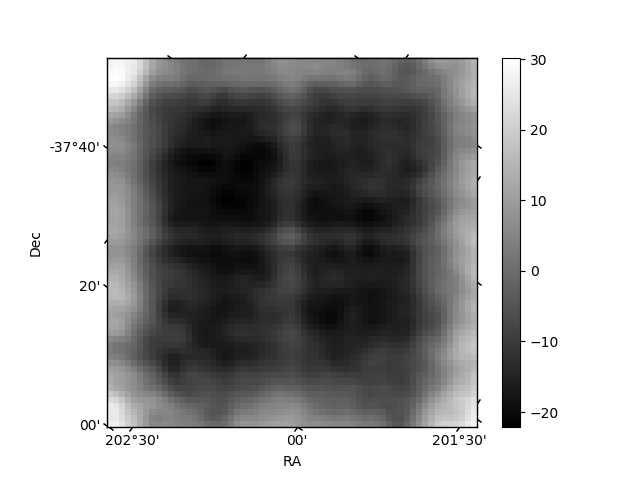
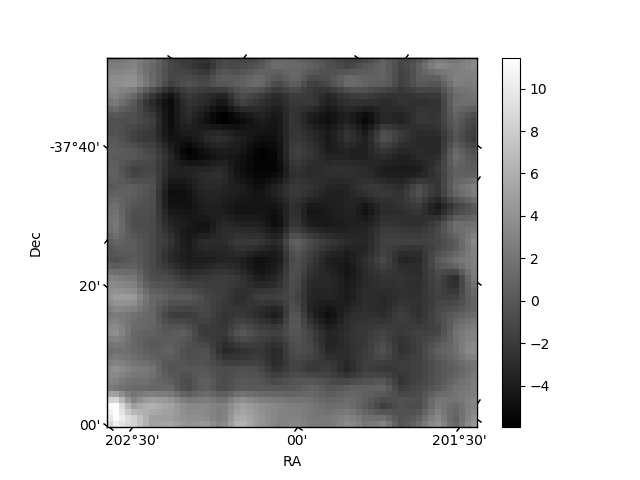
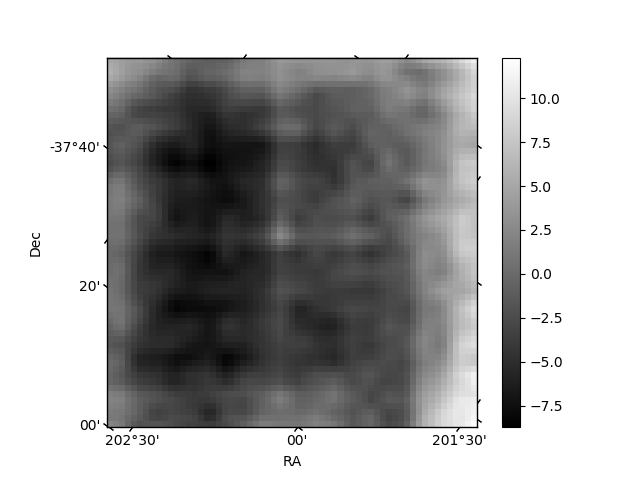
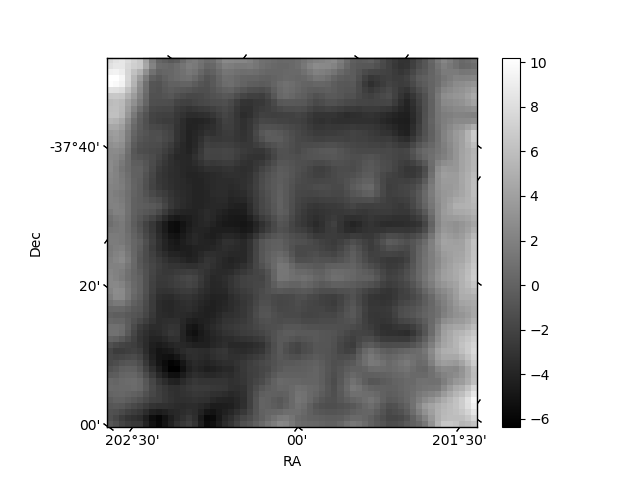
Histogram calculated using DETX and DETY for each event in the final _common_clean file
| Quadrant A | 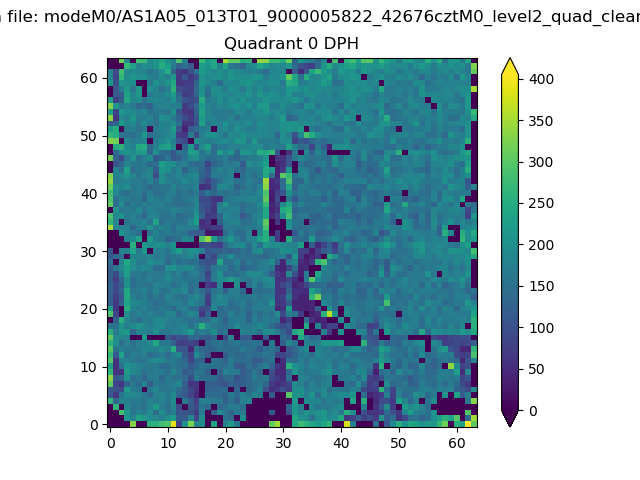 |
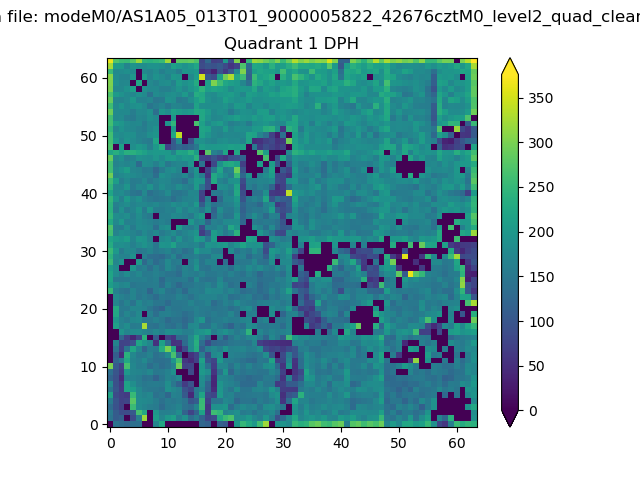 |
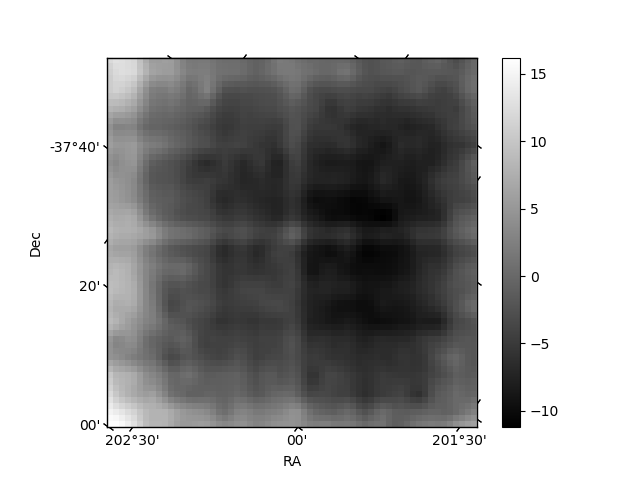
Quadrant B |
|---|---|---|---|
| Quadrant D | 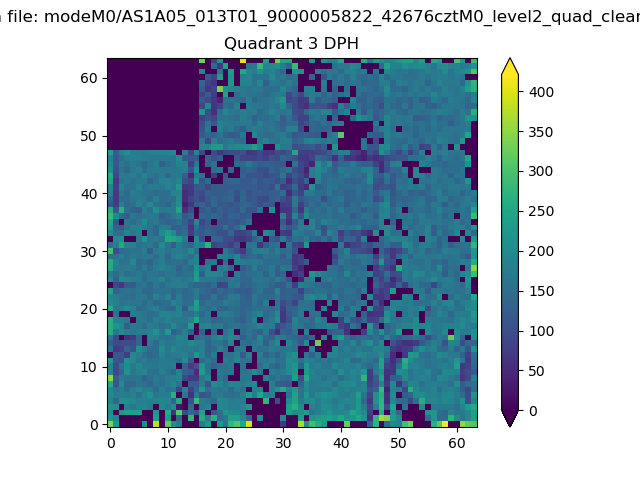 |
 |
Quadrant C |
| Plot type | Count rate plots | Images |
|---|---|---|
| Comparison with Poisson distribution Blue bars denote a histogram of data divided into 1 sec bins. Red curve is a Poisson curve with rate = median count rate of data. |
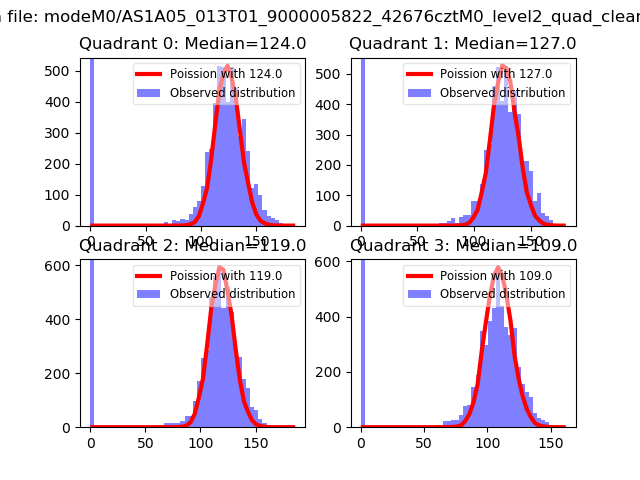 |
 |
| Quadrant-wise count rates Data is divided into 100 sec bins |
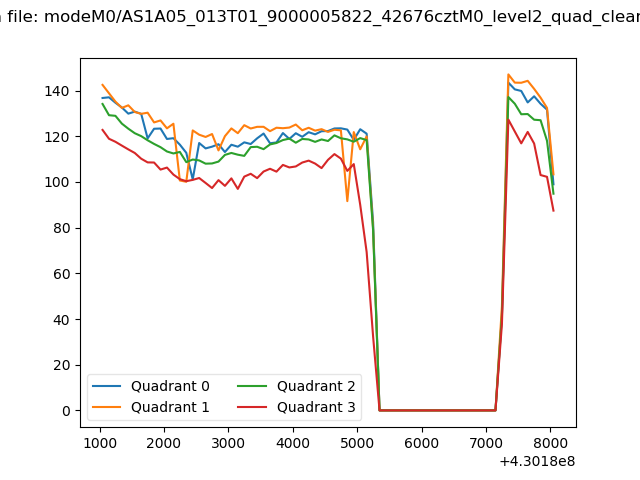 |
|
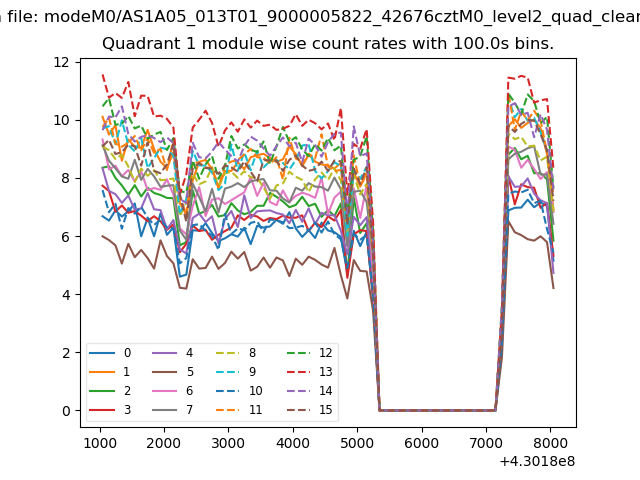
| Module-wise count rates for Quadrant A Data is divided into 100 sec bins |
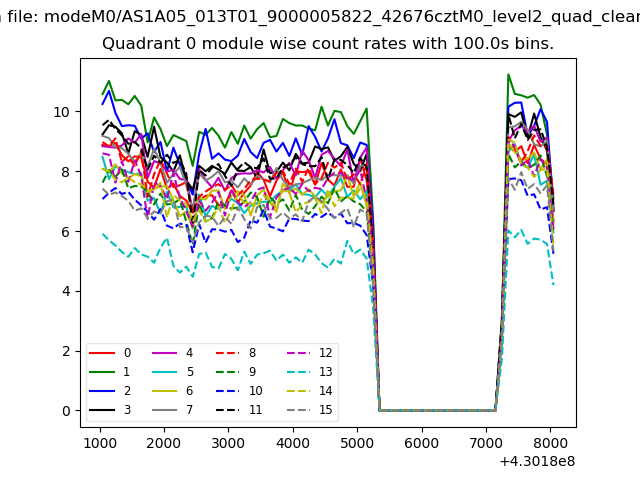 |
 |
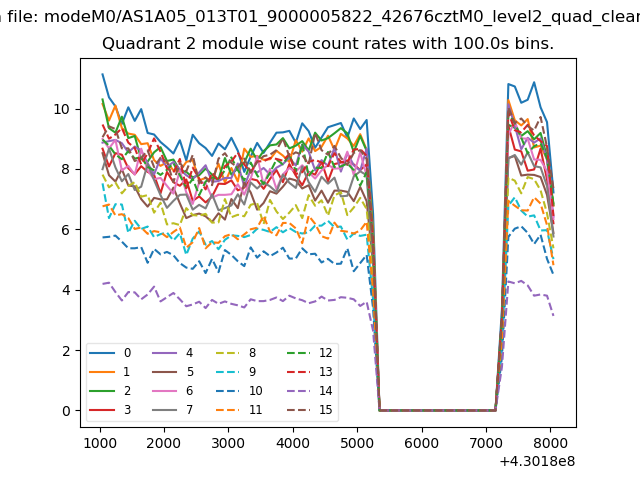
| Module-wise count rates for Quadrant B Data is divided into 100 sec bins |
 |
 |
| Module-wise count rates for Quadrant C Data is divided into 100 sec bins |
 |
 |
| Module-wise count rates for Quadrant D Data is divided into 100 sec bins |
 |
 |
| Parameter | Plot |
|---|---|
| CZT HV Monitor | 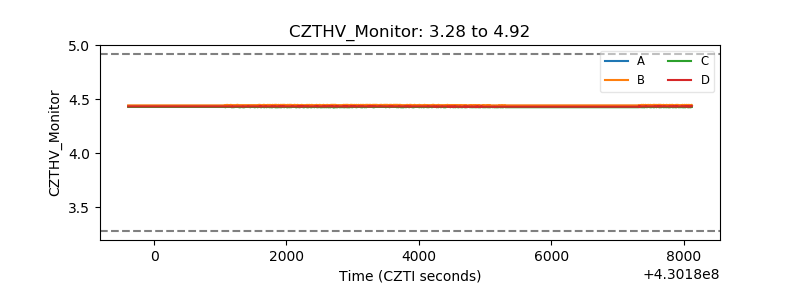 |
| D_VDD | 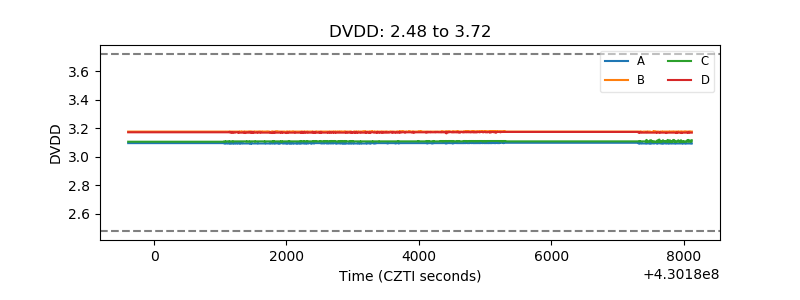 |
| Temperature 1 | 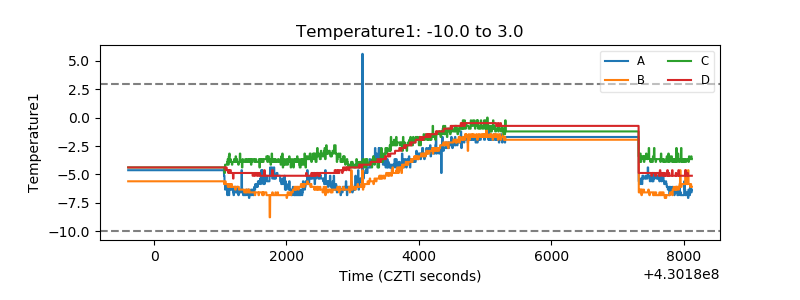 |
| Veto HV Monitor | 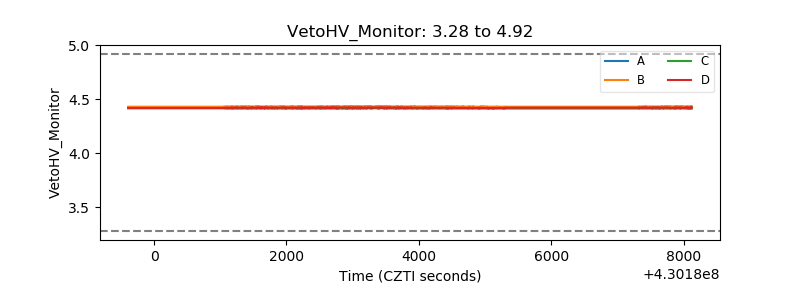 |
| Veto LLD | 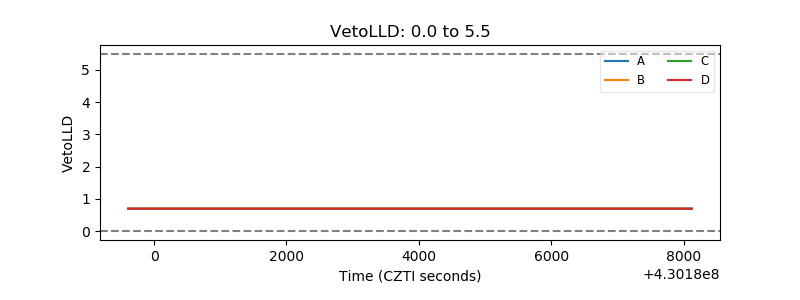 |
| Alpha Counter | 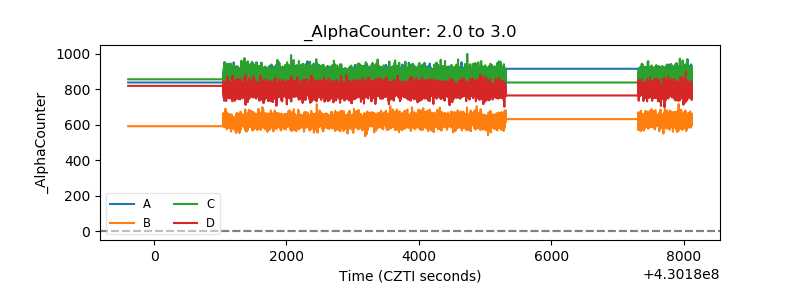 |
| _CPM_Rate | 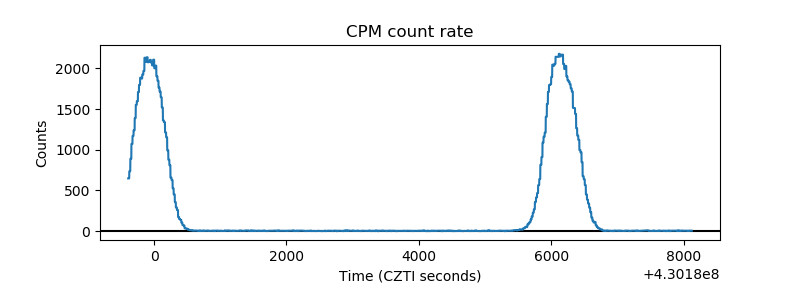 |
| CZT Counter | 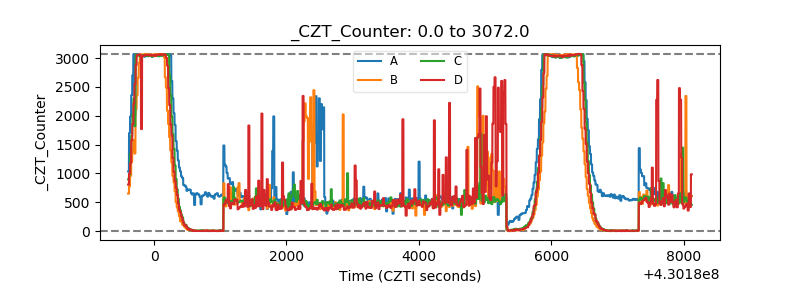 |
| +2.5 Volts monitor | 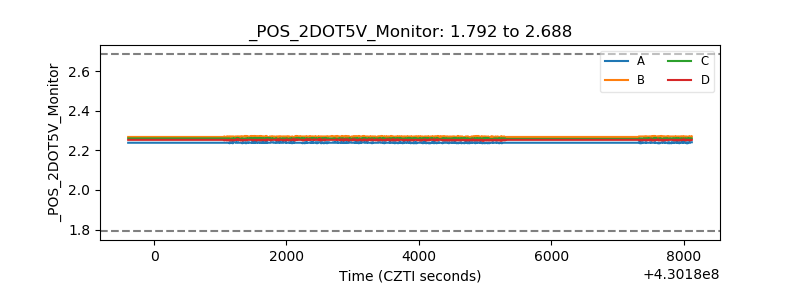 |
| +5 Volts monitor |  |
| _ROLL_ROT | 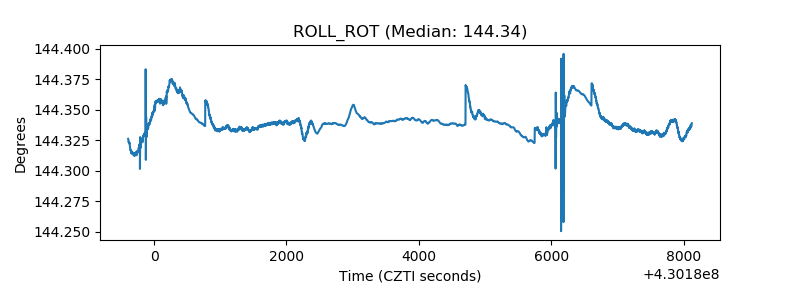 |
| _Roll_DEC | 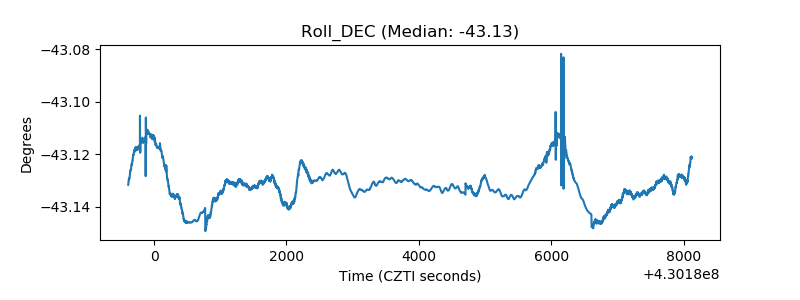 |
| _Roll_RA | 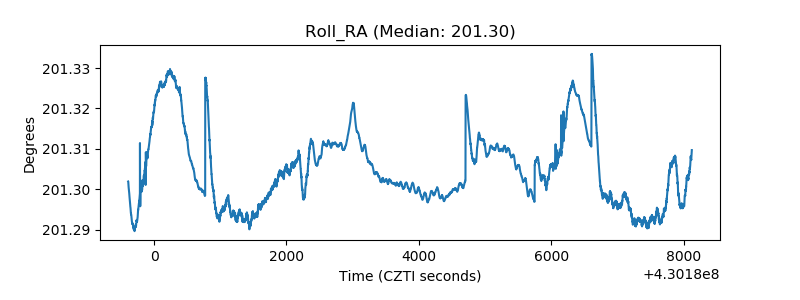 |
| Veto Counter | 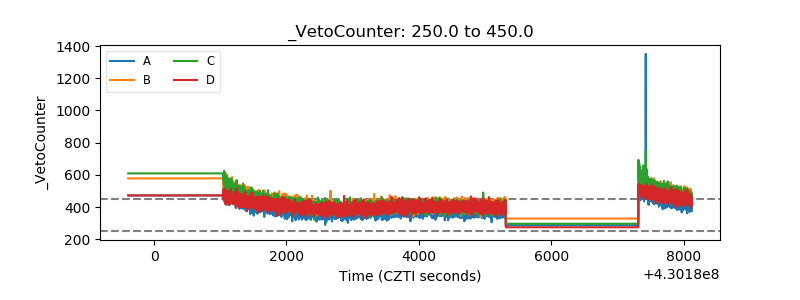 |