| Param | Original file | Final file |
|---|---|---|
| Filename | modeM0/AS1A05_013T01_9000005822_42677cztM0_level2.fits | modeM0/AS1A05_013T01_9000005822_42677cztM0_level2_quad_clean.evt |
| Size (bytes) | 339,117,120 | 96,422,400 |
| Size | 323.4 MB | 92.0 MB |
| Events in quadrant A | 3,193,899 | 661,375 |
| Events in quadrant B | 2,815,205 | 680,750 |
| Events in quadrant C | 2,978,677 | 635,164 |
| Events in quadrant D | 3,157,370 | 575,944 |
| Mode M0 | |||
|---|---|---|---|
| Quadrant | BADHDUFLAG | Total packets | Discarded packets |
| A | 0 | 12564 | 3 |
| B | 0 | 11477 | 2 |
| C | 0 | 11763 | 2 |
| D | 0 | 12823 | 2 |
| Mode M9 | |||
|---|---|---|---|
| Quadrant | BADHDUFLAG | Total packets | Discarded packets |
| A | 0 | 36 | 0 |
| B | 0 | 37 | 0 |
| C | 0 | 37 | 0 |
| D | 0 | 37 | 0 |
| Mode SS | |||
|---|---|---|---|
| Quadrant | BADHDUFLAG | Total packets | Discarded packets |
| A | 0 | 106 | 0 |
| B | 0 | 106 | 0 |
| C | 0 | 106 | 0 |
| D | 0 | 106 | 0 |
| Quadrant | Total seconds | Saturated seconds | Saturation percentage |
|---|---|---|---|
| A | 5238 | 50 | 0.954563% |
| B | 5238 | 45 | 0.859107% |
| C | 5238 | 65 | 1.240932% |
| D | 5238 | 145 | 2.768232% |
Noise dominated data is calculated using 1-second bins in cleaned event files. If a bin has >2000 counts, and if more than 50% of those come from <1% of pixels, then it is considered to be noise-dominated and hence unusable.
| Quadrant | # 1 sec bins | Bins with >0 counts | Bins with >2000 counts | High rate bins dominated by noise | Noise dominated (total time) | Noise dominated (detector-on time) | Marked lightcurve |
|---|---|---|---|---|---|---|---|
| A | 7361 | 5239 | 43 | 43 | 0.58% | 0.82% | 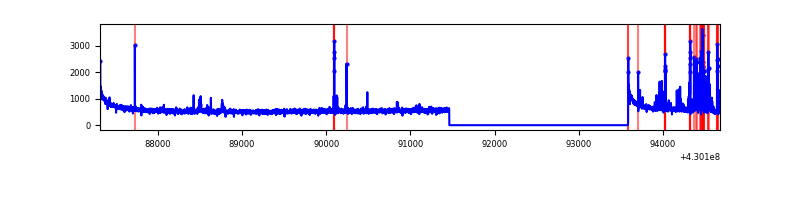 |
| B | 7361 | 5239 | 35 | 35 | 0.48% | 0.67% | 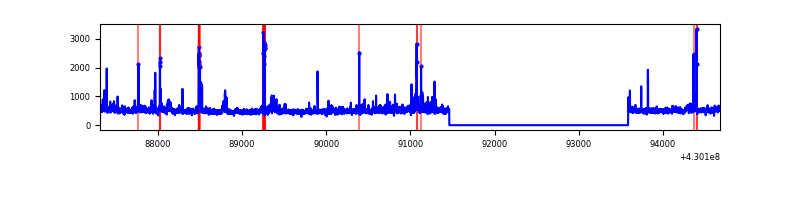 |
| C | 7361 | 5239 | 29 | 29 | 0.39% | 0.55% | 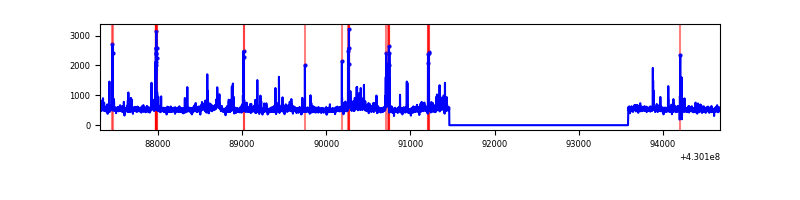 |
| D | 7361 | 5239 | 135 | 135 | 1.83% | 2.58% | 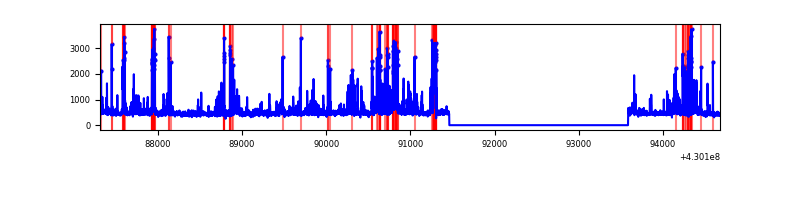 |
Top three noisy pixels from each quadrant. If the there are fewer than three noisy pixels in the level2.evt file, extra rows are filled as -1
| Pixel properties | Quadrant properties | ||||||
|---|---|---|---|---|---|---|---|
| Quadrant | DetID | PixID | Counts | Sigma | Mean | Median | Sigma |
| A | 10 | 83 | 537212 | 4265.03 | 623 | 611 | 125.8 |
| A | 13 | 248 | 200764 | 1590.86 | 623 | 611 | 125.8 |
| A | 15 | 237 | 24116 | 186.82 | 623 | 611 | 125.8 |
| B | 0 | 245 | 168762 | 1434.52 | 620 | 605 | 117.2 |
| B | 10 | 246 | 100598 | 853.03 | 620 | 605 | 117.2 |
| B | 15 | 32 | 28733 | 239.96 | 620 | 605 | 117.2 |
| C | 15 | 214 | 230505 | 1623.86 | 608 | 612 | 141.6 |
| C | 14 | 254 | 161715 | 1137.96 | 608 | 612 | 141.6 |
| C | 8 | 79 | 139057 | 977.91 | 608 | 612 | 141.6 |
| D | 2 | 249 | 436648 | 3014.94 | 602 | 586 | 144.6 |
| D | 1 | 47 | 134751 | 927.62 | 602 | 586 | 144.6 |
| D | 1 | 52 | 118367 | 814.34 | 602 | 586 | 144.6 |
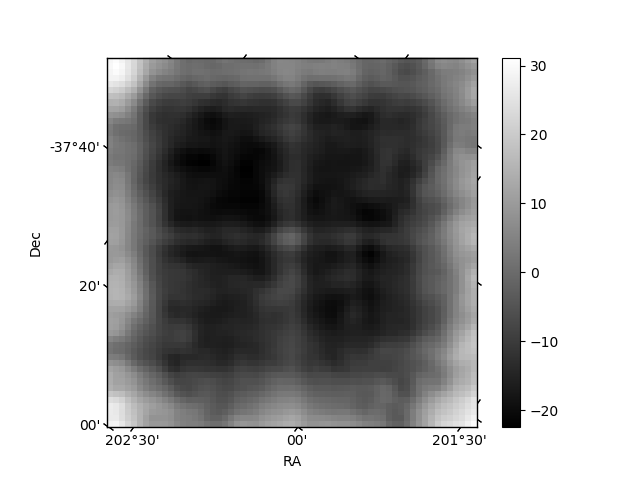
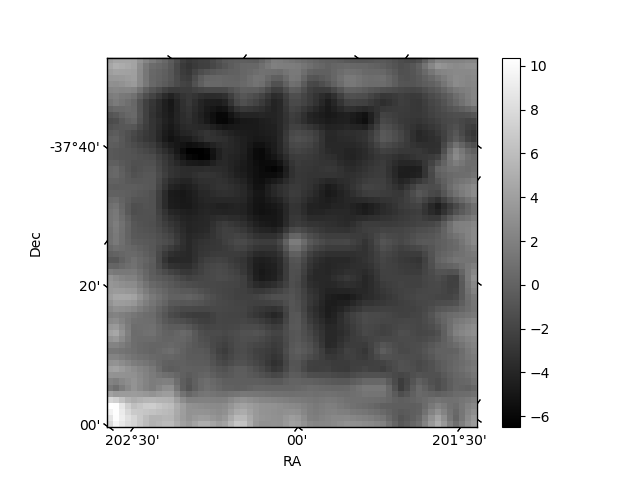
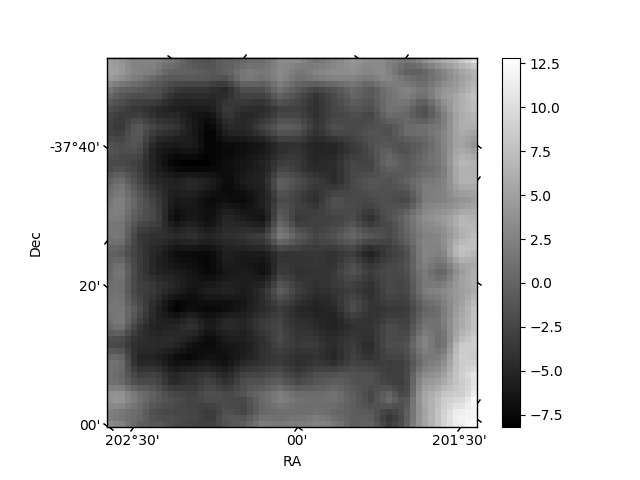
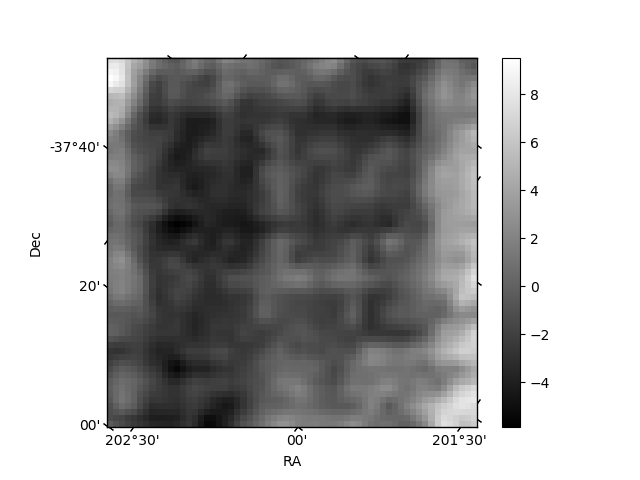
Histogram calculated using DETX and DETY for each event in the final _common_clean file
| Quadrant A | 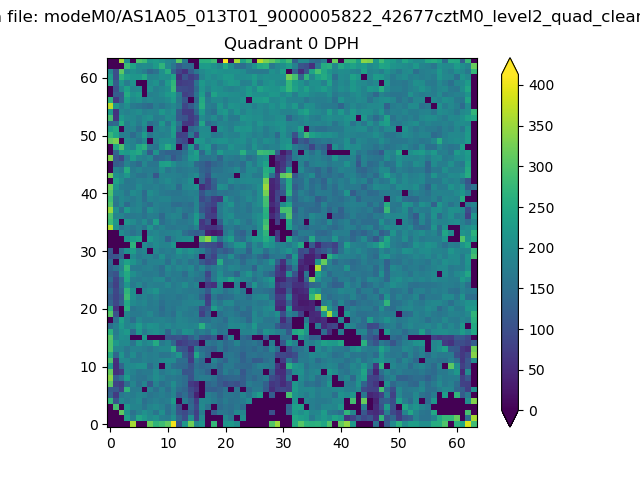 |
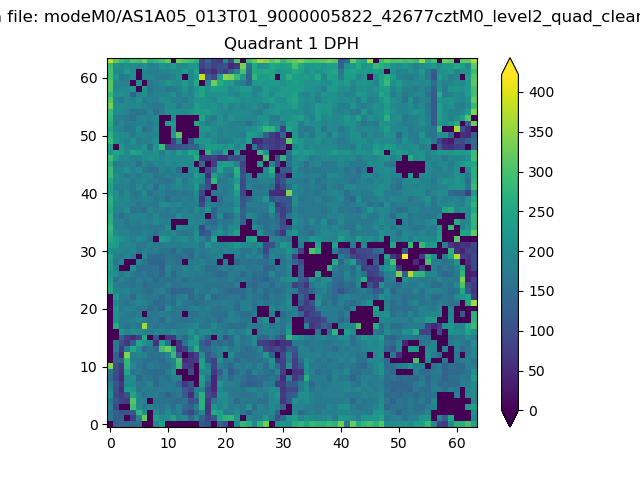 |
Quadrant B |
|---|---|---|---|
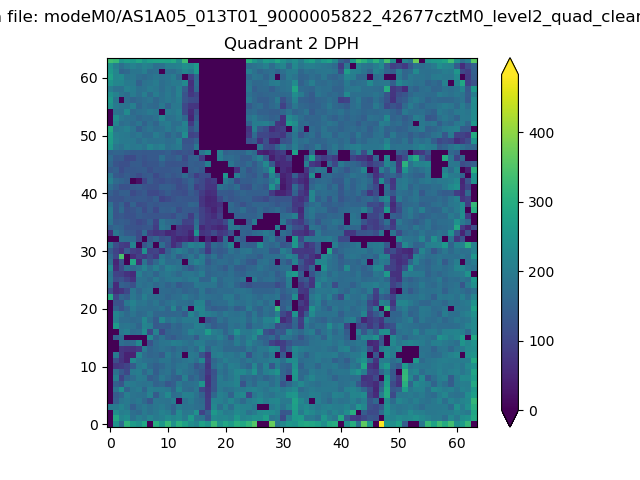
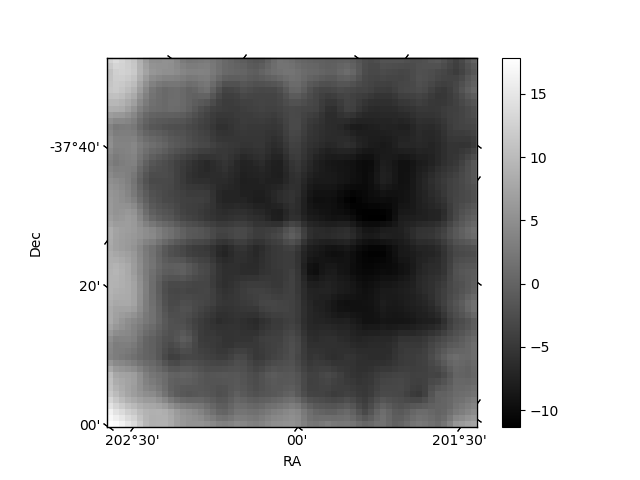
| Quadrant D | 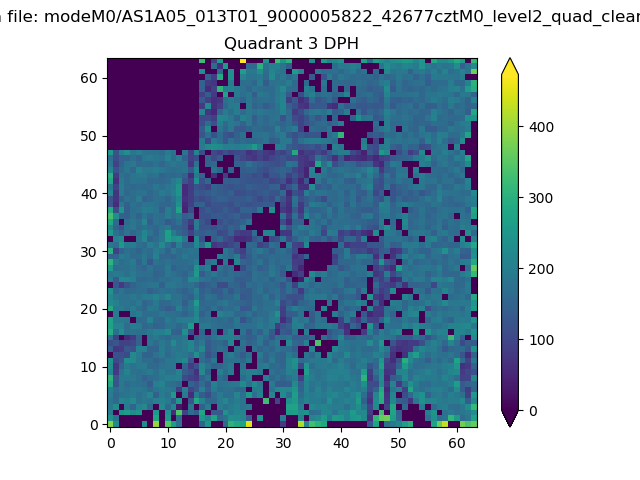 |
 |
Quadrant C |
| Plot type | Count rate plots | Images |
|---|---|---|
| Comparison with Poisson distribution Blue bars denote a histogram of data divided into 1 sec bins. Red curve is a Poisson curve with rate = median count rate of data. |
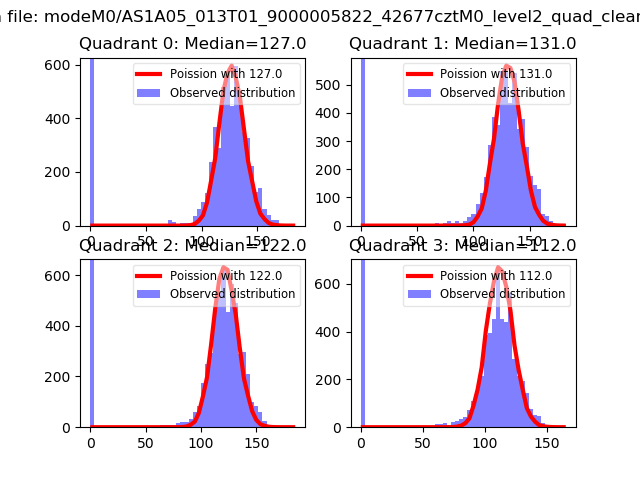 |
 |
| Quadrant-wise count rates Data is divided into 100 sec bins |
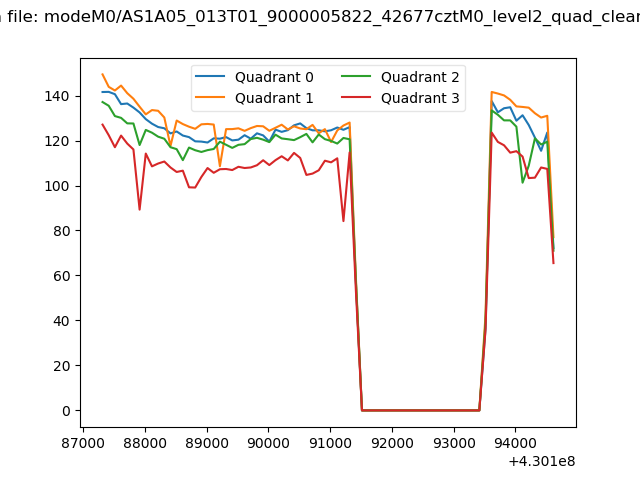 |
|
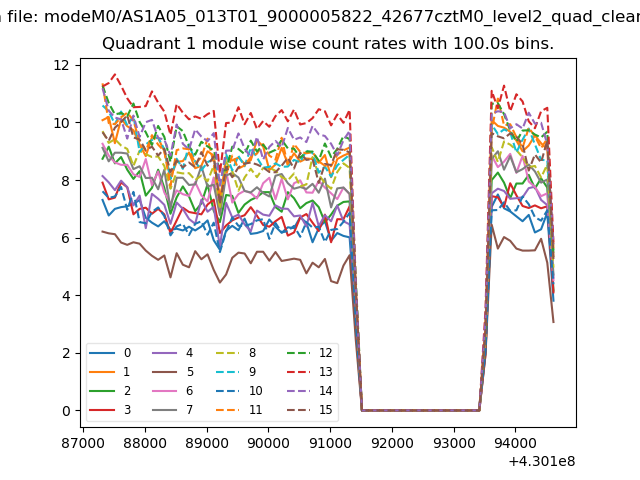
| Module-wise count rates for Quadrant A Data is divided into 100 sec bins |
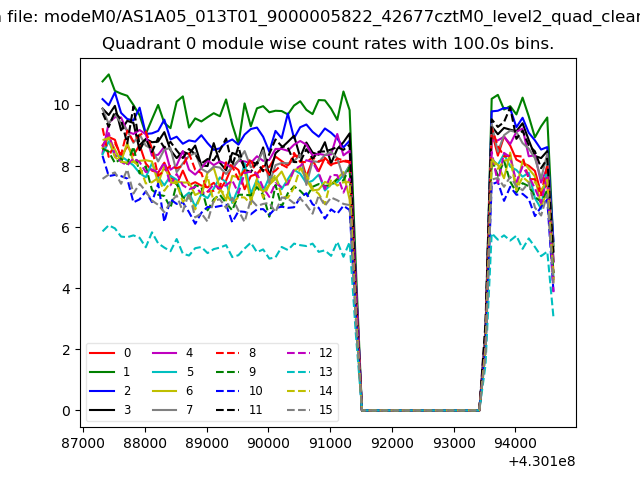 |
 |
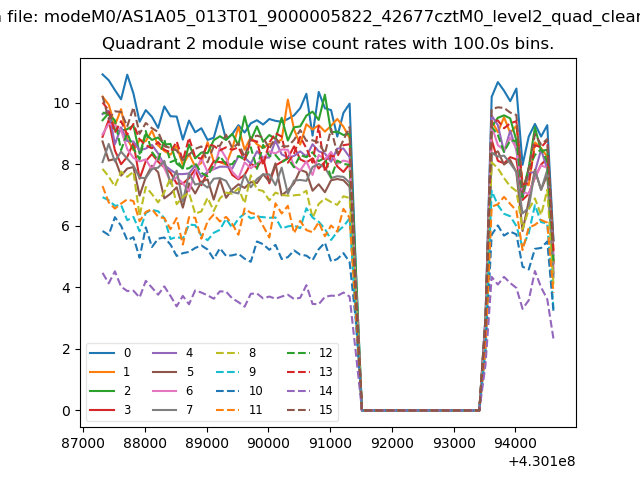
| Module-wise count rates for Quadrant B Data is divided into 100 sec bins |
 |
 |
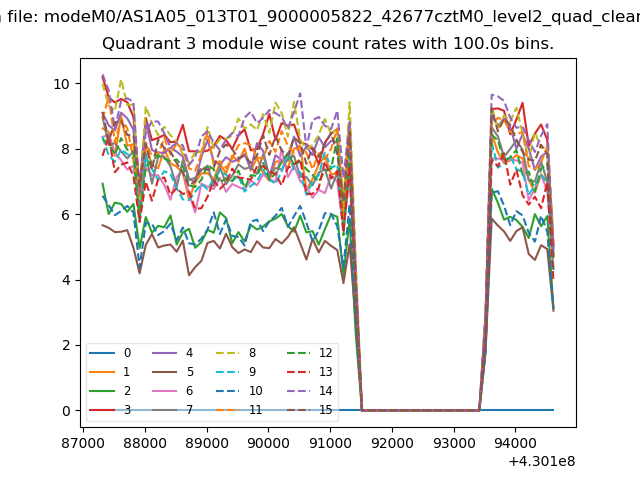
| Module-wise count rates for Quadrant C Data is divided into 100 sec bins |
 |
 |
| Module-wise count rates for Quadrant D Data is divided into 100 sec bins |
 |
 |
| Parameter | Plot |
|---|---|
| CZT HV Monitor | 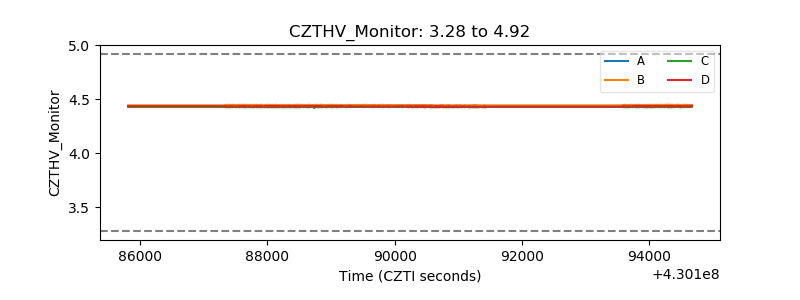 |
| D_VDD | 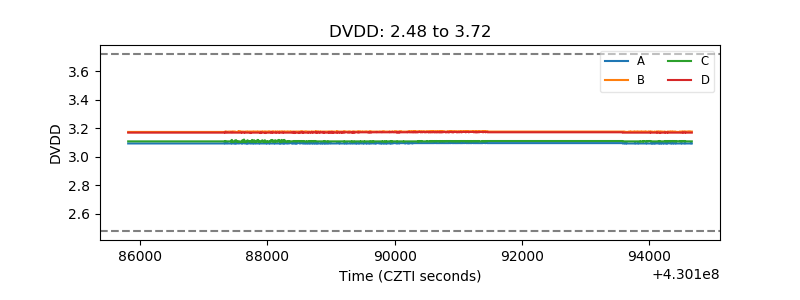 |
| Temperature 1 | 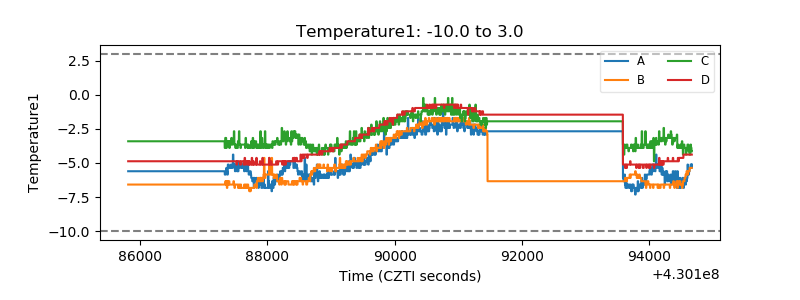 |
| Veto HV Monitor | 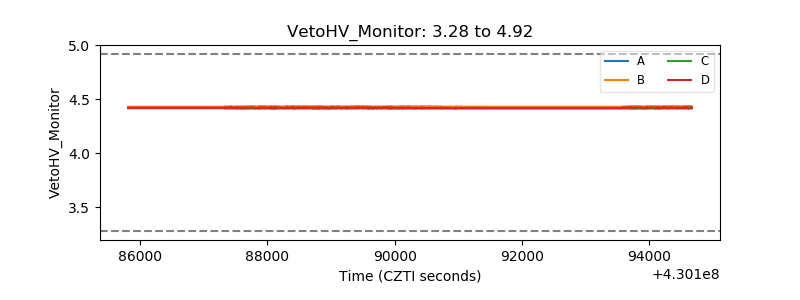 |
| Veto LLD | 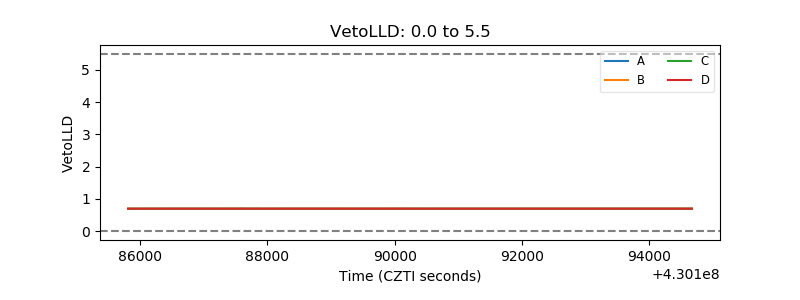 |
| Alpha Counter | 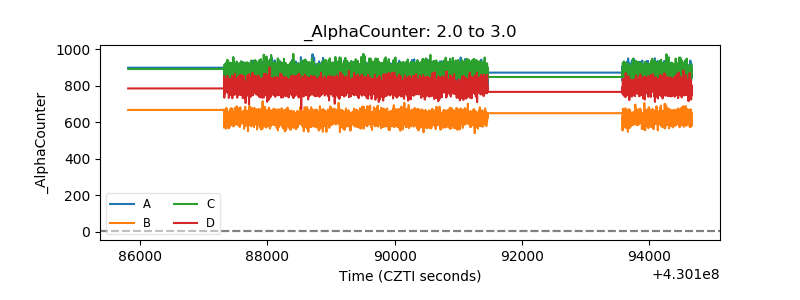 |
| _CPM_Rate | 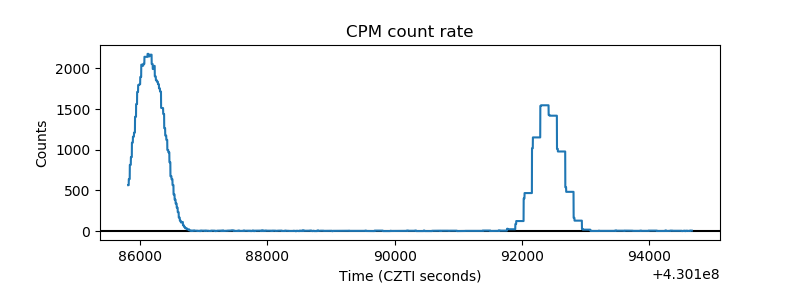 |
| CZT Counter | 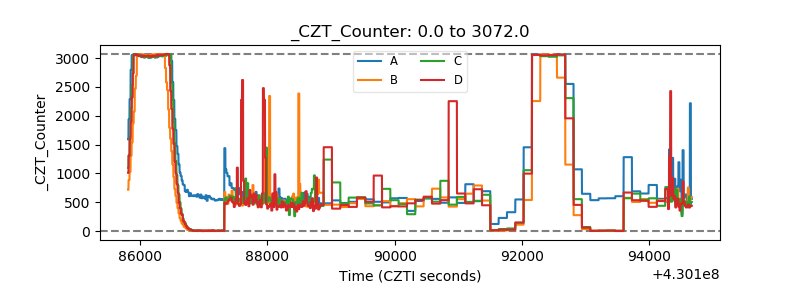 |
| +2.5 Volts monitor | 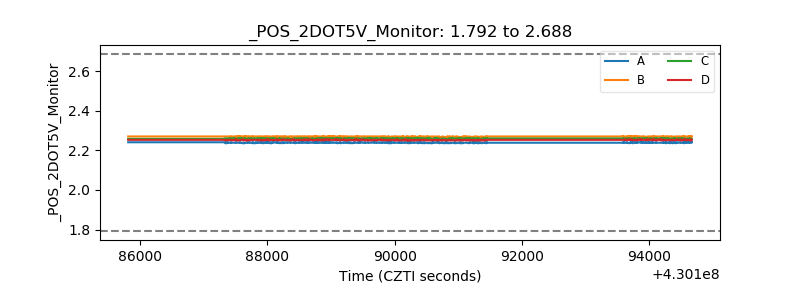 |
| +5 Volts monitor |  |
| _ROLL_ROT | 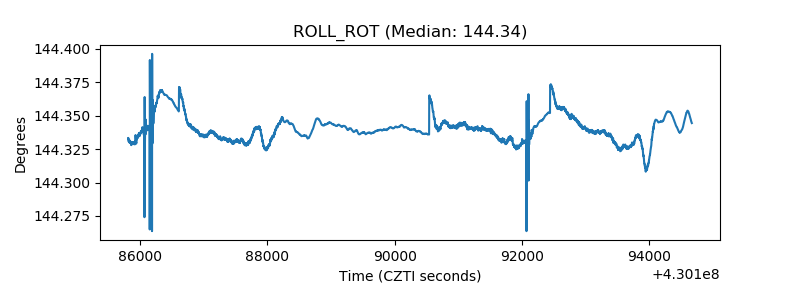 |
| _Roll_DEC |  |
| _Roll_RA | 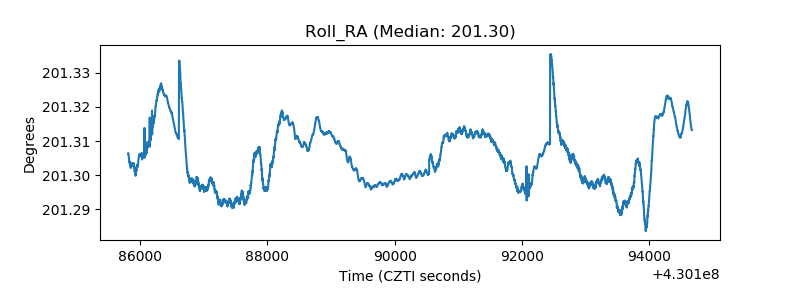 |
| Veto Counter | 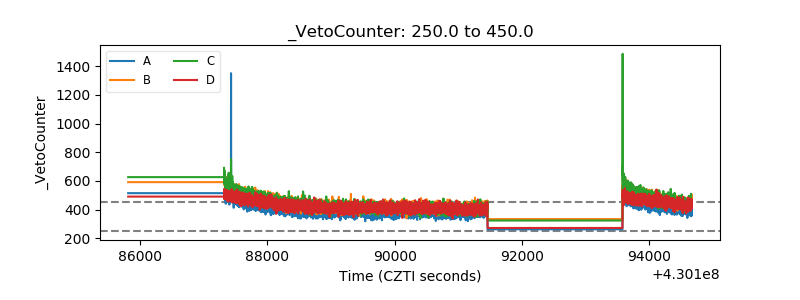 |