| Param | Original file | Final file |
|---|---|---|
| Filename | modeM0/AS1A05_013T01_9000005822_42678cztM0_level2.fits | modeM0/AS1A05_013T01_9000005822_42678cztM0_level2_quad_clean.evt |
| Size (bytes) | 329,592,960 | 91,673,280 |
| Size | 314.3 MB | 87.4 MB |
| Events in quadrant A | 3,160,464 | 624,693 |
| Events in quadrant B | 2,608,662 | 646,852 |
| Events in quadrant C | 2,686,844 | 606,535 |
| Events in quadrant D | 3,349,855 | 543,233 |
| Mode M0 | |||
|---|---|---|---|
| Quadrant | BADHDUFLAG | Total packets | Discarded packets |
| A | 0 | 12331 | 2 |
| B | 0 | 10812 | 2 |
| C | 0 | 10680 | 2 |
| D | 0 | 13296 | 2 |
| Mode M9 | |||
|---|---|---|---|
| Quadrant | BADHDUFLAG | Total packets | Discarded packets |
| A | 0 | 22 | 0 |
| B | 0 | 22 | 0 |
| C | 0 | 22 | 0 |
| D | 0 | 22 | 0 |
| Mode SS | |||
|---|---|---|---|
| Quadrant | BADHDUFLAG | Total packets | Discarded packets |
| A | 0 | 102 | 0 |
| B | 0 | 102 | 0 |
| C | 0 | 102 | 0 |
| D | 0 | 102 | 0 |
| Quadrant | Total seconds | Saturated seconds | Saturation percentage |
|---|---|---|---|
| A | 5065 | 66 | 1.303060% |
| B | 5066 | 24 | 0.473747% |
| C | 5066 | 33 | 0.651402% |
| D | 5066 | 217 | 4.283458% |
Noise dominated data is calculated using 1-second bins in cleaned event files. If a bin has >2000 counts, and if more than 50% of those come from <1% of pixels, then it is considered to be noise-dominated and hence unusable.
| Quadrant | # 1 sec bins | Bins with >0 counts | Bins with >2000 counts | High rate bins dominated by noise | Noise dominated (total time) | Noise dominated (detector-on time) | Marked lightcurve |
|---|---|---|---|---|---|---|---|
| A | 7187 | 5066 | 50 | 50 | 0.70% | 0.99% | 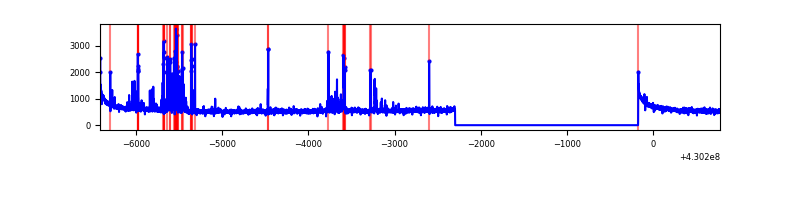 |
| B | 7188 | 5067 | 14 | 14 | 0.19% | 0.28% | 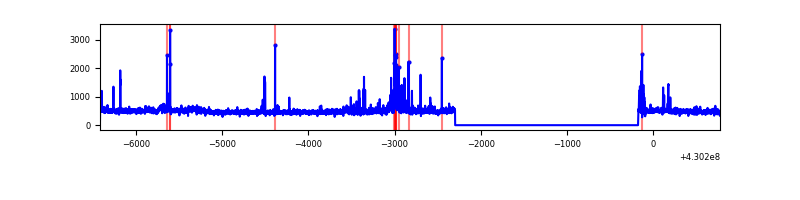 |
| C | 7188 | 5067 | 1 | 1 | 0.01% | 0.02% | 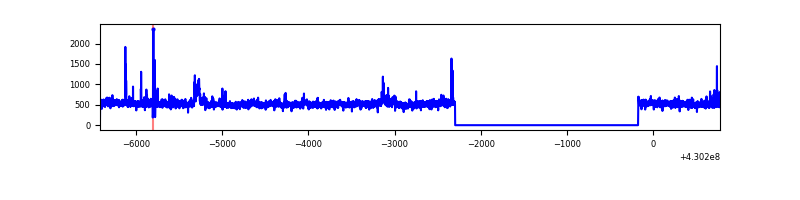 |
| D | 7188 | 5067 | 200 | 200 | 2.78% | 3.95% | 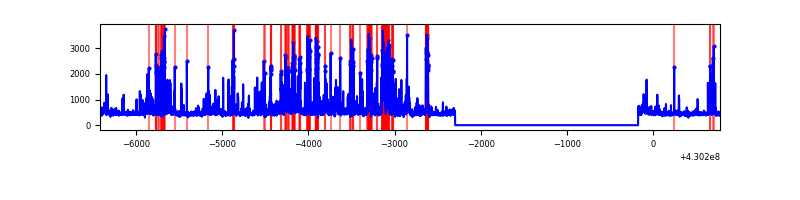 |
Top three noisy pixels from each quadrant. If the there are fewer than three noisy pixels in the level2.evt file, extra rows are filled as -1
| Pixel properties | Quadrant properties | ||||||
|---|---|---|---|---|---|---|---|
| Quadrant | DetID | PixID | Counts | Sigma | Mean | Median | Sigma |
| A | 10 | 83 | 555090 | 4586.49 | 597 | 585 | 120.9 |
| A | 13 | 248 | 188763 | 1556.48 | 597 | 585 | 120.9 |
| A | 15 | 223 | 65380 | 535.94 | 597 | 585 | 120.9 |
| B | 0 | 245 | 65305 | 566.25 | 594 | 580 | 114.3 |
| B | 3 | 112 | 39611 | 341.46 | 594 | 580 | 114.3 |
| B | 15 | 85 | 33861 | 291.16 | 594 | 580 | 114.3 |
| C | 15 | 214 | 213796 | 1587.34 | 582 | 586 | 134.3 |
| C | 8 | 79 | 105897 | 784.04 | 582 | 586 | 134.3 |
| C | 14 | 254 | 30940 | 225.98 | 582 | 586 | 134.3 |
| D | 2 | 249 | 550733 | 3968.98 | 574 | 558 | 138.6 |
| D | 5 | 70 | 132526 | 952.02 | 574 | 558 | 138.6 |
| D | 1 | 47 | 111201 | 798.18 | 574 | 558 | 138.6 |
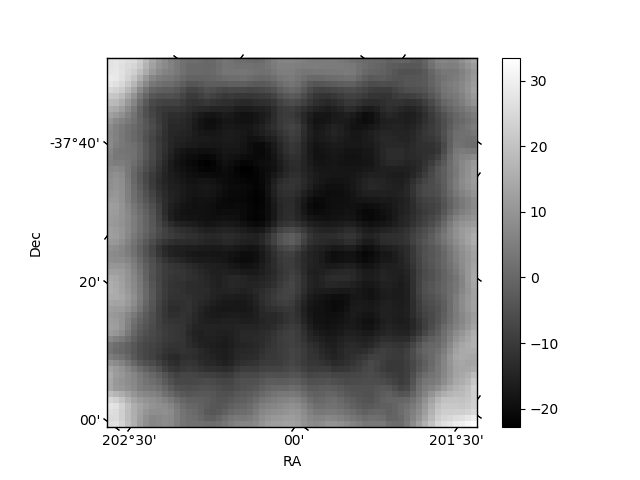
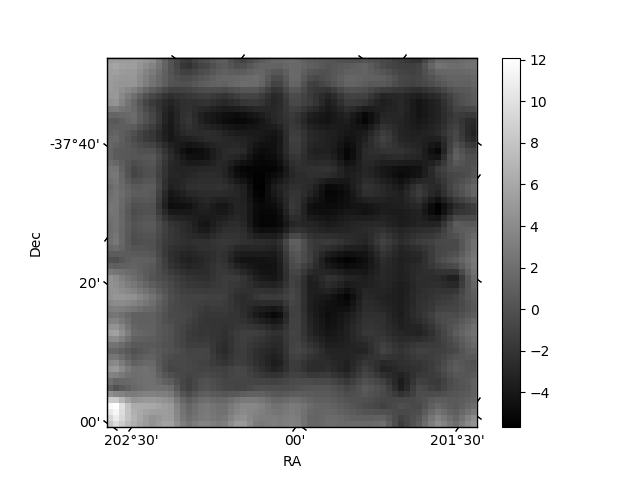
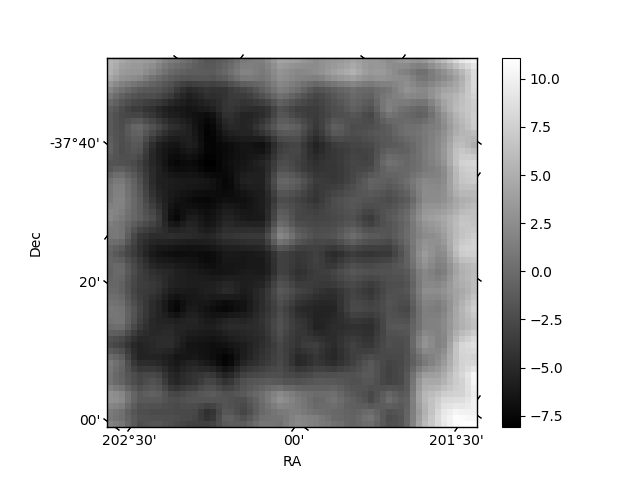
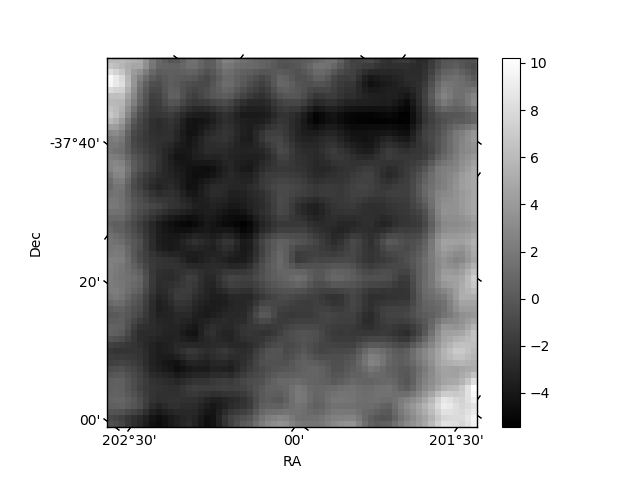
Histogram calculated using DETX and DETY for each event in the final _common_clean file
| Quadrant A | 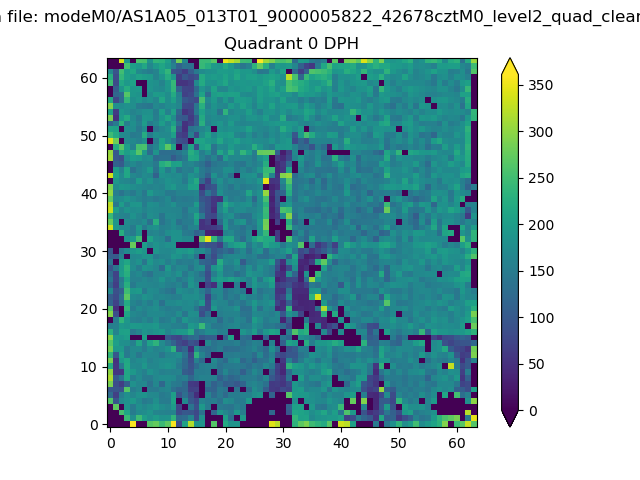 |
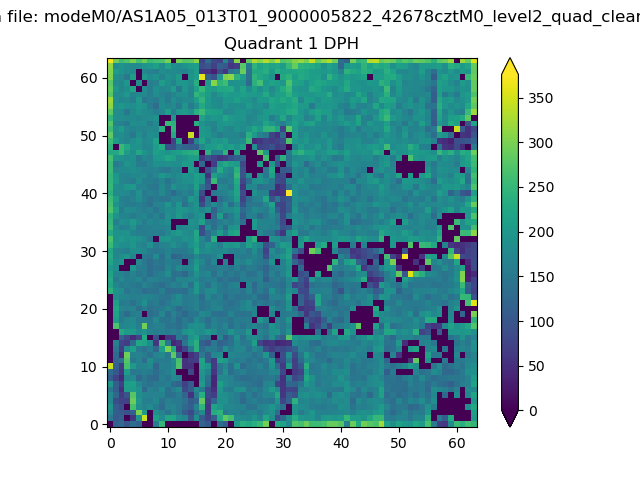 |
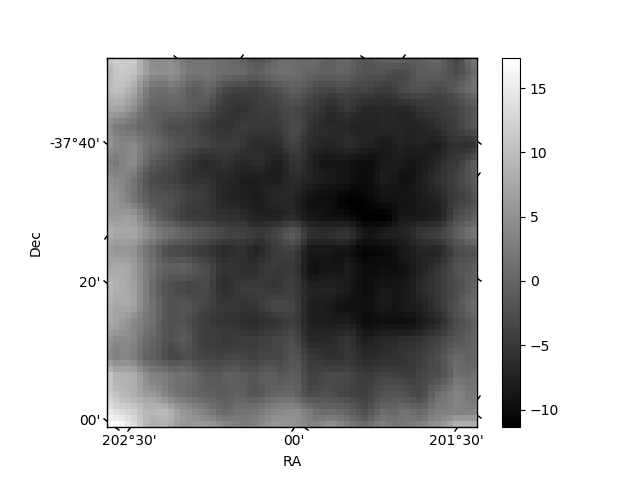
Quadrant B |
|---|---|---|---|
| Quadrant D | 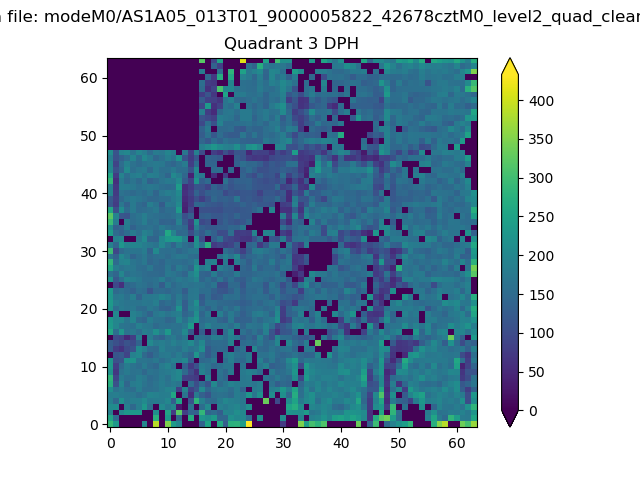 |
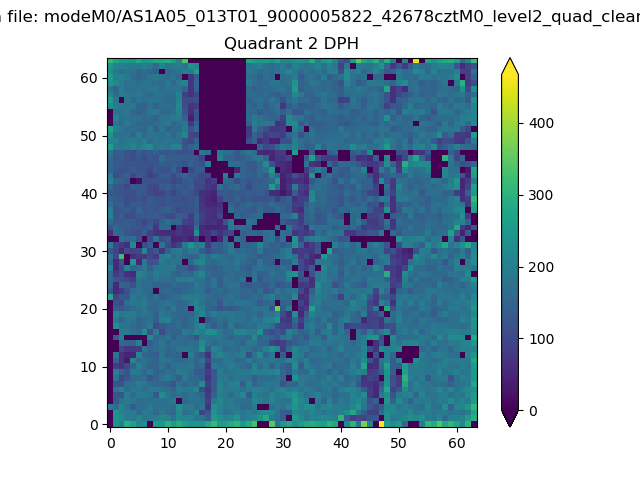 |
Quadrant C |
| Plot type | Count rate plots | Images |
|---|---|---|
| Comparison with Poisson distribution Blue bars denote a histogram of data divided into 1 sec bins. Red curve is a Poisson curve with rate = median count rate of data. |
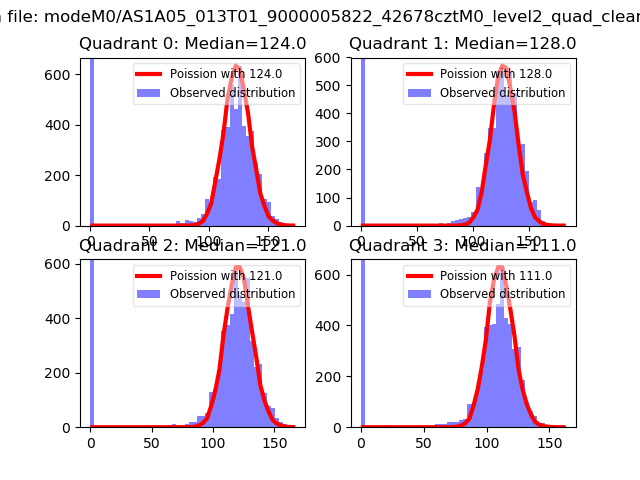 |
 |
| Quadrant-wise count rates Data is divided into 100 sec bins |
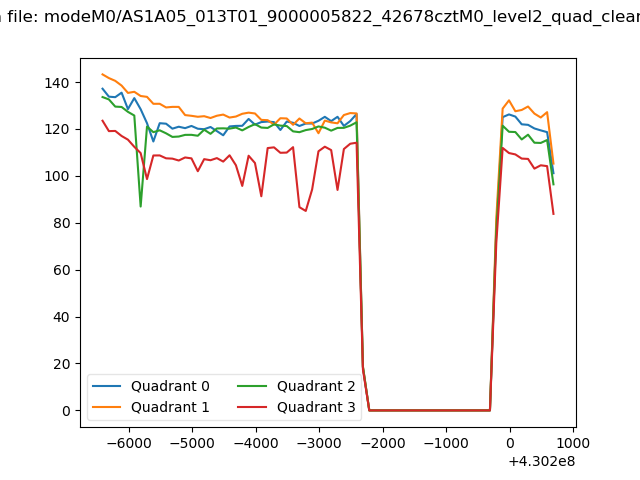 |
|
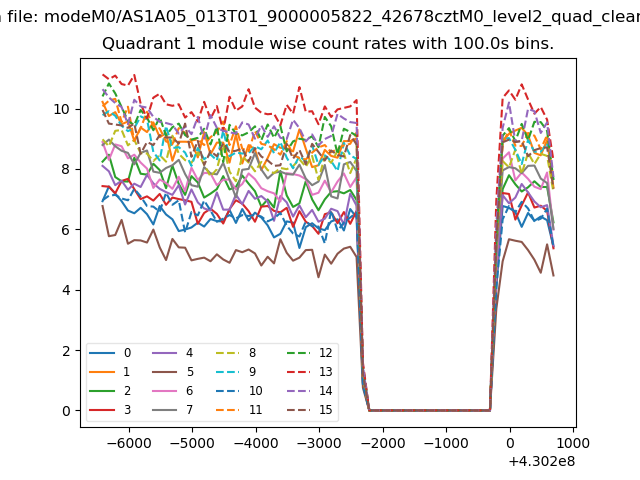
| Module-wise count rates for Quadrant A Data is divided into 100 sec bins |
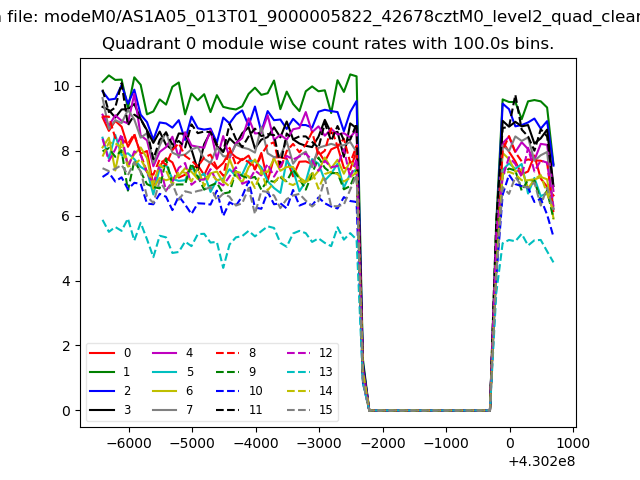 |
 |
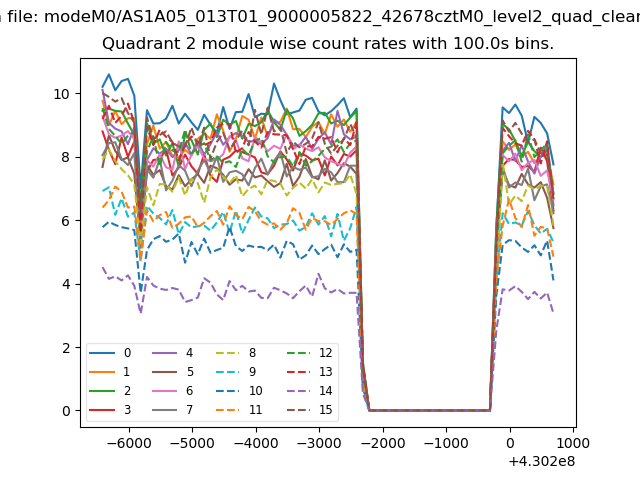
| Module-wise count rates for Quadrant B Data is divided into 100 sec bins |
 |
 |
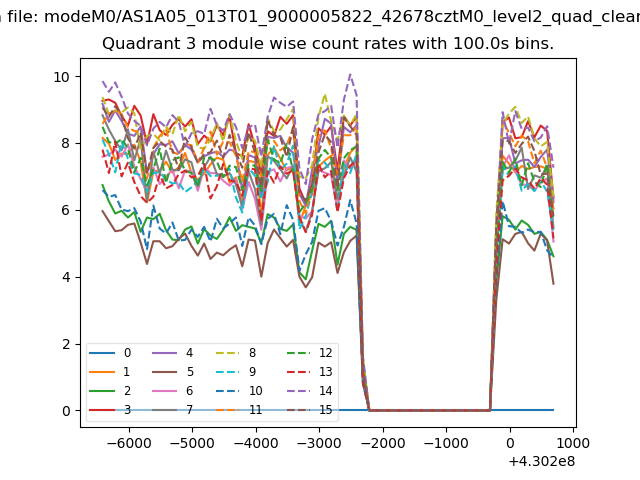
| Module-wise count rates for Quadrant C Data is divided into 100 sec bins |
 |
 |
| Module-wise count rates for Quadrant D Data is divided into 100 sec bins |
 |
 |
| Parameter | Plot |
|---|---|
| CZT HV Monitor | 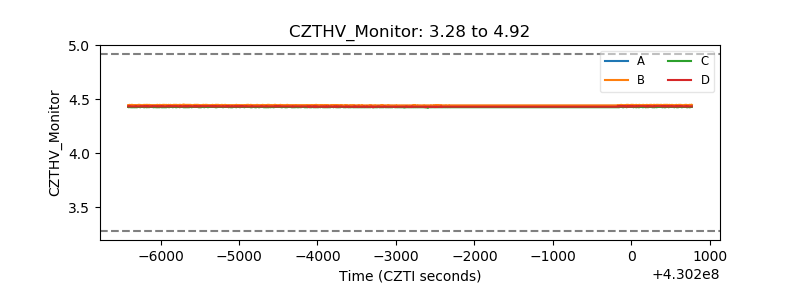 |
| D_VDD | 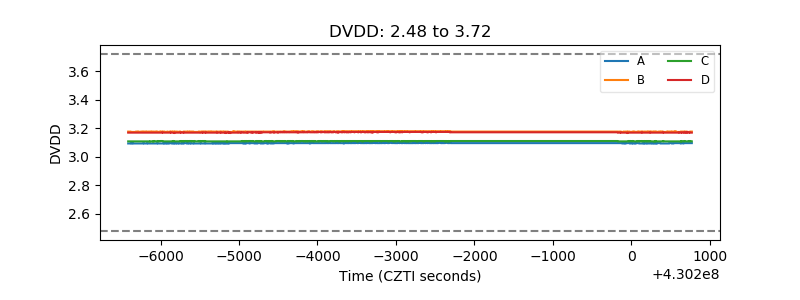 |
| Temperature 1 | 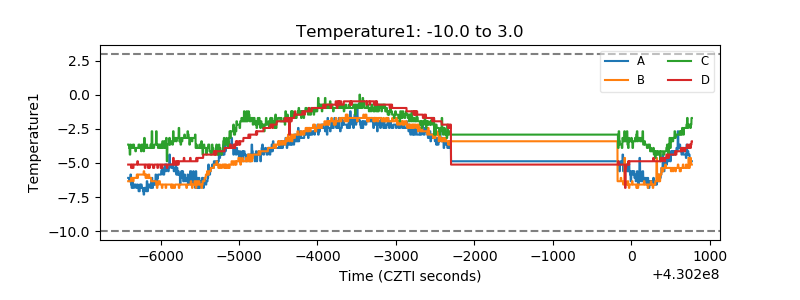 |
| Veto HV Monitor | 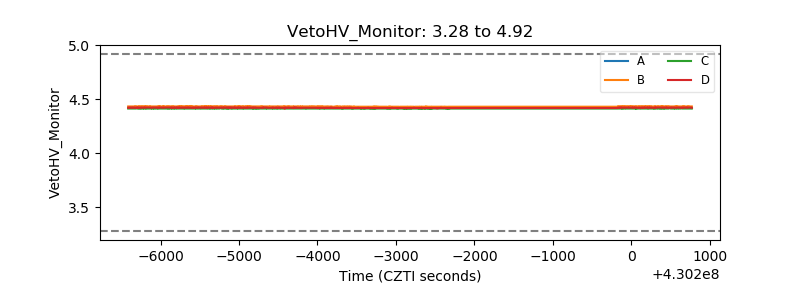 |
| Veto LLD | 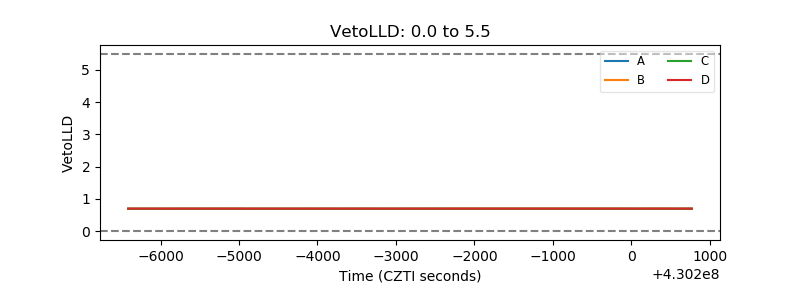 |
| Alpha Counter | 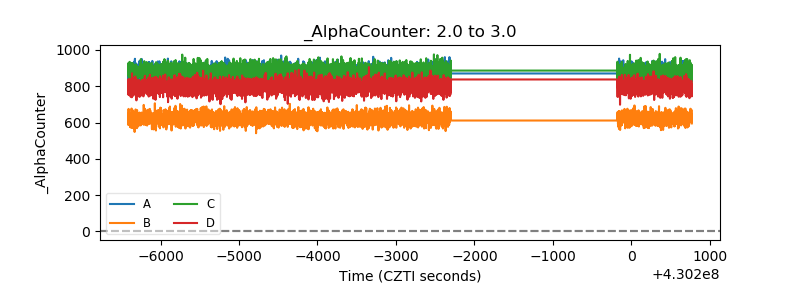 |
| _CPM_Rate | 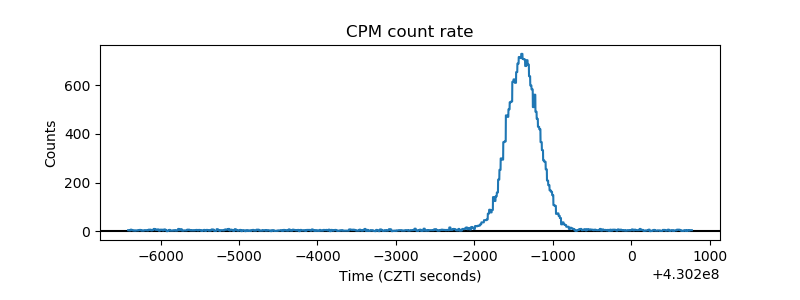 |
| CZT Counter | 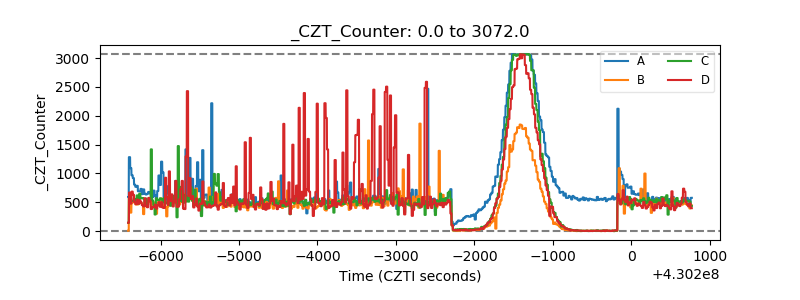 |
| +2.5 Volts monitor | 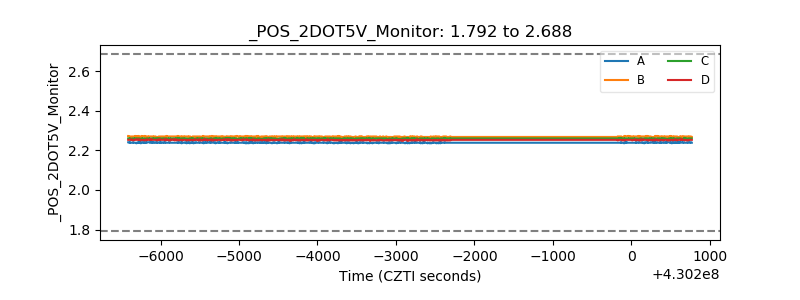 |
| +5 Volts monitor | 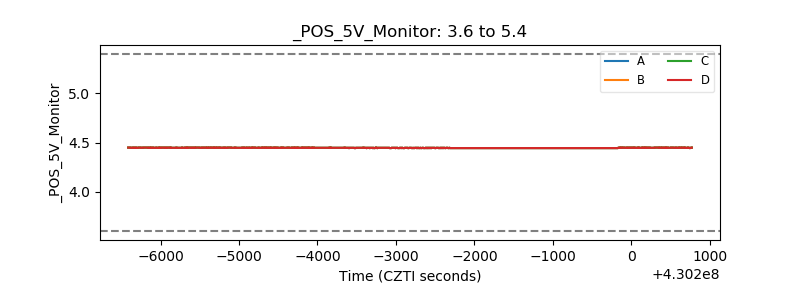 |
| _ROLL_ROT | 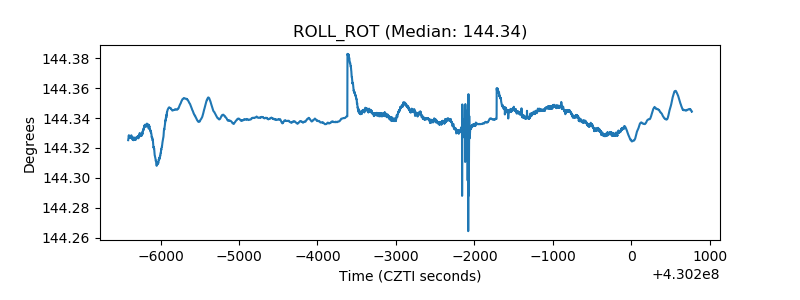 |
| _Roll_DEC | 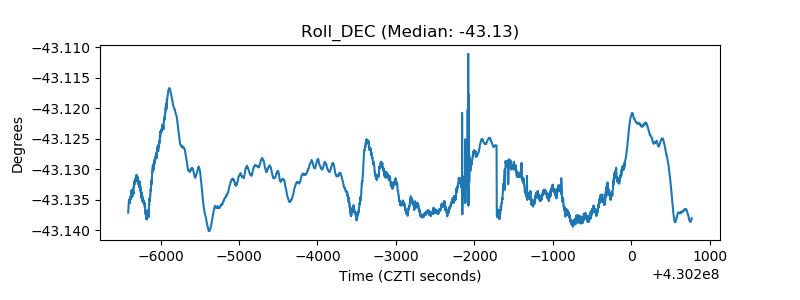 |
| _Roll_RA | 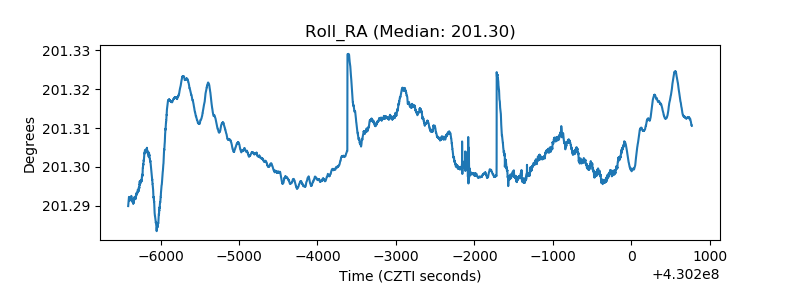 |
| Veto Counter | 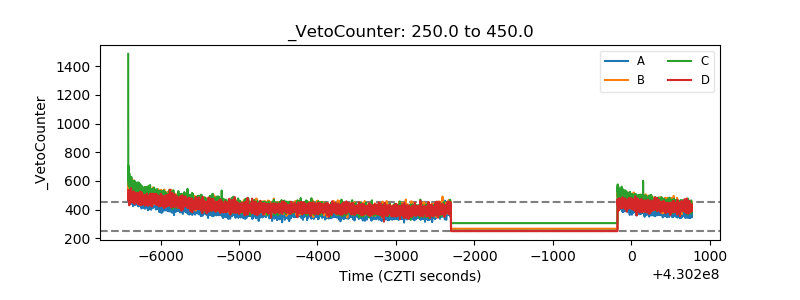 |